Bearish Forecast for the Dow Jones Starting May 15, 2025Bearish Forecast for the Dow Jones Starting May 15, 2025
The Dow Jones Industrial Average is poised to begin a significant decline, potentially as early as today, May 15, 2025, targeting a retest of the price low from April 7, 2025 (~36,611.78), and possibly lower. This movement is driven by renewed trade tensions, disappointing economic data, and bearish market sentiment.
1. Fundamental Factors Driving Potential Decline
Fundamental factors provide the macroeconomic and policy-driven rationale for the anticipated downturn in the Dow Jones.
1.1. Renewed Uncertainty in Trade Policy
The Dow’s rally on May 12–13, 2025, was fueled by optimism over a temporary U.S.-China tariff reduction agreement (90-day truce) announced after talks in Switzerland on May 11, 2025. However, as of May 15, 2025, investor confidence is faltering due to a lack of progress in ongoing U.S.-China trade negotiations.
Trigger for May 15: A Reuters report from May 14, 2025, notes that U.S. Trade Representative Jamieson Greer and Treasury Secretary Scott Bessent are meeting with Chinese officials, but no new agreements have been confirmed. If today’s talks fail to deliver positive outcomes or if President Trump escalates tariff rhetoric, the Dow could plummet, as seen in early April when tariffs triggered a 5.5% single-day drop. The Dow, with its heavy weighting of multinational corporations, is particularly vulnerable to trade war fears, which could drive it toward the April 7 low as investors price in higher costs and slower global growth.
1.2. Disappointments in Economic Data
CPI Reaction: The April 2025 Consumer Price Index (CPI), released on May 14, 2025, showed inflation at 2.3% annually, below the expected 2.4%. However, the Dow’s decline (-0.6%) on May 14 suggests investors expected a lower figure to support Federal Reserve rate cuts, reflecting skepticism about inflation cooling further.
Producer Price Index (PPI) Release on May 15: The PPI for April 2025, due at 8:30 AM ET (2:30 PM CEST) on May 15, 2025, is critical. A higher-than-expected PPI, potentially driven by tariff-related cost pressures, could signal rising consumer prices, reducing hopes for Fed easing and triggering a sell-off. Consensus expects a 0.2% monthly increase; a reading above 0.3% could echo the April market reaction when GDP contraction fears pushed the Dow to 36,611.78.
Consumer Sentiment: The University of Michigan Consumer Sentiment Index for May 2025, released on May 14, likely showed continued weakness (April: 52.2, a multi-year low). A further decline could heighten concerns about reduced consumer spending, impacting Dow components like Walmart and Home Depot.
1.3. Concerns Over Federal Reserve Policy
On May 7, 2025, Fed Chair Jerome Powell cited “elevated uncertainty” due to trade policies, with markets expecting 75 basis points of rate cuts in 2025, starting in July. If today’s PPI or Initial Jobless Claims (8:30 AM ET) indicate persistent inflation or economic weakness, rate cut expectations could fade, increasing borrowing costs and pressuring Dow valuations, mirroring the April 7 recession fears.
2. Technical Analysis
The Dow’s initial decline in April was approximately -19.00%, with a second impulse of similar magnitude. Technical indicators suggest a bearish setup for May 15, 2025:
Current Level: The Dow closed at 42,051.06 on May 14, 2025, down 0.6%, testing support at 42,000.
Bearish Signals: A 12-hour timeframe analysis indicates alignment for a decline, with potential bearish candlestick patterns (e.g., bearish engulfing) and overbought RSI (70). A break below 42,000 could target the 200-day moving average (40,500) and the April 7 low of 36,611.78.
Price Targets:
Retest of April 7, 2025, low: ~36,611.78
Secondary target: ~35,970.70 (based on Fibonacci extensions and prior support zones).
3. Market Sentiment and Behavioral Factors
Fragile Optimism: The Dow’s 15% recovery from April lows was driven by trade truce hopes and select stock strength. Bloomberg’s May 14, 2025, report notes Wall Street’s rebound is “showing signs of exhaustion” due to trade risks. The Dow’s May 14 weakness, led by an 18% UnitedHealth drop, could spread if negative news emerges today.
Global Correlation: Mixed Asian market performance on May 14 (e.g., Nikkei up 1.43%, India’s Nifty 50 down 1.27%) suggests vulnerability. A lower Asian open on May 15, driven by U.S. declines or trade news, could amplify selling pressure on the Dow.
4. Evidence-Based Framework for the Forecast
4.1. Catalysts for Today’s Decline (May 15, 2025)
PPI Data (8:30 AM ET): A PPI reading above 0.3% could signal sticky inflation, reducing Fed rate cut odds and sparking a sell-off.
Trade Talk Updates: Negative U.S.-China trade comments (e.g., no Geneva deal) could reignite fears, mirroring April 7.
Initial Jobless Claims (8:30 AM ET): Claims above 220,000 (vs. prior 211,000) could signal labor market weakness, fueling recession concerns.
4.2. Dow Scenario
Expect a wave-like decline with corrections. The Dow could fall below 36,611.78, potentially reaching ~35,970.70 if trade and economic pressures intensify. Extreme caution is advised in 2025.
4.3. Global Scenario for S&P 500
I anticipate a wave-like decline with intermittent corrections. I wouldn’t be surprised if the S&P 500 falls below 4,700, potentially reaching 4,200. Extreme caution is warranted this year. There’s even a theory that, starting in 2025, the U.S. dollar could lose 50% of its purchasing power.
Idea:
New Screenshot:
4.4. Oil and Geopolitical Outlook
I expect oil (Brent) to decline to the $50+/- range, from which an upward trend may begin, potentially tied to future military conflicts:
· Europe vs. Russia
· India vs. Pakistan
· Iran vs. Israel
Brent (UKOIL):
Natural Gas:
Djx

Ride the Japanese Wave, Don't Grab That China Falling KnifeIt was nearly three years ago when the China stock market notched a short-term peak. Recall how the world's second-largest economy was initially seen as a growth engine coming out of the worst of the pandemic. An authoritative regime in China, led by President Xi Jinping, crippled the economy's expansion trajectory through harsh ongoing lockdowns and by clamping down on many industries, one after another. Then in early 2023, hope sprang eternal that China would re-open amid a burst of consumer spending, a la what was seen during the 'revenge travel' period in the United States back in 2021 and 2022. That did not come to fruition, and the Hang Seng Index is now down by more than 50% in the last three years.
With all that turmoil going on in China, Japan's Nikkei 225 Index has continued to soar. Up more than 20% since February of 2021, the once sleepy Tokyo stock market features among the best momentum readings of all countries. Based on these trends, sticking with the 'long Nikkei, short China' trade should keep working, in my view. Another way to play it is by being long developed market stocks and avoiding emerging market funds (which still have a roughly 20% allocation to China).
Finally, while China trades at a single-digit P/E ratio today, Japan is by no means expensive. Goldman Sachs notes that the country's current 12-month forward earnings multiple is just 14.9, about average compared to its 20-year history (Asia-Pac ex-Japan is 12.3x, for perspective). Interestingly, Japan is back up to 6% of the global stock market allocation while China has sunk to just 3%. Perhaps it is indeed the land of the rising sun while China is a classic "sub"-merging market.
A solid ETF to play Japan continues to be the WisdomTree Japan Hedged Equity ETF (DXJ) which hedges exposure to the Japanese Yen. The ETF has a solid track record of outperforming other Japanese country funds.


11 Trade Ideas Predicting The DJI Crash | Where Is The Bottom?The Dow Jones Industrial Averages index has been holding much, much better compared to the S&P 500 and Nasdaq indexes.
While the other two indexes have been down considerably since we started to predict the crash (18% SPX & 25% NDX), the Dow Jones (DJI) has gone down only by 12%.
This is the last one of this series of articles.
Feel free to relax as we get started!
Thanks a lot for your support.
---
Let's start with the chart above on the Monthly timeframe.
The DJI closed last month below EMA10 and it is now signaling lower.
We use EMA10 to gauge the short-term potential of a cryptocurrency trading pair, stock or chart.
So the short-term potential has gone bearish... This we normally say based on the daily (24 hours per candle) timeframe.
Since this is the monthly, each candle is ~30X stronger than the daily.
Which means that this very simple signal can yet be very strong.
---
We started in late January to look at the Dow Jones.
We don't need/use 100 indicators, the very simple moving averages for us are more than enough.
Here we saw that the Dow Jones is no exception, it was also set to drop!
(Jan. 24) The Dow Jones Industrial Average Is No Exception (Crash)
Two days later we looked at the famous 'Falling Wedge" pattern and compared it to 2020-2018...
This one on the monthly timeframe.
(Jan. 26) Dow Jones Industrial Average Monthly Chart Analysis (30%+ Crash)
We can appreciate how the DJI was looking better than the SPX and NDX...
Yet, the indicators, such as the MACD, gave it away!
(Jan. 28) The Dow Jones Industrial Average: Not All Red
Dead cat bounce, anyone?
Easy to tell... We stay conservative though to not scare you away.
How to prevent a crash if the Feds policy do not change?
A: Impossible
(Feb. 7) DJI Weak Bounce
And here too for the initial phases of the correction we look at the classic ABC.
(Feb. 11) DJI Crash Last Reminder
To me, the next one was the biggest give away of all.
The long-term cycles are very strong but what to say when an index loses a 20 years long support?
We are talking about the MACD on this one...
(Feb. 14) DJI And The 20 Year MACD Support
We step back to sum it all up...
It is possible that the DJI goes for a 50% or more drop... Who knows, let's ask the chart!
(Mar. 4) DJI | Dow Jones Industrial Average (Additional 55% Drop)
By mid-March we shared the "bear-run"!
This is happening across all markets and will continue a bit longer before we see sustained/long-term growth.
(Mar. 13) DJI Bear Run
This is all for the major US Indexes.
We will go back to Bitcoin soon and then focus 100% on the Altcoins which is where the money grows.
---
In all, we published:
(1) 26 trade ideas for the SPX (all bearish).
(2) 14 trade ideas for the NDX (all bearish).
(3) 11 trade ideas for the DJI (all bearish).
For Bitcoin (BTCUSD), we share the Macro/Long-Term view as well as the short-term bounces/moves when prices go up.
You can count on us being here by the time the bottom is reached and when we hit $300,000 or more in 2025 and beyond.
Namaste.

💾 DJI Bear-Run 2023 & Beyond | The New World OrderWhy do you think there is such a strong rush to close/shutdown everything crypto?
The traditional global financial system is about to crash and they don't want competition. Remember, they are owned by banks and banks are used to having a monopoly on money.
If the financial system crashes due to its many weaknesses, it will lose all of its customers to the other side.
If they can shut down the other side, people can just cry and rebel but they would have no other choice other than to use what is available.
Now there is an alternative.
So they will have to either come up with real solutions (not likely) or become obsolete as it is the norm.
The only constant is change in this world.
The DJI is about to crash.
We have a peak January 2022 followed by lower highs.
This month the DJI has gone below EMA10 and the indicators are trending down.
It seems that it will be worse than 2008... No worries, back in 2008 we didn't have Bitcoin, it will be interesting to see how things will develop this time around, to say the least.
Bitcoin was invented for this exact type of situation.
Will the experiment work?
Or will Bitcoin and Cryptocurrency go down with the rest of the old system that it is intended to be the solution for?
My money is on change.
If you look back at history, nothing ever stays the same.
Let it crash...
A New World Order will emerge.
Namaste.

💾 DJI Bullish But Why? & BitcoinNotice how the August 2022 peak is followed by a strong correction, instantly.
The November and December 2022 peak is followed by sideways consolidation.
That's why I consider this chart to be bullish.
I make the same argument for Bitcoin.
In the past, each time a peak is hit we have a strong correction immediately after.
In the present, as each new peak is hit, we get sideways consolidation.
That's a bullish signal.
Thank you for reading.
Namaste.


DJI And The 20 Year MACD SupportWe have the Dow Jones Industrial Average Index (DJI) opening red below MA200... Full bearish control.
This is the same signal we looked at on the S&P 500 Index (SPX).
Just like Ethereum, Cardano, Bitcoin, Solana, Polkadot, etc. The SPX, DJI, NDX all move together.
What one does, the rest follows.
Here is the daily MACD for the DJI:
We just lost a 20+ year long support.
This is a very bad signal that tells us of a potentially strong correction to come.
The correction has already started.
What is left is only to know how much lower can it go.
I've mapped multiple support levels on this and previous charts.
Namaste.

Bearish Stockmarket DJXA fortnight ago gave us a real warning with big drops in the market.
10th May was the last higher high and the stochastic RSI showed pressure and selling commenced
.Close to a month later 7th June the stochastic RSI was overbought once again but this time the price had dropped a lower high position
The structure is the same and the price making a 2nd lower high.
Being out of the market and being patient right now is a smart move
These are my opinions of how I view the market

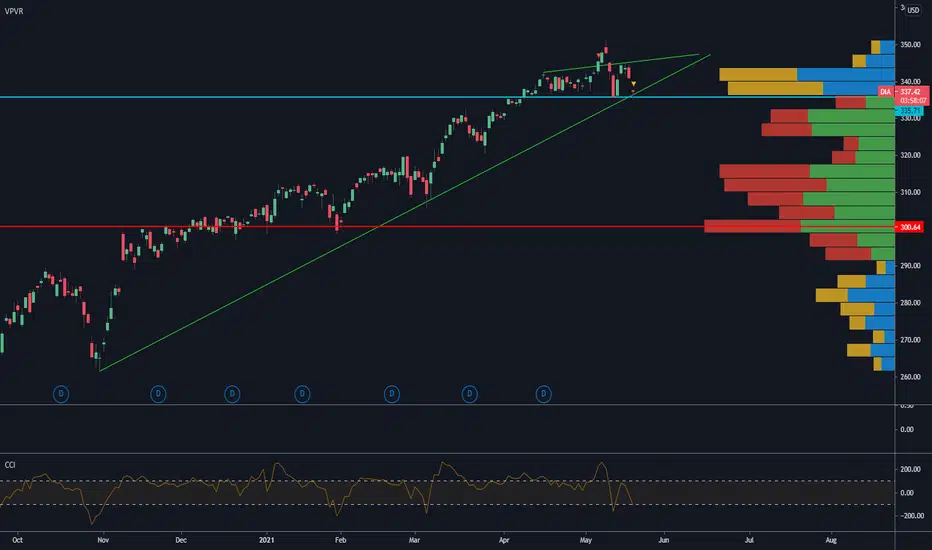
DIA - Tested the 50day - Long above the 50dayMAHowever; it hit the longterm trend support. Showing a nice reversal candle so far today.
If holds the 50day MA stay long.


$DJX Daily TOP #Dow$DJX may be on the verge of a major decline.
Many signals points into that direction:
- S13 exhaustion point recorded today (October 6th)
- Daily Price Flip
- Daily close near Demand Line
- Wave B recently triggered after a recent advance of 5 upwaves
- RSI lagging near neutral zone
From this observation, 3 different scenarios can be drawn:
1. Moderate Bear
Wave C ends near 240/250 before resuming a new uptrend
2. Strong Bear
There is a larger picture where the decline generated by Covid19 could actually be a bearish wave 1.
The top of the bullish wave 5 is also the top of a potential wave 2.
In this case, we can also expect to see the dramatic decline associated with a wave 3 with a main target around 120
3. Continuation of the bullish trend
For this post, the TDX indicator has been configured with a low countdown precision.
With higher accuracy settings, the exhaustion point S13 could be postponed and recorded later (at least above 285)
Best!
MATHR3E


HOW TO USE MACD INDICATOR? [EDUCATION]✅We talked about MACD indicator and 2 ways that we can use it.
I really enjoyed making this video, I hope you as well. 🙏
We will continue our education videos, so, i am looking forward to sharing them.
Take it easy.
~Bo Bugra Sukas
✌️
---------------------
✅We talked about MFI indicator here.
---------------------
✅We talked about RSI indicator here.

SPXU long SPX short I am looking to use this as a way to fade the recent rally. Will update manually when I close trade, I may be in a bit early, we shall see.


look with new lens I think we are at the point where there could be a rapid change in sentiment based on the viruses progress, global tensions, oil price war, etc.
If there is no "event" to push the market down rapidly, I believe the return to "normal" will be slower than anticipated for many people. The virus obviously has had, and continues to have, major effects on every industry/sector.
lines on chart are levels of interest/loose trends based on
blue = 3M
purple = 1M
grey = 1W
I think we may reach 2300-2400 before the end of the month and then head to retest the previous lows.

BITCOIN HALVING INCOMING / MOON OR DOOM ? CORONA, BITCOIN HALVING, TRADITIONAL DOUBLE BOTTOM, RISING CHANNEL, NO TRADE ZONE??, TIME TO BE GREEDY OR FEARFUL?
FIND OUT ON SEASON 69 OF THE UNEXPLAINABLE BITCOIN CHRONICLES !!!


Dow Jones Poised for Major Breakout After 2 Month ConsolidationLooks to me like a >= 2 month consolidation, breakout, back test.
Range suggests a 4.25% move ⬆️
Based on Fri close, that puts $ES_F at 3532. More confluence on possible 3555 target.
