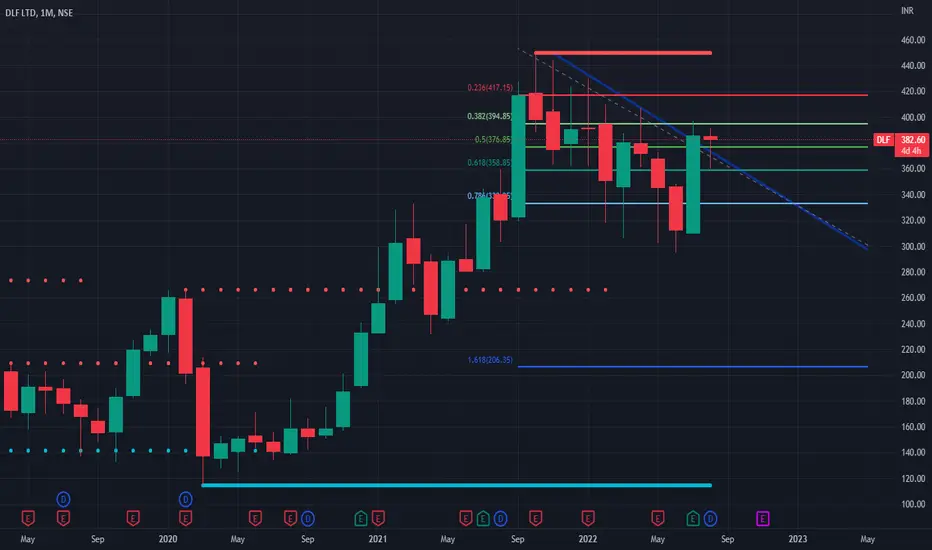
Elliott Wave Analysis of DLF: A Technical PerspectiveHello friends, let's analyze the DLF chart on a daily time frame. Currently, we're observing a corrective phase, where the stock has completed a flat correction pattern (A-B-C) with a 3-3-5 structure. Following this correction, we've seen a significant drop, accompanied by a strong double divergence in the RSI indicator. Where Fibonacci Retracement of last long Rally on Weekly is near 50% - 55% which is less than 61.8% should consider as a Healthy Retracement
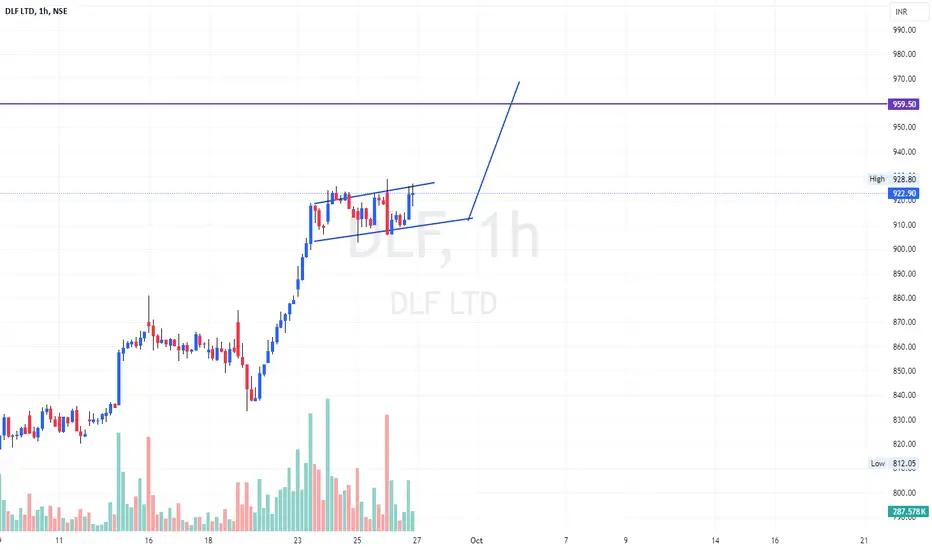
As the price is currently moving upwards, completing wave counts, a breakout above the downward trend line would increase our conviction in the analysis.
This analysis is for educational purposes only and not a tip or advisory. If the price breaks out and stays above the trend line while maintaining the low of 601, we can expect further upside momentum. However, 601 would remain a crucial invalidation level, and a breakdown below it would require us to reassess our wave counts.
Key points:
1. DLF chart analysis on daily time frame
2. Flat correction pattern (A-B-C) with 3-3-5 structure
3. Healthy Retracement
4. Strong double divergence in RSI indicator
5. Breakout above trend line increases conviction (Which is pending yet)
6. 601 as invalidation level
Please note that this is a Educational technical analysis post and not a recommendation to buy or sell.
I am not Sebi registered analyst.
My studies are for educational purpose only.
Please Consult your financial advisor before trading or investing.
I am not responsible for any kinds of your profits and your losses.
Most investors treat trading as a hobby because they have a full-time job doing something else.
However, If you treat trading like a business, it will pay you like a business.
If you treat like a hobby, hobbies don't pay, they cost you...!
Hope this post is helpful to community
Thanks
RK💕
Disclaimer and Risk Warning.
The analysis and discussion provided on in.tradingview.com is intended for educational purposes only and should not be relied upon for trading decisions. RK_Charts is not an investment adviser and the information provided here should not be taken as professional investment advice. Before buying or selling any investments, securities, or precious metals, it is recommended that you conduct your own due diligence. RK_Charts does not share in your profits and will not take responsibility for any losses you may incur. So Please Consult your financial advisor before trading or investing.
Dlfanalysis

Buy DLF around 272-285 TGT 520/740/950 sl below 222The stock is forming a rounding bottom which is widely spread and has given a breakout after a consolidation of almost 8 years. On the retracement up to above mentioned levels can be good for medium term investment.

DLF JackPot 💥🚀🚀🚀💥NSE:DLF shared with potential levels and it jumped almost 6% from new support.
Wish this chart helped in LEarning !!

DLF Broke all resistance levels and ready for BO !!NSE:DLF trading ATH and consolidated seems ready to give one more BO.
Just for referrance marked my entry in this pick, shared with all our friends in the morning too !!
Do the paper trading.

DLF LTDI am DLF LTD stock in 30 min T.F. and I am using trailing Stoploss after achieving 1:1 risk reward

DLF IS READY TO FIRE TREND LINE BREAKOUT ON MONTLY DLF reality sector on breakout on monthly level any time that share run like rocket now price is 382 we can seen the price 450 and 500 and more upper price


DLF : Positional LongDLF took a strong support at 400 and could be a good swing buy with target 450.
400 is also fib support
Weekly RSI closed above 61 today
Good buy volume, highest after 2.11.21
