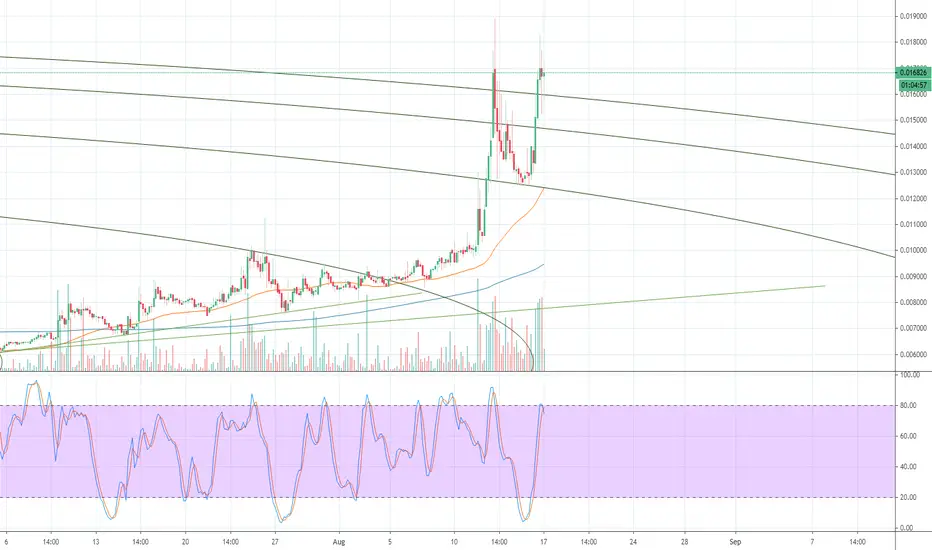
DNT Double Top - Second Stage Run PossibleOkay guys, I got a bag of District0X about 3 weeks ago at 0.0078, and as you can see, I'm sitting on a double that is making it's way to a triple. I had been studying this project since May, and finally decided to jump on board. This is one of the most interesting projects out there, and what I like about it most is the high number of people involved for the use case and not the pump-and-dump. I spent quite a bit of time chatting with some of the admins on the District0X Telegram board today, and let me tell you what... these young people are serious about what they do!
ALL of the different projects in the District Registry are really cool. And if I was into coding, I would be heavily involved right now. You can check out some of what District0X is all about right here ---> registry.district0x.io . I'm gonna tell you what, the majority of this sails right over my head. But I get the overall concept of each project, and it is very intriguing. The "Meme Factory" concept is the favorite. It's a project that merges memes with the blockchain, where competition goes on for the creation of unique digital assets in the form of memes.
Rather than yammering on about crap I really don't understand, I'll focus on the technical aspects and fundamentals of this coin. First of all, there's only 1 billion in the total supply. The amount circulating is about 750 million. When you compare these numbers to coins that have made massive runs of recent, with higher circulation totals, and projects not nearly as interesting as DNT, that's all one needs to know if you're wondering about the potential for the price.
Looking at the chart, we have a massive double top formation printed on the price line. Keep in mind, the second peak is not a lower-high. It matched the closing price on the 4-hour candles. As the stochastic looks peaked out above the 80% boundary, I am looking for a normal correction. I'm tempted to load the wagon as soon as that stochastic makes its way down under the 20% line to "oversold" territory. Then it's time to hold on tight and ride it out.
Will it break to the up-side? If the bull market continues, it probably will. But there's talk of the stock market getting kicked in the teeth on Monday. Depending on how the crypto market reacts, we could see major corrections across the board. I will say that the chart BTC is posting up right now does not give me confidence about the bull market continuing. So don't make any bets based on my uneducated "hopeful" information. I ain't no financial advisor. I'm a number crunchin' calculator-pushing civil engineer... among other things.
Carlton Flowers
The CryptoPro
DNT
DNT / AAVE Gaussian ComparisonDistrict0x can be seen on the. BTC pair to have a tightening gaussian channel
AAVE has already undergone this 'tightening' and look at the results once it turned..
I highly recommend longing DNT.

DNTBTC Continuing UptrendBasically, DNTBTC pumped yesterday hard so correction followed it. Happily price didn't go further down and we have 2 long wick candles on hour chart, which is positive here. I expect continuation towards 150+ satoshis in upcoming 1-2 days. Price has to stay above 110 in order for it work. Keep your SL tight and good luck !

district0x DNT High roller toilet money it was all a dreamdistrict0x DNT High roller toilet money it was all a dream well well well is the big crash coming or we on the way to the other place.


HOWS EVERYONE GOING? District0xOpportunities everywhere, heres DNT for example
Proped up nicely between two MA's
MACD has moved into positive region
Falling wedge / descending scallop, I cant make up my mind.
I highly recommend ERC-20 tokens as a buy.

district0x DNT High roller ,200ma and 100 ma historic made love.200ma and 100 ma historic made love
district0x DNT High roller toilet money come on now first target reached let see what happens now this for all the peps that bought at 0.00357

MACD Comparison DNT and LENDSimilar macd structures
looking for a huge breakout like on lend
yes, that would be good.


Hypothetical wedge symmetry DNTplotting out some potential moves that DNT may make
DNT currently has volume of 140million and counting
jump on the bandwagon while you can
This is my favourite altcoin

District0x Falling Wedge MoonshotA lot of alts are setting up for large moves, district0x is an example
A coin with currently very large volume
Following a breakout of the bullish falling wedge, this coin wants to move up.


district0x [DNT/BTC] on July-06 (#DNT #DNTBTC)DNT has a very nice weekly candlestick and the last Doji will help DNT rise to the zone of 100-110sts and if it breaks this zone, the target of DNT will be 160-170sts
Cancel this idea if DNT closed the daily candlestick under the bottom of the last Doji at 63sts


distric0x Chart Mapped by RequestBy the request of one of our followers, here we have the distric0x (DNTBTC) chart.
There are always multiple scenarios that can play out at any time, it is hard to guess/predict exactly when or where each candle will close.
Instead of trying to predict exactly when or where the price/value of a pair will be, I rather and try and predict the levels where the candles will turn (change of trend) and ride the whole wave.
Here DNTBTC is switching from bearish (dropping) to bullish (rising) which is exactly what we want.
If we can find the next resistance levels and also the support, we can know when the trend will potentially change.
After a support/resistance level is conquered, we can consider the change 'confirmed'.
Here DNTBTC broke below support just to quickly bounce back up.
Above support (blue square) we remain bullish and aiming higher.
If prices break below support, this is a signal that there can be more red.
If by any chance you are trading, it is wise to close the trade and try again on the next wave.
It looks like DNTBTC will need to consolidate longer before printing really strong growth.
If prices remain above MA200, it can continue straight up... I think a retrace is more likely before the next jump.
Thanks a lot for your continued support.
Namaste.

district0x DNT High rollerdistrict0x DNT High roller WELL WELL A CROSS HAS HAPPENED AND A BREACH OF A 870 DAYS DOWN TREND CAN WE BLOW OUR TRUMPET YET OR it's ALL GOING IN THE TOILET, ALWAYS ROLL DiCE WITH TOILET MONEY.
