Dockbitcoin


DOCKBTC Falling WedgeDOCKBTC has formed a falling wedge will multiple touches on the downtrend line. Grey Fibonacci line possible reversal point.


DOCK LONG SCALP$DOCK Long Scalp:
Hoping for one more pullback into trendline support, then a move up into the POC. Let's see what we get.

DOCKBTC 4HDock; bullish bat pattern. Possibility of the horizontal movement's end and new bullish trend, break a leg!

DOCK - Nice consolidation before breakoutDOCK is consolidating nicely.
Bullish divergence on RSI on 4HTF, market is gaining strength
There is huge cloud resistance on 4HTF, big volume can do the trick.
Lets see if it break out.

DOCKBTC last couple of days for exact wayDOCKBTC flat trade continue during last 20 days. After binance events DOCK lost volume and started to sleep mode. We are coming to the edge of triangle and have to decide which direction we will go. Till 105 support holding we can target over 150 sat. if it brokes below 105 need to stop it.

Dock is looking ready for another Push Upwards. Strong MomentumBINANCE:DOCKBTC Looking Ready for a Heavy Push.
RSI is Still Bearish (oversold ) A lot of increase in Volume has been noticed.
Watch out the arrow in the chart (Pull back ).
Buy Between 104-111
Target 142, 165 and 180.
Accumulate in the Pullback (129-142)

DOCKBTC Breakout Buy : 117 - 120 (buy till 122 it's good small position)
stop : 110
target : 5 to 50%

DOCKBTC formed bullish gartley | Upto 51% potential ideaPriceline of Dock / Bitcoin cryptocurrency formed a bullish Gartley pattern and entered in potential reversal zone to hit the sell targets soon insha Allah.
This PRZ area should be used as stop loss in case of complete candle stick closes below this zone.
Stochastic is oversold and has given bull cross.
Volume profile is showing less interest of traders at PRZ level but MACD is strong bearish so for secure trade we can wait for MACD to turn weak bearish.
I have used Fibonacci sequence to set the targets:
Buy between: 0.00000124 to 0.00000109
Sell between: 0.00000136 to 0.00000165
Regards,
Atif Akbar (moon333)

DOCKBTC forming a bullish BAT | A buying opportunity aheadPriceline of Dock / Bictoin is forming a bullish BAT pattern and soon it will be entered in potential reversal zone.
This PRZ area should be used as stop loss.
I have used Fibonacci sequence to set the targets:
Buy between: 0.00000115 to 0.00000111
Sell between: 0.00000117 to 0.00000123
Regards,
Atif Akbar (moon333)

DOCKBTC price taking support on trend linenot a buying signal at all
this is only for risk taker like mee
just see how this react it can touch 125 though not at 121 let's see

DOCKBTC formed a bullish BAT | A buying opportunityPriceaction of Dock / Bitcoin cryptocurrency has formed bullish BAT pattern and entered in potential reversal zone.
This PRZ area should be used as stop loss point in case of complete candle stick closes below this zone.
But we have a very strong bearish Marubozu candle stick hitting PRZ support moreover Stochastic did not give bull cross and MACD is strong bearish so for secure trade we should wait for MACD to turn weak bearish or for stochastic to give bull cross then buy otherwise the price action can move more down to form a bullish Crab.
I have used Fibonacci sequence to set the targets:
Buy between: 0.00000139 to 0.00000137
sell between: 0.00000144 to 0.00000152

DOCKBTC has formed bullish butterfly | Upto 44% expectedPriceline of Dock / Bitcoin cryptocurrency has formed a bullish butterfly and entered in potential reversal zone.
I have used Fibonacci sequence to set the targets as below:
Buy between: 0.00000089 to 0.00000079
Sell between: 0.00000096 to 0.00000114
Regards,
Atif Akbar (moon333)

DOCK/Bitcoin (28 May) #DOCK $DOCK #BTC $BTC#BUY #WAIT
Current price : 170
Buyzone : Buy close to 162 as possible
Sellzone : 195-240
Stoploss if price is lower than 155

DOCK/Bitcoin (20 May) #DOCK $DOCK #BTC $BTC#BUY
DOCK is ready to increase strongly
Buyzone : Buy as close to 150 as possible
Sellzone : 170-180-200-240
Stoploss if price is lower than 145 and consider buying back around 135-140

Daily Bullish Signal $DOCK #DOCK #DOCKBTC #BTC $BTC (11 April)RED ARROW indicates the EXPECTED Time and Targets
Level Stoploss point up to maximize profit and reduce risk
I'm working all the time, even in Bearish Market
======================
My path doesn't seem like anyone. I'm like a MONK, always studying to find the direction that prices will follow. I will feel very comfortable if the price goes exactly in the direction I drew. I will always try and practice until PERFECTION is MY OWN


Daily Bullish Signal $DOCK #DOCK #DOCKBTC (21 March 2019)RED ARROW indicates the EXPECTED Time and Targets
Level Stoploss point up to maximize profit and reduce risk
I'm working all the time, even in Bearish Market

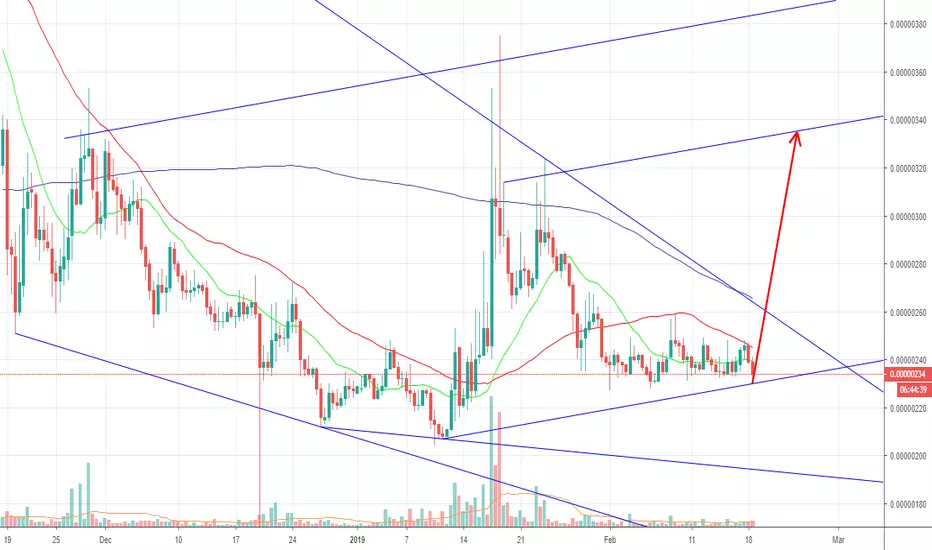
Daily Bullish Signal $DOCK #DOCK (19 Feb 2019)RED ARROW indicates the EXPECTED Time and Targets
Level Stoploss point up to maximize profit and reduce risk
I'm working all the time, even in Bearish Market
Daily Bullish Signal $DOCK #DOCK DOCK/BTC (10 Jan)BLUE ARROW indicates the EXPECTED Time and Targets
Level Stoploss point up to maximize profit and reduce risk
I'm working all the time, even in Bearish Market

Curriculum vitae of the digital age. Analytics DOCK / BTCBUY: 0,00000252 - 0,00000262
SELL: 0,00000388, 0,00000520
STOP-LOSS: 0,00000249
Support: 0,00000256
Resistance: 0,00000388
The dock.io team has created a decentralized data exchange protocol for the distribution and management of personal data in the professional industry. It aims to streamline the collection of data from existing networks that have no incentive or can not share information with competitors.
The dock.io goals are to create a workspace in which:
- a user profile will be integrated with it (work experience, education, location, contacts, qualifications, etc.) and filled with information from different platforms and
- stimulate transactions and information sharing, giving the user full control over their data.
Binance listing of the token took place at the end of July. From its moment until August 14, the price fell along with the market. Minimum was formed at the level of 0.00000190. After reaching this point, the asset price rose by 80% within 5 days, and by October 28 it showed a gain of 250% from the minimum price.
The chart shows a slow but steady upward trend. Analysis of trading volume suggests that the asset is supported by big investors.
The entry price into the asset is not higher than 0.00000252 - 0.00000262. Additional risks are given by an uncertain situation with Bitcoin and the markets in general. Therefore, be sure to put a stop-loss on the level of 0.00000249, slightly below the level of support. The first zone of closing long positions is within 0.00000388, the next is 0.00000520.
Intra-day volatility is 7-15%, which allows you to comfortably trade an asset within the day.
The token is suitable for both short-term trading and long-term investments.line. If the price breaks through it - will possible updating the minimum.
In our opinion, the current fall is an artificially provoked case, the assets behavior was deliberately led to last year’s model. It seems that the manipulators have left the market today and the price is formed solely on the basis of market expectations.
