BTCUSDT | Fed data will bring volatility to the market!Hello trader Today I have prepared a new idea for you. Like and subscribe to the channel there is a lot of useful information✅
Important macroeconomic data is coming out today, there will be increased volatility!
Let's analyze the graph from the technical side:
At the moment, it can be observed that the true breakdown of the $18,000 level, I think this is temporary and the denouement is close.
The chart has not completely moved away from yesterday's CPI data, and we still have some volatility.
So far everything is going to the fact that most likely we will see a true breakdown of $ 18,000 the approximate plan showed on the chart, and most likely this can happen from today's FOMC indicators.
From the fundamental side:
In the evening we are waiting for a number of important events:
▫️22:00 FOMC economic forecasts.
▫️22:00 FOMC Statement.
▫️22:00 Fed rate decision.
▫️22:30 FOMC press conference.
Of the most important, I would like to highlight the decision on the interest rate and the FOMC press conference, where the head of the FOMC will speak and share his future plans for raising or easing the key rate, from which, in fact, we can also see increased volatility.
Dodo

DOGEUSD | Fixed a profit, you can re-enter.Hello trader Today I have prepared a new idea for you. Like and subscribe to the channel there is a lot of useful information✅
DOGE recorded a 10% profit, I expect another trip to the area of interest $ 0.083-0.085
On yesterday's volatility, the asset almost reached a take profit of $ 0.1, I decided to fix at $ 0.09458 10% I managed to take 10% without leverage
At the moment, I expect a trip to the $0.083-0.085 zone again
Placed limit orders in a grid
0.08741$
0.08474$
0.08316$
Take proft remains unchanged
I also remind you that important data from the Fed is coming out today, increased volatility is expected!

BINANCE is also going to crash like FTX?!Hello trader Today I have prepared a new idea for you. Like and subscribe to the channel there is a lot of useful information✅
U.S. Attorney's Office accuses Binance and executives of money laundering and sanctions violations.
The US Attorney's Office may accuse the Binance exchange and its management of money laundering and violating sanctions. The investigation has been ongoing over the past few years.
If charges are brought against the exchange and against Zhao himself, this could lead to even more damage to the entire cryptocurrency industry.
Of course, first of all, this concerns the BNB token that belongs to Binance, people have already begun to panic and literally in a matter of hours the token has lost 3-4% in value, maybe this is the first call for a big short, like with FTT?
While nothing is clear, binance lawyers are actively holding meetings with representatives of the Ministry of Justice and mastering their rights, let's hope that everything goes smoothly and we do not see another dump this year.

APTUSDT | Bounce off the trend line.Hello trader Today I have prepared a new idea for you. Like and subscribe to the channel there is a lot of useful information✅
At the moment, the asset is in a local uptrend, this can be seen from the trend line.
As for me, here we have 2 scenarios of events in the short term:
Or the asset will be able to bounce off the trend line and return to its previous HAW $5.4
Or we will see a FAKE puncture in the $4.2 zone and from there there will already be a buyer's reaction.
I allocate 0.5-1% of the main deposit for this deal.

DOGE - Scalp deal, the asset has reached the zone of interest!Hello trader Today I have prepared a new idea for you. Like and subscribe to the channel there is a lot of useful information✅
SCALPLONG
Deal with tradingview, the asset has reached my zone of interest.
The guys from altcoins on speculative transactions are only considering #DOGE and #ETH so far.
Earlier I shared the chart and singled out for myself an area of interest of $0.08594, the target was reached with a small puncture.
There is a slight rebound from the zone, I decided to open a SCALP deal in the direction of $0.1 from the deposit no more than 1-2%

DOGE | Local parsing of the coinHello trader Today I have prepared a new idea for you. Like and subscribe to the channel there is a lot of useful information✅
I want to update the schedule for #DOGE to make small changes, so to speak :)
Now as local as possible.
At the moment, the asset is near a strong local support, there is a possibility that we can see a small rebound from the current values of $0.9645 to $0.10363 to the previous resistance of 0.5 Fibonacci.
But you can also try placing limit orders below the support of 0.618
0.0957$
0.0900$
0.08594$
Approximately this range the asset can test in case of loss of local support, allocated 0.5-1% of the main deposit for the deal, while the alts do not inspire confidence :(

Bitcoin! Market volatility is expected.Hello trader Today I have prepared a new idea for you. Like and subscribe to the channel there is a lot of useful information✅
Volatility is expected in the markets today, be careful!
Guys, I want to sum up the past TA and share news from the Fed.
So, let's begin:
The previous plan worked very well, we were able to see a bounce from the $16,685 zone and break above $17,000 and so far the buyer is holding this range well.
At 16:30 Moscow time, the US PPI data will be released and most likely the data will be positive, which could provoke bitcoin to go to $18,000.
At the moment, while I am without a position, I just want to observe from the sidelines.


DODONice entry on this asset.
DODO in the accumulation area.
Bollinger Bands are approaching.
Expect a big move up soon.
x2 - x10
Many hedge funds are behind this project including :
- Alameda research
- Coinbase
- Binance
- Framework Ventures
- Pantera Capital
DYOR

Tips for beginners on how not to make mistakes when trading Hello trader Today I have prepared a new idea for you. Like and subscribe to the channel there is a lot of useful information✅
Guys, today I want to share with you information from one interesting blog, for the last 3 weeks the market has not shown us strong volatility and we have to watch almost the same price range, I'm talking about the main cryptocurrency, Bitcoin.
So I decided to share this information for beginners in order not to make mistakes that can be so easily avoided in the future.
Let's start with you in order:
What is Consolidation or Flat?
Consolidation is the state of the market when it is sandwiched between support and resistance. This state means that a certain state of balance has arisen in the market between sellers or buyers, that is, demand has balanced supply. In other words, the market is in a state of accumulation or distribution. According to statistics, about 80% of the time the markets are in a flat state, so trading in a sideways range will always be profitable for traders.
For consolidation to become apparent, the price must touch the support and resistance levels at least twice. I think that it is clear here, this is a classic of technical analysis, trading from levels in FLAT.
Example below:
And so let's continue:
Consolidations can expand and contract.
An expanding consolidation occurs when the price makes a false break and moves back into a range, thereby expanding the space between support and resistance. Selling at resistance will force you to hit a stop as price breaks the current resistance level to then move back into the range.
Example below:
A shrinking consolidation occurs when the market enters a period of low volatility, for example due to an impending news release.
During periods of narrow consolidation, it is better to refrain from entering the market and making deals. But during periods of broad consolidation, you can trade from its borders. This will give us a good risk to reward potential. However, you should always remember that sooner or later the price will go beyond the range, a true breakdown of the level will occur, and the market will move into a trend phase.
The longer the market is in a flat, the more force the trend will follow after the price breaks out of the range. Any calm in the cryptocurrency market is replaced by explosive, and vice versa.
We got acquainted with the theory and I think there is nothing complicated, you can see all the examples on the graphs above.
Let's move on to the most important thing now:
Flat is a killer of deposits, why?
We have all heard or read on various forums that flat is the killer of deposits of trend traders. Actually, it is. If your trading system is showing outstanding results in a trending market, then as soon as the sideways movement begins, you can say goodbye to all the profits.
Let's take a look at the place.
The thing is that trend methods will give you signals to enter the market near support and resistance levels, and as soon as you open a buy deal, the price crashes into the level in just a couple of points, and after that a reversal begins. On average, the trading system will give 4 false signals, which will completely block the profits received when trading with the trend. Therefore, if you learn to identify a flat in the early stages of its formation, then the damage caused by it will be minimized, or even better, you will be able to use this state of the market to your advantage.
How to define a flat?
In order to correctly learn how to determine a flat, we must remember what it looks like. A sideways movement is a movement between two highs and lows, perhaps this will be enough. Let's look at the chart, try to identify any price fluctuation between the latest highs and lows.
Shown below is an example:
Red circles mark the first minimum and maximum. As we can see, the subsequent price movement is within the range of boundaries we have drawn. Next, we can see how the price breaks the lower level and a strong downward movement begins, but it is worth noting that the price made about 7 bounces from the levels before that, which we could use for profit.
How to trade in the side market?
The best strategy for trading sideways markets is the false breakout. It usually gives a powerful impetus for the price to move in the opposite direction. Market makers always collect stop losses of traders at levels to gain liquidity and then move in the opposite direction. This should always be taken into account when trading false breakouts. You can set take profit and exit the trade on the other side of the trading range. I often mention this in my signals that MM collects stops and turns the asset in the other direction, this happens most often on strong

ADA USD | Exit from the ascending channel!Hello trader Today I have prepared a new idea for you. Like and subscribe to the channel there is a lot of useful information✅
On the chart, the formation of an ascending channel, its development is right in front of you, according to the classics down.
On the technical side: the nearest support is in the $0.3-0.35 zone, there is a small traded zone there, well, it’s not a fact that the asset will be able to cling to it and not fall lower. So far, guys, just thoughts, there is also a possibility that bitcoin will show a rebound again from the 16,800 zone and the whole viola will follow them, so I write the shortest stop orders for transactions, be sure to take this into account !!! Approximate take profit shown on the chart.
While I don’t want to consider altcoins for any positions, I’m just sharing my thoughts here, maybe they coincide with yours and this is as an addition.

ETHUSDT | I continue to standHello trader Today I have prepared a new idea for you. Like and subscribe to the channel there is a lot of useful information✅
Guys, I want to update the EHT idea a bit
Here, in general, everything goes according to plan, the entry point $ 1300-1310 is a good entry point into the short
The main breakout zone is the range of $1250-1220 if we see a true breakdown of this range, then most likely there will be a hike below $1200 as indicated by the take profit.
There is nothing special to add, soon I am waiting for ethreum below $1000, while I think we will still be driven in the range of $1150-1350 approximately.

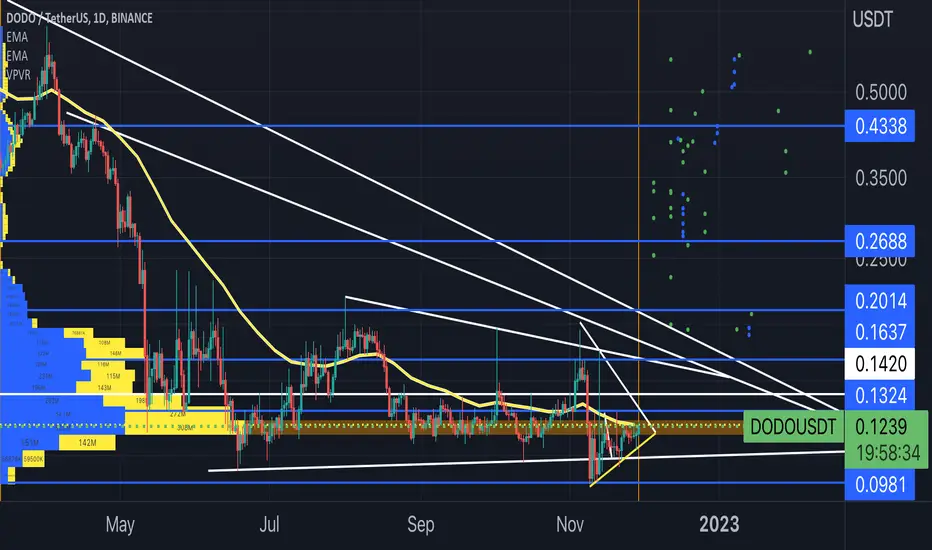
DODOUSDTTop 10 of decentralized exchanges. Dodo about to explode, year-end rally. Great odds on targets above $0.3

DODO/USDT explosion on the wayDODO forming an ascending bullish triangle. In the coming days we can see a dodo above $0.42 if the previous support levels return

BNBUSDT|Coin OverviewHello trader Today I have prepared a new idea for you. Like and subscribe to the channel there is a lot of useful information✅
After a strong takeaway, a small correction can now be observed on the chart, I think that the asset will be able to test the local support of $276 where I will consider a small LONG 1-3% of the deposit.
While everyone is waiting for bitcoin to move towards $16,500 and the alts will follow it, an approximate stop order was shown on the chart. Be sure to follow the risk management!!!

DOGE again against the market, another takeaway!Hello trader Today I have prepared a new idea for you. Like and subscribe to the channel there is a lot of useful information✅
The asset showed good growth this week and again came to $0.1 resistance
Since the last TA, all the goals that I singled out as a percentage have reached the mark, who gained in the $0.07-0.072 zone, I think you can already start destroying the position and move the stop into a fat plus.
Speaking from the technical side, the $0.1 level is not a strong resistance level, and if PUMP continues, the asset will most likely reach $0.12-0.15
Also, the chart showed a possible correction towards $0.075-0.08 if the asset corrects in this range, I will consider LONG at 1-2% of the deposit.

DODOUSDT Breaking out the massive falling wedge.It will try to break it any moment. 2x looks easy.
Holders will try for 5x or more.

DODOUSDTsome people are asking, I still have analyzed DODO/USDT. Graphically it is following the pattern, it was above the 8-week EMA, good journey to higher levels, perhaps above $0.26 by the end of the month. December and the next few months explode into rally.
DODOUSDTDODO/USDT continues to maintain the ratio respecting every touch of its support and resistance. It's going to explode any moment and it's going full throttle.

BTCUSDT | Bounce again, when will it end?Hello trader Today I have prepared a new idea for you. Like and subscribe to the channel there is a lot of useful information✅
Bitcoin again got a rebound from the $16,750-16,500 resistance zone, I want to believe that this was the last rebound and there will be a breakdown of the $17,000 level soon
In his past, TA spoke about the downward movement at the beginning of the new week to the $16,200 zone
It is also worth paying attention to $16,130 marked with a gray line, a local support level is being formed, there is a buyer’s reaction from there, which is a good sign that we may not see below LOW $15,450 in the near future (well, this is not accurate).
By the way, I fixed my position and re-entered again, in case of leaving below $16,000 I will gain a position.

AAVEUSDT | I am considering a deal in LONG. Hello trader Today I have prepared a new idea for you. Like and subscribe to the channel there is a lot of useful information✅
Guys, earlier I watched the asset for a long time and waited for the structure to form, so I think the time has come to pick up a local deal in LONG.
I made markings on the chart and highlighted some areas, support levels and areas of interest where it is best to buy.
I highlighted the $56 zone with a gray line, so far you can place an order there to add a position, the $58 zone is currently a strong local support and I think it is from there that you can open a 5% deal in LONG.
Well, it is also worth considering that the price may not come there, I just showed a safer entrance!

SUSHI Violas still draw triangles.Hello trader Today I have prepared a new idea for you. Like and subscribe to the channel there is a lot of useful information✅
The guys here are a familiar triangle, after the breakdown of the local resistance of $1.180, we see how the asset showed a good impulse to the $1.295 zone, net 10%
I expect to see a small correction with continued growth, I showed it approximately on the chart and identified an area of interest for buying in LONG $ 1,185-1,215
Also, if you pay attention to the RSI indicator, you will notice that the asset is in the overbought zone and a slight correction has already begun.
I do not rule out that we can see a false extension of the triangle up and then go lower, so be careful, I just put my orders and I will wait for my entry point.

UNIUSDT | Scalp deal, channel exit!Hello trader Today I have prepared a new idea for you. Like and subscribe to the channel there is a lot of useful information✅
The chart showed an ascending channel with clear boundaries.
If you pay attention to the lower zone of the channel, then we will see a strong compression of the local support, which means that soon we will see a breakout of the lower border approximately to the $5.30-5.15 zone
Usually, this pattern works out through downward movements in most cases, but I would recommend taking no more than 2-3% of the deposit for a deal, as it looks very risky and therefore it is better to work with a short stop order.
