DODOUSDT | Massive Volume Spike – This Could Be HUGE!🔥 Massive Volume Spike – This Could Be HUGE! 🔥
“We’re talking about a massive 1265% daily volume increase – something big is brewing! The market is waking up, and let me tell you, the setup is looking beautiful.”
Key Levels to Watch:
Blue Box = Strong Demand Zone – This is where smart money steps in. If price holds, we could see a big reaction.
Confirmation is Key – I’m watching for CDV strength, lower time frame breakouts, and volume profile support before making a move.
Momentum Could Explode – If buyers step in, this could turn into a monster rally.
Final Thoughts:
“I’m watching this closely. Volume is through the roof, the demand zone is clear, and the market is setting up for something massive. If confirmation comes in – we ride the wave!”
🚀 Get ready, this could be one for the books! 🔥
Let me tell you, this is something special. These insights, these setups—they’re not just good; they’re game-changers. I've spent years refining my approach, and the results speak for themselves. People are always asking, "How do you spot these opportunities?" It’s simple: experience, clarity, and a focus on high-probability moves.
Want to know how I use heatmaps, cumulative volume delta, and volume footprint techniques to find demand zones with precision? I’m happy to share—just send me a message. No cost, no catch. I believe in helping people make smarter decisions.
Here are some of my recent analyses. Each one highlights key opportunities:
🚀 RENDERUSDT: Strategic Support Zones at the Blue Boxes +%45 Reaction
🎯 PUNDIXUSDT: Huge Opportunity | 250% Volume Spike - %60 Reaction Sniper Entry
🌐 CryptoMarkets TOTAL2: Support Zone
🚀 GMTUSDT: %35 FAST REJECTION FROM THE RED BOX
🎯 ZENUSDT.P: Patience & Profitability | %230 Reaction from the Sniper Entry
🎯 DEXEUSDT %180 Reaction with %9 Stop
🐶 DOGEUSDT.P: Next Move
🎨 RENDERUSDT.P: Opportunity of the Month
💎 ETHUSDT.P: Where to Retrace
🟢 BNBUSDT.P: Potential Surge
📊 BTC Dominance: Reaction Zone
🌊 WAVESUSDT.P: Demand Zone Potential
🟣 UNIUSDT.P: Long-Term Trade
🔵 XRPUSDT.P: Entry Zones
🔗 LINKUSDT.P: Follow The River
📈 BTCUSDT.P: Two Key Demand Zones
🟩 POLUSDT: Bullish Momentum
🌟 PENDLEUSDT.P: Where Opportunity Meets Precision
🔥 BTCUSDT.P: Liquidation of Highly Leveraged Longs
🌊 SOLUSDT.P: SOL's Dip - Your Opportunity
🐸 1000PEPEUSDT.P: Prime Bounce Zone Unlocked
🚀 ETHUSDT.P: Set to Explode - Don't Miss This Game Changer
🤖 IQUSDT: Smart Plan
⚡️ PONDUSDT: A Trade Not Taken Is Better Than a Losing One
💼 STMXUSDT: 2 Buying Areas
🐢 TURBOUSDT: Buy Zones and Buyer Presence
🌍 ICPUSDT.P: Massive Upside Potential | Check the Trade Update For Seeing Results
🟠 IDEXUSDT: Spot Buy Area | %26 Profit if You Trade with MSB
📌 USUALUSDT: Buyers Are Active + %70 Profit in Total
🌟 FORTHUSDT: Sniper Entry +%26 Reaction
🐳 QKCUSDT: Sniper Entry +%57 Reaction
📊 BTC.D: Retest of Key Area Highly Likely
This list? It’s just a small piece of what I’ve been working on. There’s so much more. Go check my profile, see the results for yourself. My goal is simple: provide value and help you win. If you’ve got questions, I’ve got answers. Let’s get to work!
Dodobtc

DODO buy/long setup (1D)A bearish tigger line has been broken and we have a bullish CH and BOS on the chart.
We have a support swap zone on the chart which is our buy/long position.
Closing a daily candle below the invalidation level will violate this analysis
For risk management, please don't forget stop loss and capital management
When we reach the first target, save some profit and then change the stop to entry
Comment if you have any questions
Thank You

DODO cup and handle break outIt should go well, cup and handle is bullish pattern. GL
NOT A FINANCIAL ADVICE
ALWAYS MANAGE YOUR RISK AND USE STOPLOSS

Dont sleep on DODOVery bulish pattern, red MA cam act like a magnet for price now which can be 40% profit at least.
PA and TA is bullish to me.
NOT A FINANCIAL ADIVCE
ALWAYS USE STOPLOSS AND MANAGE YOUR RISK

DODOUSDT Triple Bottom BreakoutDODOUSDT Technical analysis update
The DODO price has broken the triple bottom neckline resistance line with high volume and is trading above the 100 and 200 EMA on the daily chart. We can expect a strong bullish move.
Resistance 1: $0.225
Resistance 2: $0.325
Regards
Hexa

DODOUSDT Rectangle PatternDODOUSDT Technical analysis update
DODO's price has been trading within a rectangle pattern for the last 840 days and price has now dropped again to the box's support level. we can expect a bullish move from the current rectangle support level.
Next Target is $0.35
Stop Loss: $0.078
Regards
Hexa

DODOUSDT 1W-TIMEFRAME ANALYSIS💥DODOUSDT 1W-TIMEFRAME ANALYSIS
💗Hello ladies and gentlemen
This is my new idea for 💥DODO
I hope my idea is clear
Support me by like and share thank you
Stay Safe💯💲💲💲
Good luck💰😍

DODO analysisDODO has formed a liquidity pool after the bearish CH at the bottom of the chart.
It is also placed below a resistance swap range.
We expect deeper drops from DODO.
If POI is reached, we can look for buy/long
Closing a daily candle below the invalidation level will violate the analysis
Note that the financial market is risky, so:
Do not enter any position without confirmation and trigger.
Do not enter a position without setting a stop.
Do not enter a position without capital management.
When we reach the first TP, save some profit and try to move the stop continuously in the direction of your profit.
If you have any comments please post them, comments will help us improve our performance
Thanks

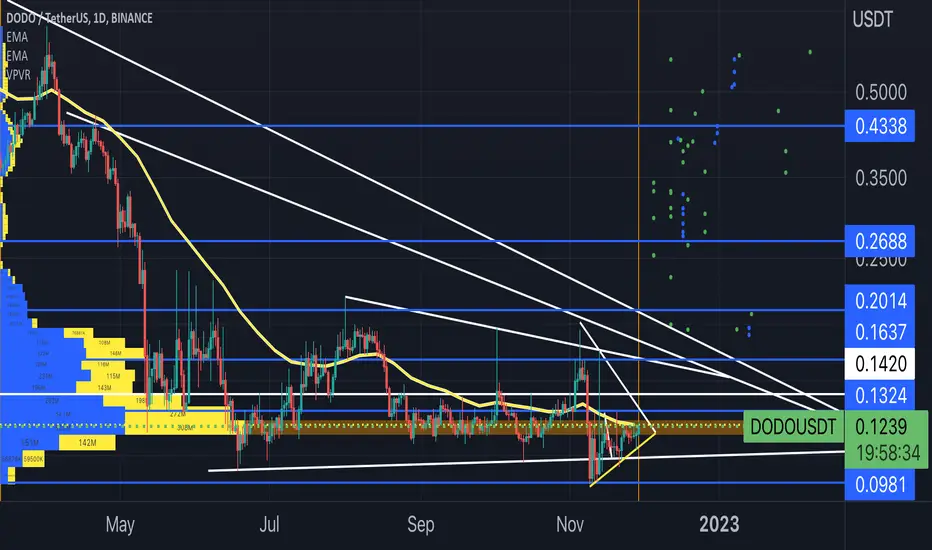
DODOUSDT 1D LONG📈Hi all. DODOUSDT has formed a triangle and has been in the accumulation channel for 1.5 years. Increased buyer volumes. The output can be powerful. I am considering entering spot now and/or going long during a breakout/retest. Marked goals and levels on the chart.

DODO token formed bullish Gartley for upto 82% pumpHey dear friends, hope you are well, and welcome to the new update on DODO token with US Dollar pair.
Previously we caught 70% pump of DODO as below:
Now on a 4-hr time frame, DODO has formed a bullish Gartley move for the next price reversal.
Note: Above idea is for educational purpose only. It is advised to diversify and strictly follow the stop loss, and don't get stuck with trade.

DODO ANALYSIS (3D)Hi, dear traders. how are you ? Today we have a viewpoint to BUY/SELL the DODO symbol.
We are in the E branch of the large diametric drop.
The time frame is big and time consuming.
Symbols that have such a situation are clearly not well founded
For risk management, please don't forget stop loss and capital management
When we reach the first target, save some profit and then change the stop to entry
Comment if you have any questions
Thank You

$DODO/#BTC [#DODO]: Resistance_BreakoutHey traders, we've identified a Resistance Breakout on the $DODO / $BTC chart. The price has broken above a key resistance level, which can indicate a potential bullish trend. Taking in consideration the next resistance key levels are at 0.00000787 | 0.00000865 | 0.00001063 and the major support zones are respectively at 0.00000589 | 0.00000469 | 0.00000271. It is a bullish indication and we may consider entering at the current price zone at 0.00000641 and targetting higher levels.
Technical Metrics :
Current price: 0.00000641
24H Volume: 5.0894 Ƀ
24H Price change: 5.255%
- Pivot Points - Levels :
Resistance: 0.00000787 | 0.00000865 | 0.00001063
Support: 0.00000589 | 0.00000469 | 0.00000271
Indicators recommandation :
Oscillators: NEUTRAL
Moving Averages: BUY
Technical Indicators Summary : BUY
- In-depth DODOBTC technical analysis on > Tradingview TA page
What do you think of this analysis? Share your insights and let's discuss in the comments below. Your like, follow and support would be greatly appreciated!
Welcome to the home of charting big: TradingView
Benefit from a ton of financial analysis features, instruments and data. Have a look around, and if you do choose to go with an upgraded plan, you'll get up to $30.
Discover it here

DODOUSDT Bullish Channel!DODUSDT Technical analysis update
Buy zone: Below $0.162
Stop loss : $0.145
Take Profit 1 : $0.177
Take Profit 2 : $0.200
Take Profit 3 : $0.230
Take Profit 4 : $0.300
Spot trade
Always keep stop loss
Thanks
Hexa

DODO USDT TODAYApply your own risk management.
Daily and Weekly Targets
hunt the profits at any level you see convenient for you.
Green Zone for entry,
Red Level Exit,
Yellow levels are targets.
have a good day guys.

DODOUSDT Emerging From Bloodbath!DODOUSDT Technical analysis update
Currently trading at $1.55
Buy zone: Below $0.157
Stop loss : $0.125
Take Profit 1 : $0.190
Take Profit 2 : $0.235
Take Profit 3 : $0.280
Take Profit 4 : $0.350
Spot trade
Always keep stop loss
Thanks
Hexa

DODO looks like it is ready for some jump upDODO has quite nice pattern on 4h and lower timeframes, i am expecting spike up around 30-60% before pice takes lows again (it should) but it is not a condition. We need to watch it closely with tight stoploss.
MANAGE YOUR RISK, NOT A FINANCIAL ADVICE

DODOUSDTsome people are asking, I still have analyzed DODO/USDT. Graphically it is following the pattern, it was above the 8-week EMA, good journey to higher levels, perhaps above $0.26 by the end of the month. December and the next few months explode into rally.
DODOUSDTDODO/USDT continues to maintain the ratio respecting every touch of its support and resistance. It's going to explode any moment and it's going full throttle.

DODO SHORT SETUPHello, dear traders. how are you ? Today we have a setup to SELL/SHORT the DODO symbol.
For risk management, please don't forget stop loss and capital management
When we reach the first target, save some profit and then change the stop to entry
Comment if you have any questions
Thank You

DODO token formed bullish Cypher for upto 29% pumpHey dear friends, hope you are well, and welcome to the new update on DODO token with US Dollar pair.
Previously I shared a long-term trade plan for DODO, which is still in play.
Now on a 4-hr time frame, DODO has formed a bullish Cypher pattern.
Note: Above idea is for educational purpose only. It is advised to diversify and strictly follow the stop loss, and don't get stuck with trade

DODO SWING TRADE (SPOT)Buying DODO as soon as it pulls back to the support/demand area.
This coin is also bound for a good pump.

DODO scalp DODO Looks quite good - sellers are a bit exhausted after few weeks of selling in a row... volume is decreasing...there should be some green candle next week... lets see
MANAGE YOUR RISK, NOT FINANCIAL ADVICE

