DOGE 1D: Missed PEPE? Don’t Miss DOGE 06/12/25BINANCE:DOGEUSDT
I’m expecting a continuation of the upward movement and a possible trend reversal.
There’s a chance we’ll revisit the 0.618 Fib level to shake out weak hands — a classic move before liftoff.
Looking at the chart, it really feels like altseason is closer than anyone expects. DOGE may lead the charge.
Entry Points (EP):
• Market
• $0.19357
• $0.18009
Take Profit (TP):
• $0.22787
• $0.25439
⚠️ My personal opinion only — not financial advice.
Do your own research and remember: all actions you take are your own responsibility. Practice solid risk management and avoid investing more than 2% of your total capital per trade.
DYOR.
DOGE-1

doge buy long term "🌟 Welcome to Golden Candle! 🌟
We're a team of 📈 passionate traders 📉 who love sharing our 🔍 technical analysis insights 🔎 with the TradingView community. 🌎
Our goal is to provide 💡 valuable perspectives 💡 on market trends and patterns, but 🚫 please note that our analyses are not intended as buy or sell recommendations. 🚫
Instead, they reflect our own 💭 personal attitudes and thoughts. 💭
Follow along and 📚 learn 📚 from our analyses! 📊💡"

Dogecoin Bearish But...Yes, Dogecoin is bearish now but this is only a short-term situation, it is the end of a long-term correction. Notice the chart, Dogecoin has been producing lower highs long-term, since December 2024.
Recently, there was a major low in April and then a recovery and after this recovery we have local lower highs. The current drop is the continuation of the retrace that started 11-May. This retrace should end soon, within weeks or just a few days.
As soon as the low settles, we can enter the market bullish again. If you trade spot, simply wait. Day traders can easily SHORT but the range is short, after a small drop cover and switch back to LONG. Experts only.
That's the scenario. We are very likely to get a higher low compared to 7-April. If too many leveraged positions are open though and the market wants to remove those, there can be a long wick that pierces support for the action to recover the next day.
So, the drop can be fast, can be small, can be hard, can be easy or it can be short, it doesn't matter, once it is over, Dogecoin will continue to grow.
Patience is key.
Thanks a lot for your continued support.
Namaste.

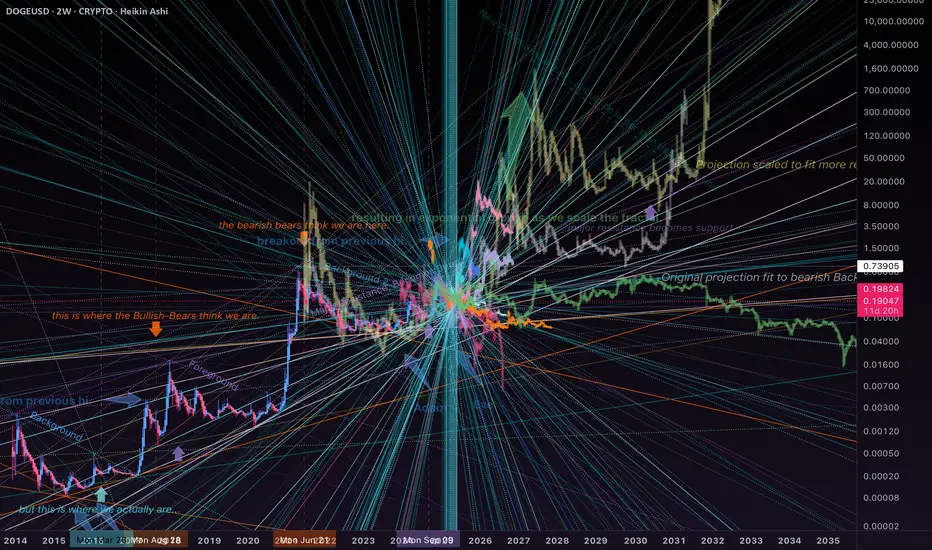
DOGE - 2WHello,
In this update, we look at DOGE on the long range… the 2 Week candle.
I have applied a variety of theories to this projection map… each trace is a pretty relevant force at any given fractal time frame. There are 4 main influences at each fractal time frame. Signature 3D flying monsters are easiest to spot… and they sort of project through space…
The laser beams are the floors (solid) and ceiling (dotted) of this space map. If it lets you adjust the scale… that is like opening and closing the clamshell you are looking into.
The traces are fit to both the major recent levels, and the future level inversions. Support becomes resistance.
It looks wild.. but on short time frames, the various traces create a pretty nice probability map… and if you keep track of where the trace came from comparing indicators can help confirm position.
DOGEUSDT BINANCE:DOGEUSDT Price is ranging between 0.18200 and 0.18650 dollars after a sharp rise from 0.17000. A break above 0.186 triggers a buy, targeting 0.19450 and 0.19950 dollars. A break below 0.182 triggers a sell, with supports at 0.17650 and 0.17000 dollars.
Trigger Levels:
Buy Trigger: 0.186
Sell Trigger: 0.182
⚠️Contorl Risk management for trades.

Doge Rocket End to End Cloud MoveThe idea basis is simple.
1) Full M pattern target did not fully hit, look for resistance that can send it lower to complete it.
2) Found the Daily Cloud End to End Move where we go to the very top and reject straight back down to fill out the M
We also have an inverse h&S showing 0.207 target
Good Luck

DOGE | BULLISH Pattern | +100%DOGE is seemingly ready for more upside as we start to see a pattern resembling an inverse head and shoulders pattern:
✅Usually, the Inverse H&S plays out something like this:
📢But the pattern is not quite confirmed just yet. We'd need to see a close ABOVE the current resistance zone to validate the pattern:
If we can see that, it's likely that there can be BIG gains on DOGE. It will especially help if ETH makes more increases, showing that the general alt market is heading in the right direction.
____________________
BINANCE:DOGEUSDT

Doge H1 | Pullback support at 38.2% Fibonacci retracementDoge (DOGE/USD) is falling towards a pullback support and could potentially bounce off this level to climb higher.
Buy entry is at 0.1857 which is a pullback support that aligns with the 38.2% Fibonacci retracement.
Stop loss is at 0.1770 which is a level that lies underneath a swing-low support and the 61.8% Fibonacci retracement.
Take profit is at 0.1990 which is a swing-high resistance that aligns close to the 50.0% Fibonacci retracement.
High Risk Investment Warning
Trading Forex/CFDs on margin carries a high level of risk and may not be suitable for all investors. Leverage can work against you.
Stratos Markets Limited (tradu.com ):
CFDs are complex instruments and come with a high risk of losing money rapidly due to leverage. 63% of retail investor accounts lose money when trading CFDs with this provider. You should consider whether you understand how CFDs work and whether you can afford to take the high risk of losing your money.
Stratos Europe Ltd (tradu.com ):
CFDs are complex instruments and come with a high risk of losing money rapidly due to leverage. 63% of retail investor accounts lose money when trading CFDs with this provider. You should consider whether you understand how CFDs work and whether you can afford to take the high risk of losing your money.
Stratos Global LLC (tradu.com ):
Losses can exceed deposits.
Please be advised that the information presented on TradingView is provided to Tradu (‘Company’, ‘we’) by a third-party provider (‘TFA Global Pte Ltd’). Please be reminded that you are solely responsible for the trading decisions on your account. There is a very high degree of risk involved in trading. Any information and/or content is intended entirely for research, educational and informational purposes only and does not constitute investment or consultation advice or investment strategy. The information is not tailored to the investment needs of any specific person and therefore does not involve a consideration of any of the investment objectives, financial situation or needs of any viewer that may receive it. Kindly also note that past performance is not a reliable indicator of future results. Actual results may differ materially from those anticipated in forward-looking or past performance statements. We assume no liability as to the accuracy or completeness of any of the information and/or content provided herein and the Company cannot be held responsible for any omission, mistake nor for any loss or damage including without limitation to any loss of profit which may arise from reliance on any information supplied by TFA Global Pte Ltd.
The speaker(s) is neither an employee, agent nor representative of Tradu and is therefore acting independently. The opinions given are their own, constitute general market commentary, and do not constitute the opinion or advice of Tradu or any form of personal or investment advice. Tradu neither endorses nor guarantees offerings of third-party speakers, nor is Tradu responsible for the content, veracity or opinions of third-party speakers, presenters or participants.

Doge(based on NEowave)like ETH wave E is ending and soon it will start a huge bullish wave.
wave E look likes a bow-tie diametrical and wave g is at the end which is the last chance to buy.

Doge Meme Coin daily demand level is playing out wellThe strong daily demand imbalance mentioned in a previous update is still in control and trying to play out as expected. Any long positions on this meme coin should be managed.

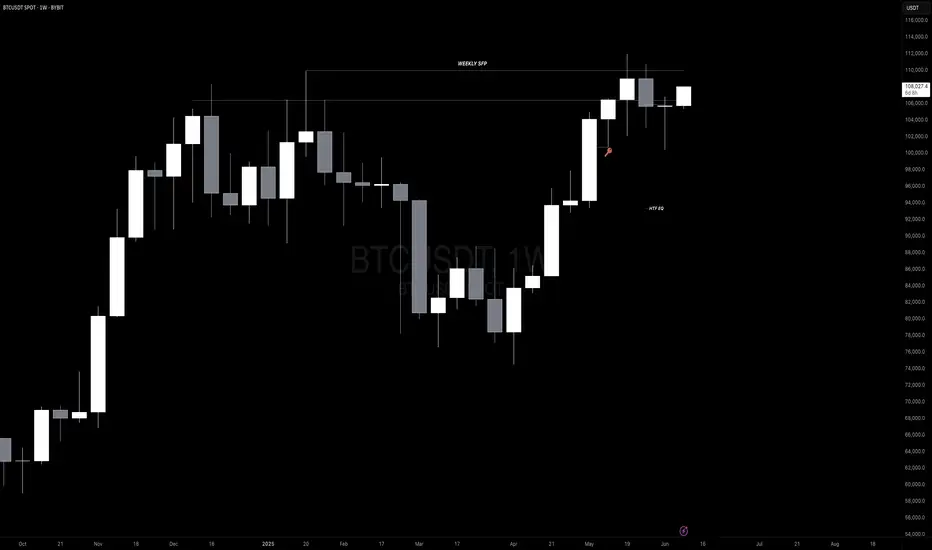
#BTC - Post Weekly Close Update 👉#BTC has deviated from the RLs and has since seen a magnificent recovery into KL, which, if closed above on the daily, can result in higher prices, potentially even a new ATH. The weekly candle itself is a long-legged doji, which, as you know, is an indecisive candle with a very small body representing indecision, and rightly so, as we continue to range on HTF with no resolution above or below the SH and SL.
I also note that despite the recovery, we’ve closed below the weekly resistance at 106400 on HTF. A weekly close above it would be ideal to confirm higher prices
👉On LTF/MTF – We’ve seen a break above the TL as well as 4H & 12H closes above the PSH at 106766, which ought to be sufficient as a signal for an upward move. For better confirmation, I’d like to see a daily close above PSH, followed by a PB into KL, and we can then look for entries on BTC or alts.
If, however, we see a rejection from the CMP and get below ~103K, it suggests a retest of 100K and potentially even 98K. So keep that in mind, even though that’s an unlikely scenario given the strength of the PA atm.
💪I also note that we haven’t left any imbalances in the chart. Every imbalance has been filled by an LH, which suggests we might see a swift move up if it comes. Now we’re just waiting for the daily close to confirm the BO above PSH, which seems likely given the PA.
💪Also, all BVOLs charts are at support atm, suggesting a massive surge in volatility may follow.
#DOGE/USDT#DOGE
The price is moving within a descending channel on the 1-hour frame and is expected to break and continue upward.
We have a trend to stabilize above the 100 moving average once again.
We have a downtrend on the RSI indicator, which supports the upward move by breaking it upward.
We have a support area at the lower limit of the channel at 0.1800, acting as strong support from which the price can rebound.
Entry price: 0.1838
First target: 0.1886
Second target: 0.1928
Third target: 0.1972

I positioned here — while others waited for confirmation.This was a textbook setup. Clean structure, high-probability narrative, and the kind of zone that doesn’t ask for your belief — it commands it.
Breakdown:
Price delivered a sharp move into a 1H OB confluence with an untouched 60min FVG sitting just below. That OB wasn’t noise — it was a true origin point, the last down candle before a major rally.
As price retraced, it swept short-term liquidity and tapped into that OB with precision. I watched volume spike on the drop — not retail fear, but Smart Money engineering the entry.
The 0.1795 zone wasn’t random. It was deliberate. A key equilibrium between displacement and rebalancing. And if this holds, the next logical draw is above 0.1860 — into the unmitigated FVG and resting buy-side liquidity.
Expectation:
From this 1H OB / FVG stack, I’m looking for:
Entry: ~0.1795
SL: Just under the 1.0 fib — under 0.1777
TP1: Mid FVG at 0.1831 (0.5)
TP2: Full inefficiency fill at 0.1887
I’m not forcing anything. If the market wants lower, there’s another FVG just below to absorb it — but structure still favors premium re-pricing.
Final note:
I don’t chase breakouts. I trap Smart Money setups, wait in silence — and strike when the chart gives me the story.
“The market doesn’t move by chance. It moves by design. And I design my trades the same way.”

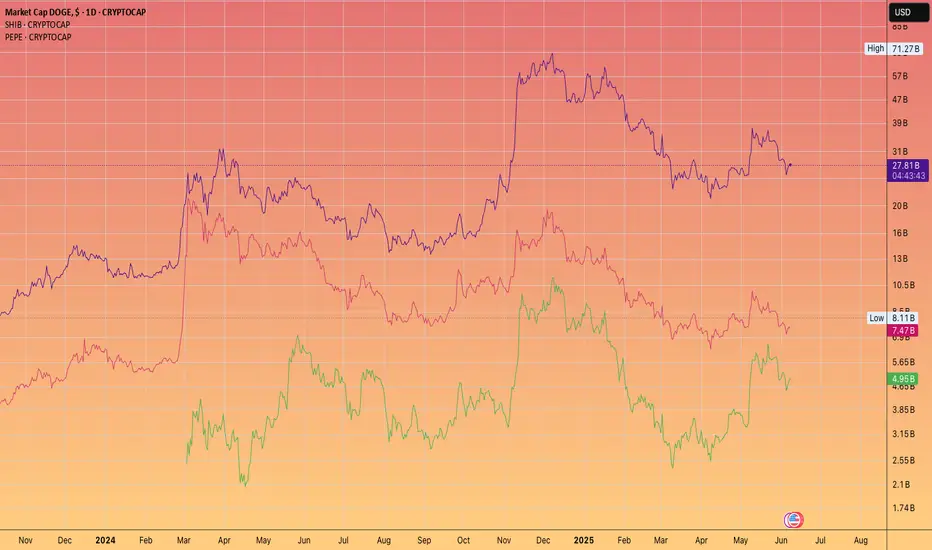
Pepe is going flip SHIB. But can it catch Dogecoin?If Ethereum were to smash $10k
Then it has a genuine chance IMHO
We shall be watching and tracking this as the cycle reaches it's mania phase!
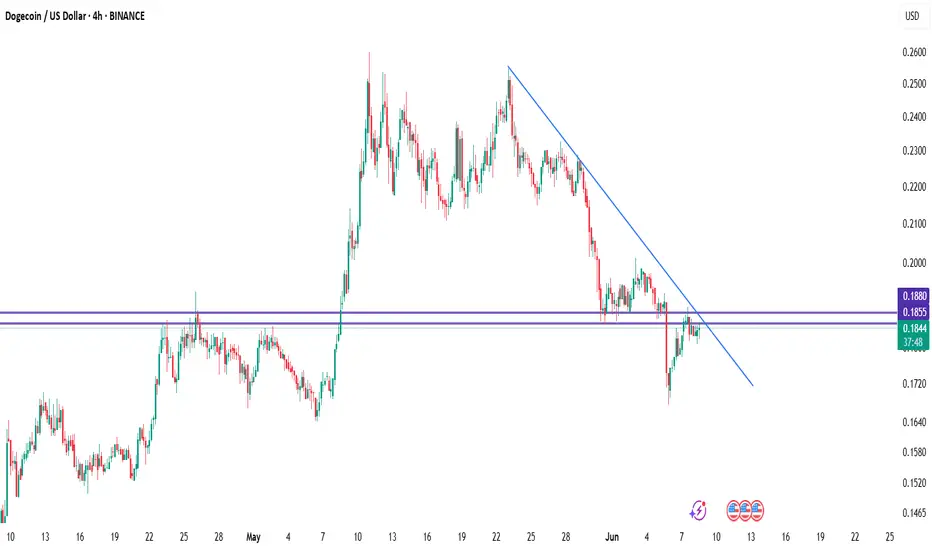
DogeusdtDOGE/USDT – 4H Chart Analysis
Dogecoin is currently testing a key resistance zone between $0.1855 and $0.1880, which aligns with the descending trendline from the May highs. Price action is showing early signs of bullish momentum, but a confirmed breakout above $0.1880 is needed to shift the market structure.
🔹 Bullish Scenario:
If DOGE breaks and closes above $0.1880 with volume, it could trigger a trend reversal. Immediate targets would be:
$0.1980
$0.2100
🔹 Bearish Scenario:
Failure to break resistance and a drop below $0.1810 would likely lead to further downside toward:
$0.1760
$0.1640
BabyDoge to 1800% Growth? Breakout Confirmed — A Strong Pump AheI expect BabyDoge to grow by 1800%. We've broken out of a triangle pattern with volume, and while it might seem like a distribution phase, the volume is still there, indicating continuation. BabyDoge hasn't been pumped as much as Dogecoin, and it's still ranked #184 on CoinMarketCap at the time of writing — so there’s huge potential for growth.
The price broke a key level and did a successful retest. If the price continues to rise on volume after this retest, it will confirm my scenario for strong upside movement.
If BabyDoge continues to build volume and rise, it could repeat Dogecoin’s explosive growth — but this time, with BabyDoge as the underdog. Keep an eye on the volume and price action over the next few days. If volume picks up, we could see the big move coming!

Doge coin log term that my personal view for the doge coin chart
it looks like history repeat it self my price target $2.50

A lesson in DOGEDoge vs btc is one of my favorite altcoin charts. it has done well for me.
I ignored it this cycle to my detriment and forgot the significance of alt/bitcoin charts like a fool.
Already have seen good swings in doge we might get back to $0.70 but expecting anything more is greedy. we likely will not see the level of speculation we saw last cycle when Elon Musk performed a DOGE skit on SNL... lets try to be as reasonable as we can with our magical internet money.
to be clear. short term underperformance to BTC then DOGE rips like it does every cycle for like a month.
Get in near the -90% discount vs btc (sell your btc to buy some doge)
If you just look at the usd chart then it should be up only from here.

DOGE - Next Castle?Hello,
Here you can see the Cstle formed by hte last harmonic patterns support and resistance levels.
We are primed for another one of these castles in the sky. Possibly with one more pull back into the teens before we go.
Very exciting!

DOGEUSDT 1D Analysis DOGE ~ 1D Analysis
#DOGE Buy back gradually from here with a short term target of at least 15%+ from here.

They see relief. I see rebalancing.BINANCE:DOGEUSDT.P isn't bullish — it's rebalancing. What we’re witnessing now is price doing what it always does after manipulation: return to efficiency before delivering its next displacement.
Here’s the setup:
Price tapped into the 4H discount zone — a structural STB
We’re now reacting from the 0.618 (0.1940) and pushing up toward the 4H OB at 0.20403
That OB is perfectly nested just above the 0.5 fib (0.20190), and below the 0.382 (0.20970) — prime for internal liquidity collection
If price fails to break structure above that 4H OB, the move is complete. This isn’t bullish continuation — it’s cleanup. From there, I’m watching closely for signs of rejection and displacement back toward the OB + BTS zone near 0.16884.
This is where real risk is priced in — and where Smart Money actually loads up.
Execution mindset:
Let price reach into 0.204–0.209
Watch for rejection — that’s the trigger
Downside target: 0.18299 → 0.16884
If we impulsively break 0.2097 and reclaim it, the bearish thesis is invalidated and I’ll re-evaluate
This isn’t trading a bounce. It’s reading the cleanup.
You want real entries, real invalidations, real structure? Check the profile description. The trades speak louder than the noise.

DOGEUSD Fibonacci Channel shows minimum $1 Target end of year.Dogecoin (DOGEUSD) has held perfectly its 1W MA200 (orange trend-line) on the April 07 bottom, rebounded and is now consolidating around its 1W MA50 (blue trend-line). This consolidation shouldn't last for too long as based on the previous Cycles, this 1W MA200 test was the new bottom that should kick-start the final year rally.
As you can see, DOGE's historic pattern since its first trading day has been a Channel Up, which with the added element of the Fibonacci lines, only broke during the 2021 Top formation on its 1.5 Fib extension.
A key characteristic of the final year of each Bull Cycle is that after a 1W Golden Cross is formed, the price has always first hit the Mayer Multiple Bands (MMB) 2SD above (thin orange trend-line) and shortly after the MMB 3SD above (thin red trend-line).
So far the current Cycle has only hit the MMB 2SD because as the pace of this Cycle naturally slowed down (the higher the cap the slower the pace), it didn't go straight for a MMB 3SD test.
Despite the delay, the Fibonacci Channel along with the MMB give, in our opinion, two Target levels for this final year of the Cycle, a fair one and an optimistic. The fair one is at $1.00, which would make a perfect test of both the MMB 3SD and the 1.0 Fib ext at the top of the Channel Up. The optimistic is at $3.5 (potentially even higher), which would be exactly on the 1.618 horizontal Fibonacci extension (still below the 1.5 Channel Fib), which was the January 2018 Cycle Top and of course was greatly exceeded during the May 2021 Cycle Top.
-------------------------------------------------------------------------------
** Please LIKE 👍, FOLLOW ✅, SHARE 🙌 and COMMENT ✍ if you enjoy this idea! Also share your ideas and charts in the comments section below! This is best way to keep it relevant, support us, keep the content here free and allow the idea to reach as many people as possible. **
-------------------------------------------------------------------------------
💸💸💸💸💸💸
👇 👇 👇 👇 👇 👇

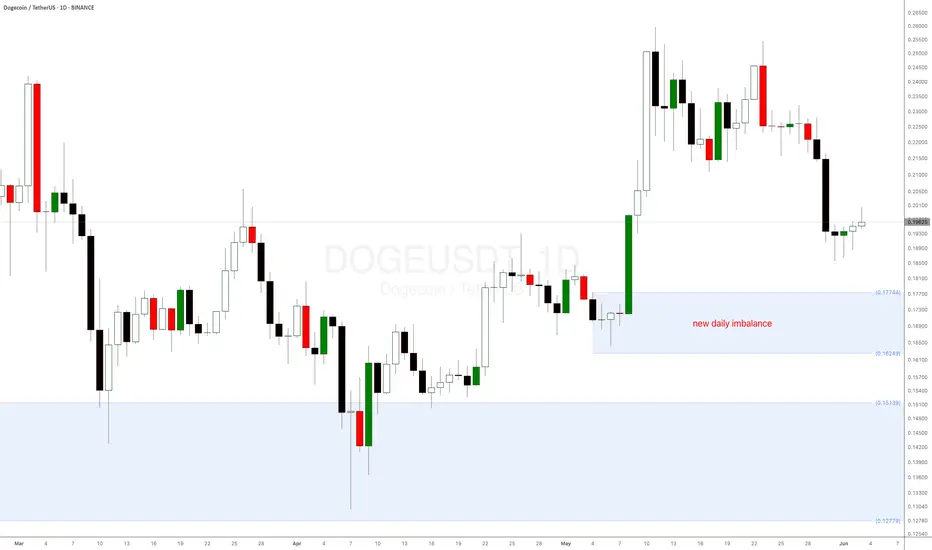
How to Spot the Perfect Dogecoin Buy Signal!Dogecoin (DOGE) is showing another major bullish signal!
After bouncing from the key weekly demand level at $0.151 mentioned in a previous supply and demand crypto analysis, DOGE coin is now approaching a new daily demand imbalance at $0.18035—a level where buyers have historically stepped in aggressively.
Why This Matters:
Strong Reaction Expected: Similar imbalances on other altcoins have led to sharp upward moves.
Long-term weekly imbalance: The weekly demand level is playing out very well.
Dogecoin (DOGE), the world’s favourite meme cryptocurrency, is trying to reach a critical weekly demand level at $0.151—its strongest daily demand zone in a long time! This presents a prime buying opportunity, especially for crypto beginners looking to enter the market.
Check the previous DOGE analysis from a few weeks ago.