How to Spot the Perfect Dogecoin Buy Signal!Dogecoin (DOGE) is showing another major bullish signal!
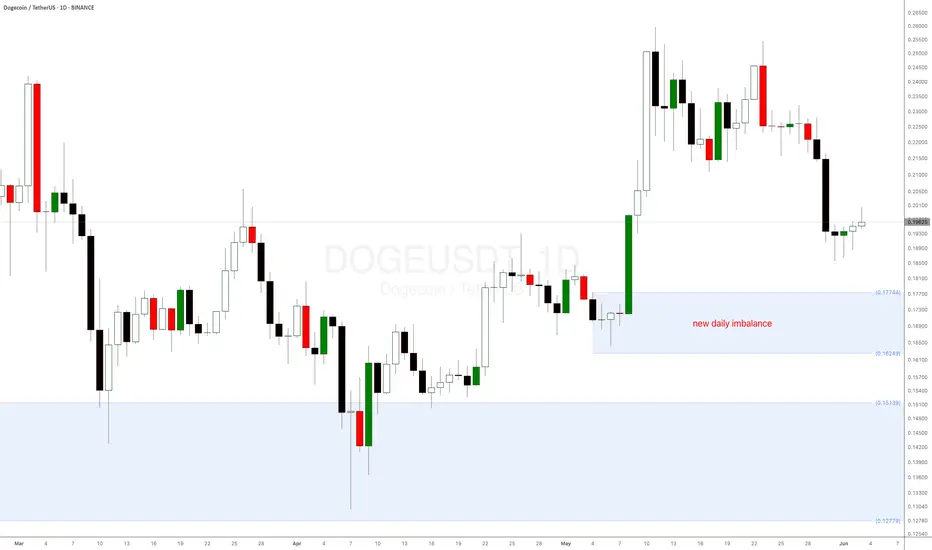
After bouncing from the key weekly demand level at $0.151 mentioned in a previous supply and demand crypto analysis, DOGE coin is now approaching a new daily demand imbalance at $0.18035—a level where buyers have historically stepped in aggressively.
Why This Matters:
Strong Reaction Expected: Similar imbalances on other altcoins have led to sharp upward moves.
Long-term weekly imbalance: The weekly demand level is playing out very well.
Dogecoin (DOGE), the world’s favourite meme cryptocurrency, is trying to reach a critical weekly demand level at $0.151—its strongest daily demand zone in a long time! This presents a prime buying opportunity, especially for crypto beginners looking to enter the market.
Check the previous DOGE analysis from a few weeks ago.
DOGE-1
Price tapped the discount — now it’s time to test premium.This setup on DOGE/USDT was mechanical. Not emotional.
I’ve seen this formation enough to know what comes next. The chart has already spoken.
After a clean markdown into the 4H OB, price hit the 0.786 retracement level — right inside a prior imbalance zone. That wasn’t a random drop. That was engineered. Liquidity was swept, sentiment reset, and now we have structure ready to reverse.
Notice this:
We’re sitting in a 4H demand OB with confluence from the FVG just above.
The Fibonacci levels are aligning with Smart Money delivery: 0.5 sits right at the base of the new rally expectation.
The 0.20928 level is the first key reaction point — I expect a stall or consolidation there.
But the real test comes higher: the 0.22094 OB, which also aligns with the 0.382 fib level — the market’s threshold between discount and premium.
I’ll be watching price closely on its approach into that 0.209–0.22094 region. If it delivers clean displacement through FVG, the next liquidity grab sets up a premium continuation model.
If we reject early — that tells me distribution is starting, and I’ll prep for a secondary sweep below 0.18 to retest the deeper 4H OB near 0.16387.
This setup didn’t require a confirmation signal.
It required understanding why price dropped — and where it’s designed to go.
I don’t need to guess. I just need to be aligned.

Gold H2 Market Update Ongoing Accumulation BUY LOW SELL HIGH📊 Technical Outlook Update H4
🏆 Bull Market Overview
Gold is currently trading around $3,352.69 per ounce, up 1.9% today, reaching its highest level since May 23, driven by renewed safe-haven demand amid escalating U.S.-China trade tensions and a weaker dollar. The market remains range-bound, with key resistance levels at $3,410 and $3,460, and support levels at $3,160 and $3,240. Volatility is expected to remain moderate, with potential catalysts including upcoming U.S. employment data and central bank policy decisions.
⭐️ Recommended Strategy
Continue to buy on dips near support levels and sell near resistance levels, capitalizing on the current range-bound market conditions. Monitor for potential breakouts above resistance or breakdowns below support, which could signal a shift in market dynamics.
Latest Gold Market Updates:
📈 Gold prices have surged due to renewed tariff threats from the U.S. and escalating geopolitical tensions, prompting investors to seek safety in gold.
💰 Gold miners are largely avoiding hedging strategies to fully benefit from the current market, reflecting strong bullish sentiment in the industry.
🔮 Citibank projects gold prices could rally to $3,500 over the next three months, citing strong demand and macroeconomic factors.
📊 JP Morgan anticipates gold prices exceeding $4,000 per ounce by Q2 2026, with an average of $3,675 in Q4 2025, driven by continued investor and central bank demand.
⭐️ Goldman Sachs has raised its year-end 2025 forecast to $3,700, with a potential upside scenario reaching $4,500, based on strong Asian buying and central bank purchases.
💍 Record gold prices are prompting jewelry designers to shift toward 14-karat gold and alternative materials to control costs, while consumer demand remains robust.
🔮 Outlook Summary
Gold remains in a bullish trend, supported by safe-haven demand amid geopolitical tensions and economic uncertainties. The market is currently range-bound, with key levels to watch at $3,160–$3,240 for support and $3,410–$3,460 for resistance. Upcoming economic data releases and central bank policy decisions could act as catalysts for a breakout from the current range. Analysts maintain a positive outlook, with forecasts suggesting potential for further price increases in the medium to long term.

DOGE Ready for PUMP or what ?What I see now is that the price could correct to the PRZ and then pump again, and currently, there is no specific bullish pattern in the chart. which could cause the price to drop below 17 cents.
Best regards CobraVanguard.💚

BTC (Post Weekly Close Update)CRYPTOCAP:BTC (Post Weekly Close Update)
We’ve confirmed a weekly SFP and observed a bearish engulfing weekly close, signaling caution at the very least. Whether the price corrects to our target, BOs here, or reaches a new ATH remains uncertain, so we’ll play it level by level. Imo, subtle signs of bullish exhaustion are worth noting.
That said, I don’t expect a collapse to 70K, though anything is possible. I anticipate a drop below the key 100K level, targeting the 18H HOB and weekly FVG around 98K. We could even see a wick into the CME gap, YO, and VRVP support observed at 94K. This move may spark fear, traders anticipating lower, with some calling for a bear market. However, I expect the price to reverse, reclaim key levels, and resume the uptrend.
On LTF/MTF - charts, we’re trading level by level. A range may form, allowing the market to gather liquidity to sustain the trend, especially since we missed liquidity at 72K. As long as the price remains below 107K, scalping makes more sense than swing trading in the short term. A break above 107K could target 110K or a new ATH. However, if the price reaches 107K - around 107800 - I’d consider shorting. A daily close above 107K might trap retail traders into opening longs, only for the price to retrace and head lower (keep this scenario in mind).
VELO data:
Market dynamics are stable. Spot is flat or selling, while perps are driving pric. OI has dropped from dangerous levels, and funding rates remain slightly positive. Overall, nothing significant is occurring, which aligns with the current range-bound market.

The key is whether it can find support at 0.18951 and go up
Hello, traders.
If you "Follow", you can always get new information quickly.
Have a nice day today.
-------------------------------------
(DOGEUSDT 1D chart)
It touched the A section, which was the previous breakout trading section, again.
That is, if it is supported and rises near 0.18951, it is a time to buy.
If not, it will fall below the M-Signal indicator of the 1M chart, so caution is required when trading.
This is because in order to continue the upward trend in the medium to long term, the price must be maintained above the M-Signal indicator of the 1M chart.
Therefore, a short and quick response is required when trading below the M-Signal indicator of the 1M chart.
-
The channel of the High Line ~ Low Line of the OBV indicator is showing signs of turning into a downward channel.
Therefore, you should check whether the OBV shows signs of rising above the High Line.
-
The basic trading strategy is to buy near the HA-Low indicator and sell near the HA-High indicator.
It currently meets the HA-High indicator and falls to meet the HA-Low indicator.
Therefore, this wave should be interpreted as closed.
Therefore, a new wave will start from the HA-Low indicator that we met this time.
If it falls from the HA-Low indicator, it is likely to show a stepwise downtrend, and if it rises from the HA-High indicator, it is likely to show a stepwise uptrend.
Therefore, we need to check whether the HA-Low indicator supports the new wave to see if it is a downtrend or an uptrend.
-
Thank you for reading to the end.
I hope you have a successful trade.
--------------------------------------------------
- This is an explanation of the big picture.
(3-year bull market, 1-year bear market pattern)
I will explain more details when the bear market starts.
------------------------------------------------------

DOGE ShortOne of the ones that looks good for short. I entered a little bit from here, I will add a little bit more with the trend break.
I am short-biased because I think there will be a correction in my general market bias. After a correction I will look for long positions

$USDT.D Rejeccted Again Altseason SignalCRYPTOCAP:USDT.D Rejected Again Altseason Signal
USDT Dominance is showing a clear rejection from the descending trendline and 200 MA, similar to the previous 16% drop.
The RSI is turning down from the overbought zone, signalling potential downside.
If this move plays out, we could see USDT.D fall toward the 4.0% zone, which is bullish for Altcoins.
DYRO, NFA

DOGECOIN Bearish Signal | Technical + Custom AlgoSmart Trend Signal | Technical Analysis + Custom Algorithm
This signal is the result of a combination of classic technical trend analysis and a proprietary software I personally developed.

DOGECOING Bearish Signal | Technical + Custom AlgoSmart Trend Signal | Technical Analysis + Custom Algorithm
This signal is the result of a combination of classic technical trend analysis and a proprietary software I personally developed.

$CRO Breakout ConfirmedGETTEX:CRO Breakout Confirmed
OKX:CROUSDT has broken out of a symmetrical triangle after weeks of consolidation. A bullish MACD crossover and a reclaim of the 50-day EMA support the breakout. A potential 125% move is in play, targeting the $0.235 zone.
The chart shows that strong momentum is building.
DYRO, NFA

Dogecoin Bearish (BD) but Bullish (BU)You see, Dogecoin is bearish but this bearish is only short-term. This retrace can last a few days more and then the market will turn and start growing again. In the worst case scenario, the drop can extend and last one or two weeks, that's it. Nothing more.
So, what does it matter if it goes down short-term when it will grow in the long haul.
See the pattern on the chart and the rising trendline at the bottom. This is the main support. The bullish structure will remain intact, the market is adapting because obviously, too much leverage can never work.
Once the over-leverage is removed from the market, we resume growing and this resumption is just around the corner. Next week or the week after, it doesn't matter, we are going higher.
Namaste.

DOGE|Bearish Triangle Formation On30-Min Chart-Breakdown Ahead?📉 DOGE Bearish Triangle Breakdown | 30-Min Chart
This chart highlights a classic *bearish triangle formation* in DOGE's market cap on the 30-minute timeframe. The pattern shows a series of lower highs with horizontal support around the 32.45B zone.
🔍 Key Observations:
- Pattern: Bearish Triangle
- Resistance: ~34.7B
- Support Zone: ~32.45B
- Target Zone (Post-Breakdown): ~31.3B
A breakdown below the support level could signal further downside movement. However, confirmation is key — traders should watch for volume and candle close below support.
🕒 Timeframe: 30-Minute Chart
📆 Analysis Date: May 29, 2025
---
⚠ *Disclaimer:*
This analysis is shared purely for *educational purposes* and does not constitute financial advice. Please do your own research and risk management before making any trading decisions.

doge buy midterm"🌟 Welcome to Golden Candle! 🌟
We're a team of 📈 passionate traders 📉 who love sharing our 🔍 technical analysis insights 🔎 with the TradingView community. 🌎
Our goal is to provide 💡 valuable perspectives 💡 on market trends and patterns, but 🚫 please note that our analyses are not intended as buy or sell recommendations. 🚫
Instead, they reflect our own 💭 personal attitudes and thoughts. 💭
Follow along and 📚 learn 📚 from our analyses! 📊💡"

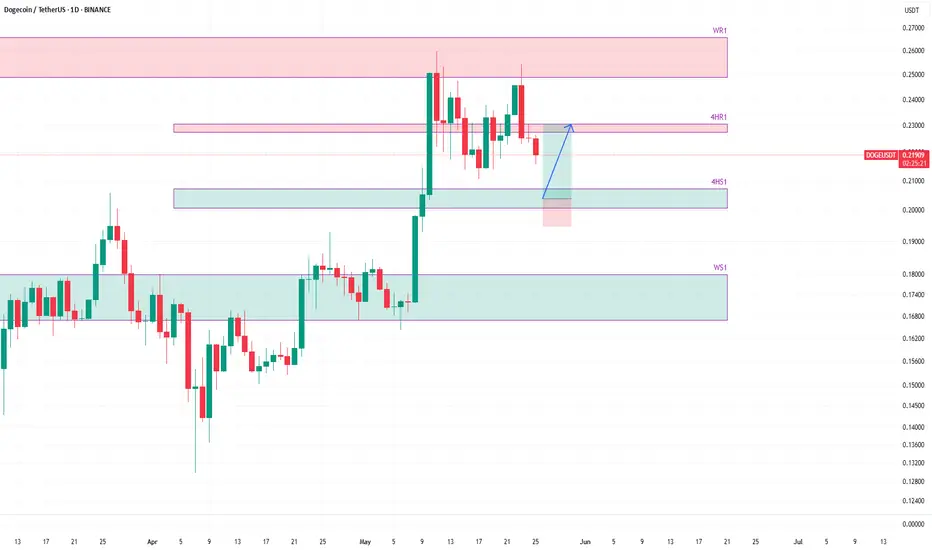
DOGEUSDT to drop to 4h support before bounceHere is analysis of DOGEUSDT support and resistances.
The price was rejected from weekly resistance zone WR1 two time. The price is currently on downward move. An next support on the way is 4h support 4HS1 and the next one is weekly support WS1.
The price is likely to bounce from 4h support 4HS1. This will provide a long opportunity from 4HS1 towards the 4h resistance 4HR1.
The possibility that the price may touch WS1 again on this current downward move, beyond some bounces which we are planning to exploit for long setups, is real.
Lets wait and watch while we take the given trade and review the price reaction on touching 4HR1 on the expected bounce from 4HS1.

doge buy midterm"🌟 Welcome to Golden Candle! 🌟
We're a team of 📈 passionate traders 📉 who love sharing our 🔍 technical analysis insights 🔎 with the TradingView community. 🌎
Our goal is to provide 💡 valuable perspectives 💡 on market trends and patterns, but 🚫 please note that our analyses are not intended as buy or sell recommendations. 🚫
Instead, they reflect our own 💭 personal attitudes and thoughts. 💭
Follow along and 📚 learn 📚 from our analyses! 📊💡"

DOGE Analysis (4H)It appears that Dogecoin's correction has started from the point where we placed the red arrow on the chart. This correction seems to be a flat pattern, with the first two parts forming a diametric and a triangle.
If the price reaches the green zone | which is a key area | we can start looking for buy/long positions.
Targets : 0.23092 _ 0.25283 _ 0.29426 _ 0.32217
A daily candle closing below the invalidation level will invalidate this analysis.
For risk management, please don't forget stop loss and capital management
Comment if you have any questions
Thank You

Next Breakout Trading Zone: 0.26850
Hello, traders.
If you "Follow", you can always get new information quickly.
Have a nice day today.
-------------------------------------
(DOGEUSDT 1D chart)
It is expected that a breakout trade will be possible when the B zone breaks upward.
Conditions for a breakout trade:
1. OBV must show an upward trend. If possible, it is good to see an upward breakout of the High Line.
2. It should show that the StochRSI indicator maintains the K > D status. If possible, it is good if K does not enter the overbought zone.
If it rises above 0.24651, you should check if the OBV and StochRSI indicators meet the breakout trading conditions.
If it fails to rise, you should check if it is supported around 0.21409-0.22958.
If the price maintains above the M-Signal indicator on the 1M chart, it is likely to continue the upward trend.
-
Thank you for reading to the end.
I wish you successful trading.
--------------------------------------------------
- This is an explanation of the big picture.
(3-year bull market, 1-year bear market pattern)
(3-year bull market, 1-year bear market pattern)
I will explain more details when the bear market starts.
------------------------------------------------------

DOGECOIN (FREE SIGNAL)Hello friends
Given the good growth we had, the price has corrected and now is a good time to buy step by step and with capital management...
We have specified the purchase steps for you and the target is also specified...
*Trade safely with us*

DOGEUSD: Hasn't said its last word. $3 within reach.DOGE is bullish on its 1D technical outlook (RSI = 64.264, MACD = 0.014, ADX = 32.304) fueling a larger move on the 1M candle which last month rebounded exactly on the 1M MA50. This suggests that long term, Doge is on the very same spot as it was on both prior Cycles in February 2021 and September 2017. Both were the last lows before the end Cycle rally, which was on average +2600%. If it's repeated, Dogecoin can very well reach $3.00 by the end of the year.
See how our prior idea has worked out:
## If you like our free content follow our profile to get more daily ideas. ##
## Comments and likes are greatly appreciated. ##

DOGE LONG TERMMy scenario is like this.
* The purpose of my graphic drawings is purely educational.
* What i write here is not an investment advice. Please do your own research before investing in any asset.
* Never take my personal opinions as investment advice, you may lose your money.

DOGEBTC Strong chance that Dogecoin outperforms Bitcoin soon.DOGEBTC is testing its 1W MA50 (blue trend-line), which keeps it into a buy zone, exhibiting the same kind of price action it had during its previous Cycle in late December 2020.
That was right before the parabolic rally started where Dogecoin outperformed Bitcoin massively on the last strong known Altseason.
Right now the market is forming the same 1W MACD Bullish Cross it did on December 21 2020, straight after which it broke above the 1W MA50. The rebounded that was causes even broke above the Cycle's Falling Wedge in a rally that lasted 4 months.
We are inside a similar Falling Wedge since 2021 so a break-out may have a similar outcome. This chart shows that it may be time to move some capital to Doge.
-------------------------------------------------------------------------------
** Please LIKE 👍, FOLLOW ✅, SHARE 🙌 and COMMENT ✍ if you enjoy this idea! Also share your ideas and charts in the comments section below! This is best way to keep it relevant, support us, keep the content here free and allow the idea to reach as many people as possible. **
-------------------------------------------------------------------------------
💸💸💸💸💸💸
👇 👇 👇 👇 👇 👇
