DOGECOIN : Should we expect an increase?Hello friends🙌
📈Given the decline we had, you can see that buyers entered at the specified support and formed a double bottom reversal pattern, which is a strong signal on support.
📉Considering the possible market correction, we placed two more buy levels lower so that we can buy there if the price corrects.
⚠Don't forget about capital and risk management, friends.
🔥Follow us for more signals🔥
*Trade safely with us*
Doge

DOGE Swing Trade – Key Support in PlayDOGE is currently holding a major support zone, offering a strong risk-reward opportunity for a long swing position. With bullish sentiment and meme coin narratives returning, this level is worth watching for upside continuation.
📌 Trade Setup:
• Entry Zone: $0.23 – $0.24
• Take Profit Targets:
o 🥇 $0.27 – $0.28
o 🥈 $0.37 – $0.44
• Stop Loss: Just below $0.215

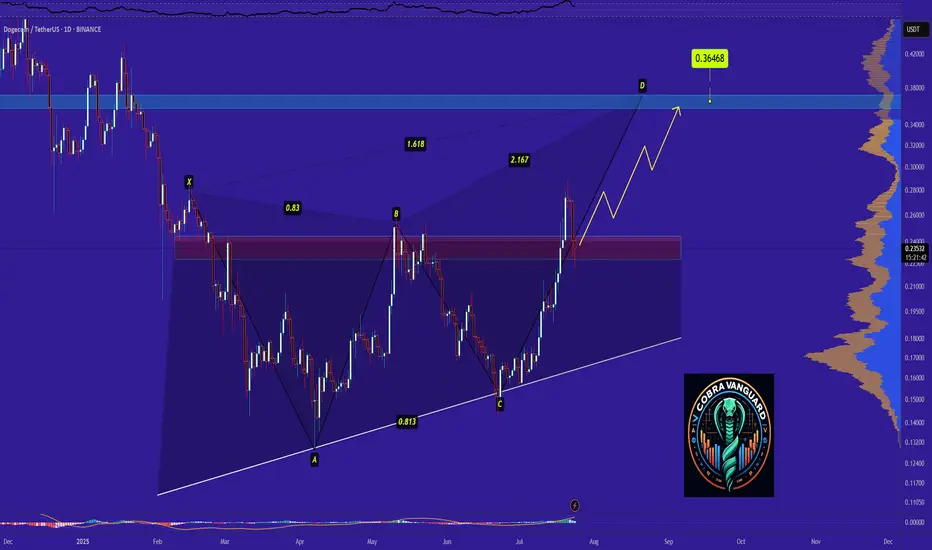
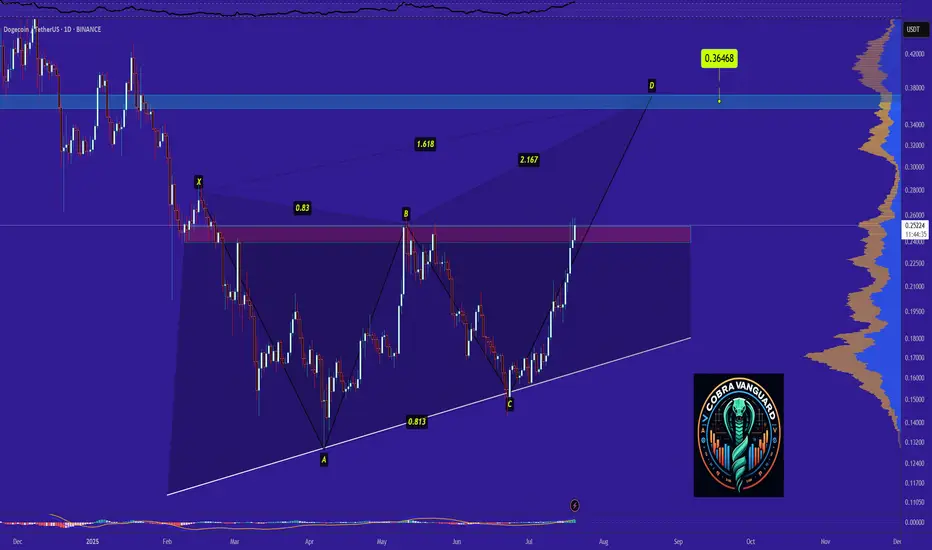
Dogecoin Ready for PUMP or what ?Dogecoin has completed and broken the ascending triangle in the daily timeframe, The price is currently supported well, which can increase the price. I expect the price to rise to around 0.36 .
Stay Awesome , CobraVanguard
DOGE Strategy — Momentum Entry, MA Trend Hold, Pullback PhaseThis chart showcases how the MACD Liquidity Tracker Strategy performed on DOGE over the past several days. The strategy entered during a clear momentum breakout and trended cleanly above its MA filter for nearly 48 hours.
Let’s break it down:
🔹 First Signal: Early compression breakout long, but price stayed flat. This entry was managed with a tight close before the second impulse began.
🔹 Second Long: Clean breakout on rising momentum — confirmed by MACD histogram expansion and strong Stoch RSI crossover.
🔹 Trend Structure: MA support held multiple times during this move, reinforcing the uptrend. Dotted trendline shows price respecting structure cleanly.
🔹 Exit Trigger: Price began consolidating and histogram showed waning momentum. The strategy correctly exited before the full reversal began.
🔹 Current Action: Pullback in progress. MACD histogram flipping red, Stoch RSI resetting. This may just be a correction… or the trend might be breaking.
📊 This setup is a textbook use of trend filters, confluence, and exit logic — and a good reminder that the strategy isn’t just about entry… it’s about managing exits with discipline.
Whether this develops into a higher low continuation or rolls into full reversal, momentum confirmation is key before the next entry.
#DOGE #TradingStrategy #AlgoTrading #MACDStrategy #QuantTrading #CryptoTechnicalAnalysis #PriceAction #TrendFollowing #Backtesting #CryptoCharts

DOGEUSD Is that a textbook Livermore Cylinder to $1.5 ??Doge (DOGEUSD) has been trading within a Bullish Megaphone for the majority of its Bull Cycle since the October 09 2023 Low. We may technically claim that this has been so far one massive Accumulation Phase, along with the rest of the altcoin market.
A pattern that draws strong comparisons with that Megaphone has been 'Livermore's Accumulation Cylinder'. Jesse Livermore, an American stock trader, came with a revolutionary trading pattern a century ago, whose principles often apply perfectly to today's financial assets.
This is what we do on today's Dogecoin analysis, we apply this Accumulation Cyclinder on Doge's Bullish Megaphone. Even though not a perfect fit obviously, the main characteristics apply, with clearly visible Bullish and Bearish Legs.
Based on this model, the market is right now starting the aggressive break-out phase above the Cylinder. Technically the Accumulation is over and the price may pursue levels 8 and 9, which give price Targets of $1.50 and $12.00 respectively.
Now, even though $12.00 falls well after (6 months or so) the expected duration of the current Bull Cycle, $1.50 is well within its limits (October - November 2025) and exactly double the price of the previous Cycle High. This makes it a very attractive Top candidate.
So do you think Doge is inside a Livermore Cylinder that is about to break out parabolically?
-------------------------------------------------------------------------------
** Please LIKE 👍, FOLLOW ✅, SHARE 🙌 and COMMENT ✍ if you enjoy this idea! Also share your ideas and charts in the comments section below! This is best way to keep it relevant, support us, keep the content here free and allow the idea to reach as many people as possible. **
-------------------------------------------------------------------------------
💸💸💸💸💸💸
👇 👇 👇 👇 👇 👇

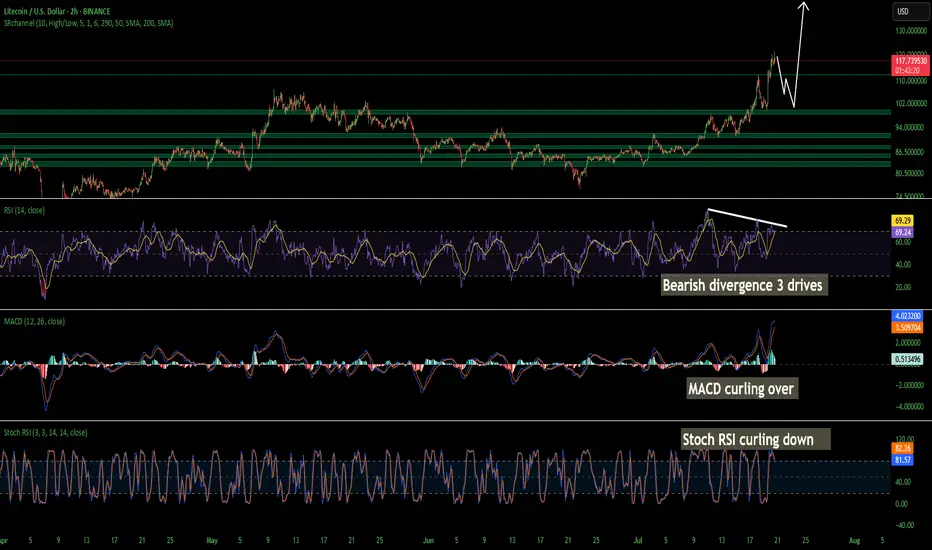
LTC Litecoin Short Term Pull Back Quick and SharpI believe Litecoin Is topping out on the 2 hour. Looks like we may come back down and tap support at around 104 but I wouldn't be surprised a wick hits 100. I have buy orders around 103-106. I am not super confident on a deeper pullback so thats why my buys are there is so i don't miss the dip. Id rather make a little less money than miss a buy in trying to nail the bottom. Litecoin is starting its breakout from a 7 year consolidation and accumulation phase. This should be pretty massive. Litecoin is going to benefit considerably from these new bills that are being signed and many of the favorites in the top 100 will soon disappear!
The time for Litecoin to shine as I have been talking about for years is now. I am almost certain that this is that time. My predictions all still hold if you would like to go read them. I was just off on timing. Timing is the hardest thing to predict especially with how wild this planet has been lately. None of this is financial advice its just my opinion.
$PENGU Penguin consolidation at the moment.As long as CSECY:PENGU remains between .039 and .035 I consider it in consolidation. Breaks above or below these levels should see the targets posted.

Are you looking for a short in #DogeHi Padawans,
BTC.D is dropping from 66% to 60%, and as expected, ALTs are starting to pump.
I’m keeping an eye on DOGE and will look to take some quick short scalps once it reaches the target levels.
Best regards,
CryptoObi
DOGE | Gearing up For a BIG MOVEDoge is looking mighty bullish after establishing a clear bottom.
Together with confirmation from BTC, we can safely say that altseason is yet ahead of us. BTC's recent increase show that the bullish impulse is still upon us. And after ETH increases, the rest of the altcoin market will follow suit as per usual.
DOGE is bullish because:
✅ Clear bottom
✅ Higher lows, daily looking to reclaim the moving averages:
✅ Altseason upon us after ETH increase
Ultimately, we need to wait for confirmation - if THIS major resistance zone is cleared (in other words if daily candles close ABOVE this zone) then we're full bull mode.
________________
BINANCE:DOGEUSDT

#DOGE Update #1 – July 21, 2025#DOGE Update #1 – July 21, 2025
Dogecoin has made healthy retracements after both of its last impulsive moves, maintaining a technically sound structure. I took a profit yesterday but didn’t share it due to higher risk.
Now, I've opened the Long position visible in the chart because I believe DOGE is targeting the second leg of this impulsive move, aiming for the $0.29 zone. I’m expecting approximately 6% gain from this setup.
The trend remains bullish, and pullbacks have been met with solid support, giving this trade a high probability of continuation. That said, always be cautious with sharp volatility.

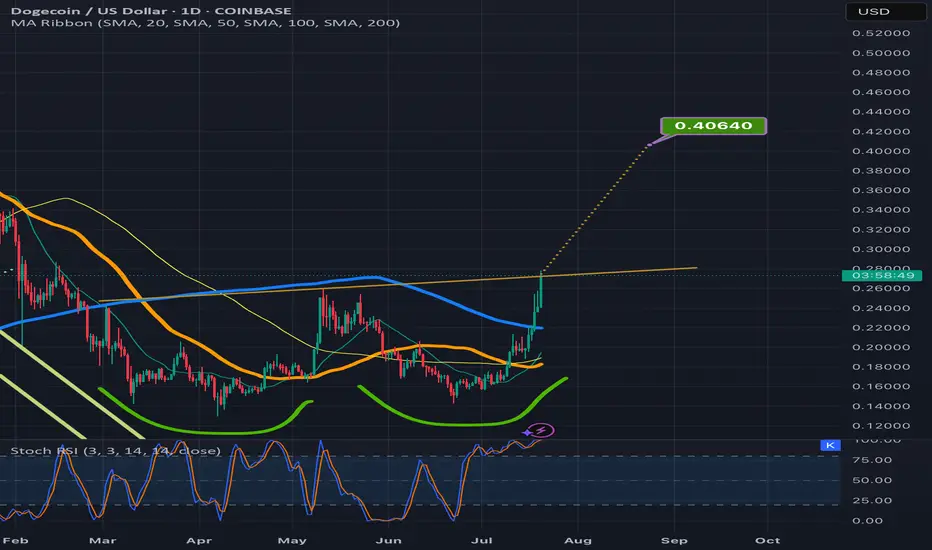
Dogecoin flyinng soon!This is super speculative and I am positioned big on btc but I do have to admit I have been buying doge is the past bear market and I would like to see it close to 1 dollar or maybe more. This idea of doge gives a 1.36 top price

Doge inching above the double bottom necklineIt could easily dip back below the neckline a tie or two before it validates the breakout but definitely getting closer to doing so. Target is around 40-41cents. *not financial advice*
DOGE close to parabolic moveCrypto never sleepin’.
I drew this arc a long time ago for fun just in comparison to the last DOGE cycles back in 2023. It has been surreal to see it somewhat follow the curve just coming down to tag it in recent weeks. The entire history of this asset just looks like a cup n’ handle leading into another cup n’ handle to now another cup that might break out soon

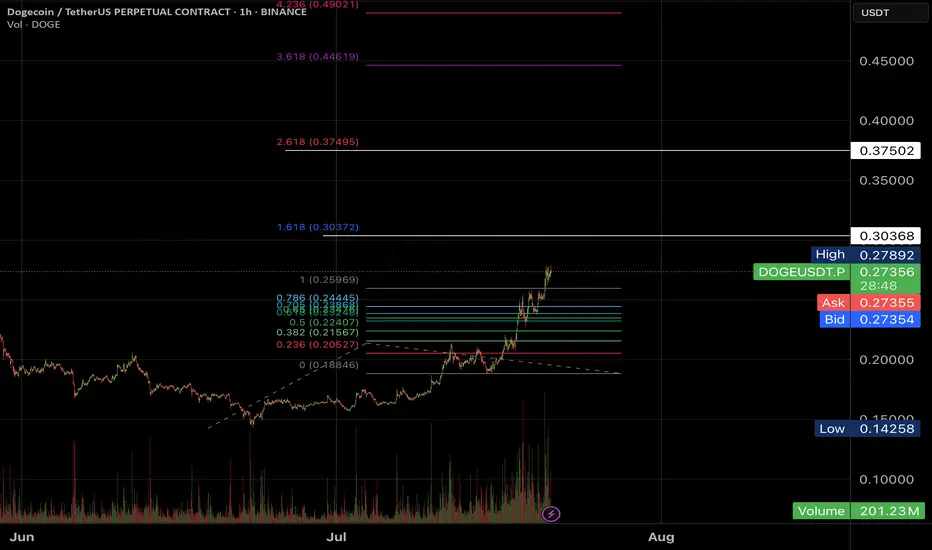
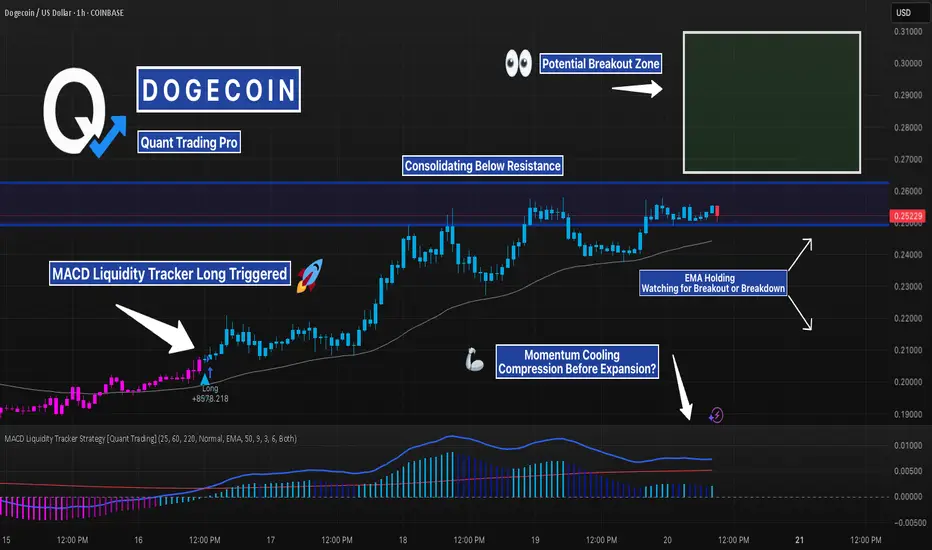
DOGE Coiling Below Resistance — Liquidity Tracker Already TriggeDOGE broke structure last week and pushed into a key resistance zone — but now price is going flat, consolidating just below breakout territory. This type of pause can either lead to continuation or a trap, and that’s exactly what we’re watching for.
The MACD Liquidity Tracker Strategy already triggered long earlier in the move, right around the $0.226 reclaim — a clean entry confirmed by bullish histogram shift, crossover, and trend alignment.
Since then, price has respected the EMA and gradually built up pressure just under the $0.257–0.270 zone.
The strength of this strategy is in combining MACD compression/expansion with trend filters, so it avoids whipsaw entries and only triggers when momentum AND structure align. This helps traders catch the beginning of a move — not the middle or end.
Right now, momentum is compressing again on lower timeframes, which often leads to a volatility expansion. The strategy is quiet for now, but the earlier long is still holding and valid.
We’re watching closely for a clean breakout above resistance — or signs of weakness that invalidate the move.
Whether this consolidates further or explodes from here, the setup has already shown how effective good filtering and timing can be.
Dogecoin - Time to buy again!So if you pay attention to the DOGE chart you can see that the price has formed a Ascending Triangle which means it is expected to price move as equal as the measured price movement.( AB=CD )
NOTE: wait for break of the triangle .
Best regards CobraVanguard.💚
$SHIB Ready to Move?CRYPTOCAP:SHIB has printed confirmed weekly bullish divergence in RSI and is now attempting to overcome the weekly 200EMA resistance.
A High Volume Node lies just above but a close above this will signal a bullish trend ready to move the initial target of the weekly pivot point followed by the 0.0003579 High Volume Node.
Price completed its retracement to the 'alt-coin' golden pocket 0.786 Fibonacci retracement.
Bearish divergence is currently growing on the weekly RSI but will be diverted with a thrust high!
Is it MEME season? CRYPTOCAP:DOGE also looks ready to go!
Safe trading

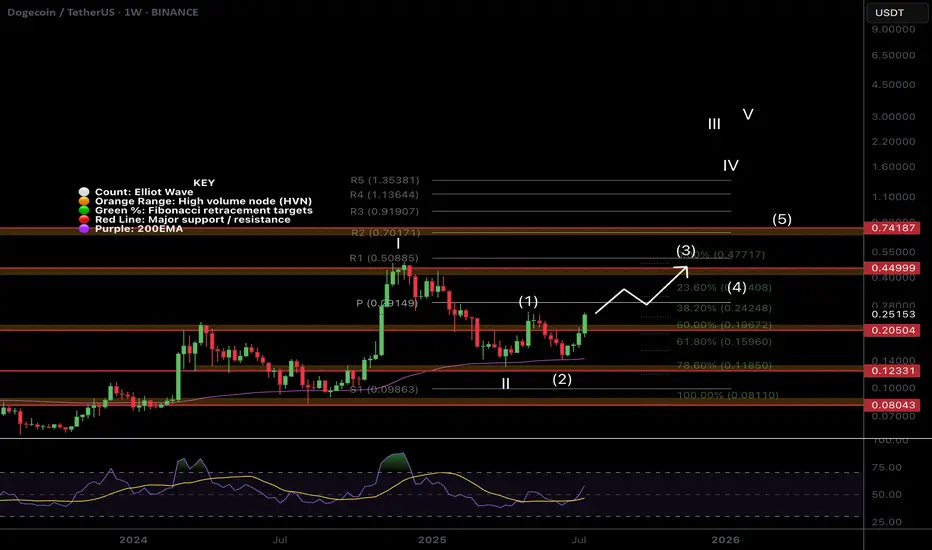
$DOGE Flipping to Bullish Structure!CRYPTOCAP:DOGE is coming to life after a second test of the weekly 200EMA as support and about to make a higher high, cementing in that higher low and flipping the macro structure bullish!
If the count is correct wave 3 of (III) should be powerful! The weekly pivot should put up a challenge as the first resistance before the High Volume Node at $0.45
Safe Trading
$1 in the Horizon for $DOGE!We’ve got something interesting brewing on CRYPTOCAP:DOGE right now:
Monthly trend is active
Uptrend in place for over a year (not relying on that timeline, but historically, targets hit within it)
If we can get above $0.30 and hold, the path to $1 opens up for the first time.
Other similar charts are also aligning for exponential moves, setting up to break out of multi-year consolidation patterns.
Keep a close eye on CRYPTOCAP:XLM as well — it’s shaping up with a very similar structure.

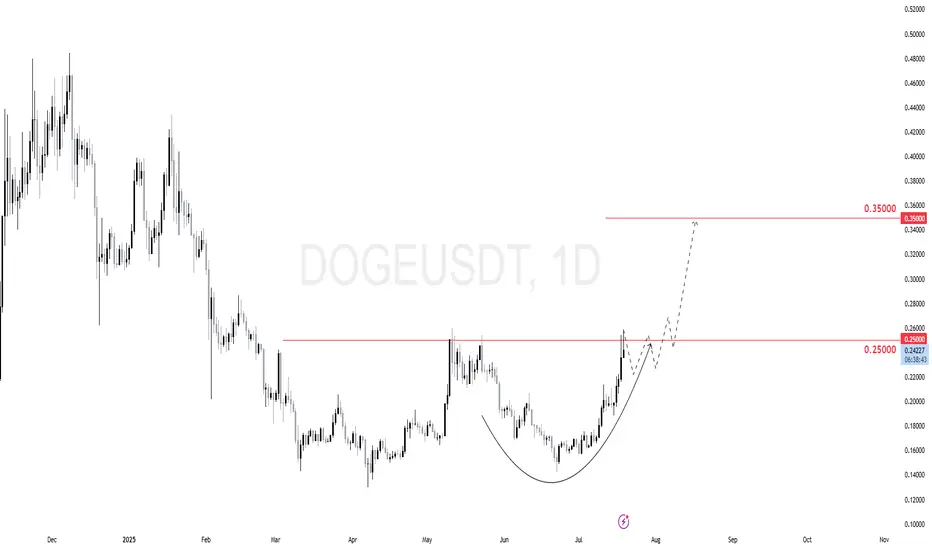
$DOGE (DOGECOIN) 1DDOGE just broke above the 0.25 key resistance.
The daily chart shows a clean cup-and-handle formation with a potential continuation setup.
Price might consolidate just above 0.25, creating a bullish base.
Then we expect a continuation move toward 0.35 as next target.
LTC/USD LITECOIN Adam & Eve Pattern On WeeklyThe Adam and Eve pattern is quite effective and usually signals a trend change to bullish. Once this pattern breaks the neckline I think its straight to $200 before any sort of pullback.
Haven't done a chart in a while cause its been the same old stuff, sideways. We are starting to ignite now. Silver is running which means something is breaking in the background financial system. I see the biggest blow off top you've ever seen coming, its the only way out of this, print print print until it doesn't work anymore.
Also I was reading that Bitcoin is removing its cap for spam in each block in October? This could spell disaster for fees and congestion. Litecoin will skyrocket during that time I believe because the fees will be so high it will price out the little guy trying to send a grand or two. I see an influx of people coming to Litecoin. Good luck , none of this is financial advice just my opinion

Bitcoin Interesting Fractal And Timing! GOING STRAIGHT UP!I noticed that the timing and pattern of how this is playing out in 2025 in Bitcoin is very similar to that of 2017. This fractal is not identical but its damn close. In 2017 there were approximately 15 million people in crypto, very few leverage exchanges, and trading was no where near what it is today. Now we have exchanges everywhere, hundreds of them most with leverage which we didn't really have before. Also not to mention that now we have big players getting in and they aren't buying and selling on the daily, they are buying it all and holding it, hence why we aren't seeing the typical "Alt season". The sloshing effect we had in the early days when traders would rotate out of Bitcoin into alts is not happening as it used to.
In 2017 Trump took office and in the end of March the bull run started in full swing. Something very similar is also happening now that we are in March and these fractals are lining up. Let see how this plays out. I think we are on the cusp of a giant mega bull run like you've seen before.
Crypto traders last year made mega profits cashing out multiple billions in capital gains. Once the selling stops around the end of March and beginning of April from people selling to pay taxes I think its on. This is not financial advice this is just my opinion. Lets see how this chart ages. Thank you for reading.

DOGE/BTC: HTF Retest Complete — Reversal BrewingDiving into DOGE/BTC, we’re seeing strong bullish confluences that align well with the DOGE/USDT structure and support the idea that the macro low is in.
Looking back across all available data, DOGE/BTC has traded within a clear 7-year accumulation range dating back to 2014, bounded by a defined range high resistance and range low support. This long period of consolidation enabled massive accumulation, ultimately leading to the first breakout in 2021, which rejected at the highs, pulled back, and then exploded into a cycle ATH.
Since that 2021 high, DOGE/BTC has been in a 4-year downtrend, retracing back into discount pricing, right into the range high of that original accumulation zone — which now acts as a major HTF demand level and last point of support before the original breakout.
📉 What’s happened recently?
- Price swept 2024 swing lows (SSL)
- Tagged the HTF demand zone
- Retested the 2021 breakout level (accumulation range high)
- Coiling inside a descending wedge with contracting volatility
This entire region is a key reversal zone from both a structural and psychological standpoint. It’s where we typically see major trend shifts form, and the structure suggests we’re forming a HTF swing low and bottom from this area.
🧠 Add this to the confluence from DOGE/USDT — which also appears to have printed its bottom — and the case for a macro reversal gets even stronger.
As this wedge tightens and price continues to compress against long-term support, I’m anticipating an explosive breakout that kickstarts the next leg of the HTF uptrend — effectively a continuation of the original breakout from the 7-year range.
5D:

DOGE to $2 before EOYCUP & Handle type formation on DOGE, really believe this can run to $2 during alt season which has just started firing its engines ...
BTC.D finally looks toppy.
📈 1. Technical breakout & chart patterns
DOGE has recently broken out of a long-term descending channel, forming a classic double-bottom pattern—a strong reversal signal.
It also cleared the key $0.20–$0.21 resistance zone, with on‑chain data pointing to rising futures/open interest and reduced sell pressure
⚖️ 2. Macro & regulatory tailwinds
The passage of the Genius Act in the U.S. House brought “clear‑cut regulation” for crypto, boosting confidence and driving DOGE higher—rising ~8% on the news
Broader crypto bull sentiment—fueled by possible Fed rate cuts and favorable legislation—has pushed altcoins like DOGE ahead this week
🧠 3. On‑chain & investor activity
Charts show increasing futures & spot trading volumes, along with expanding whale activity and holders staying profitable—collectively suggesting strong demand and low sell pressure
Network usage is also up: wallet interactions and momentum have accelerated as DOGE crosses these technical thresholds
💬 4. Community & utility factors
Dogecoin maintains a vibrant community, boating meme-driven social capital, plus occasional celebrity mentions (e.g., Elon Musk), keeping public attention
Its growing real-world usage in tipping, payments (e.g., Shopify, AMC, Tesla merch), and even institutional products—like the Grayscale Dogecoin Trust—adds fundamental backing
