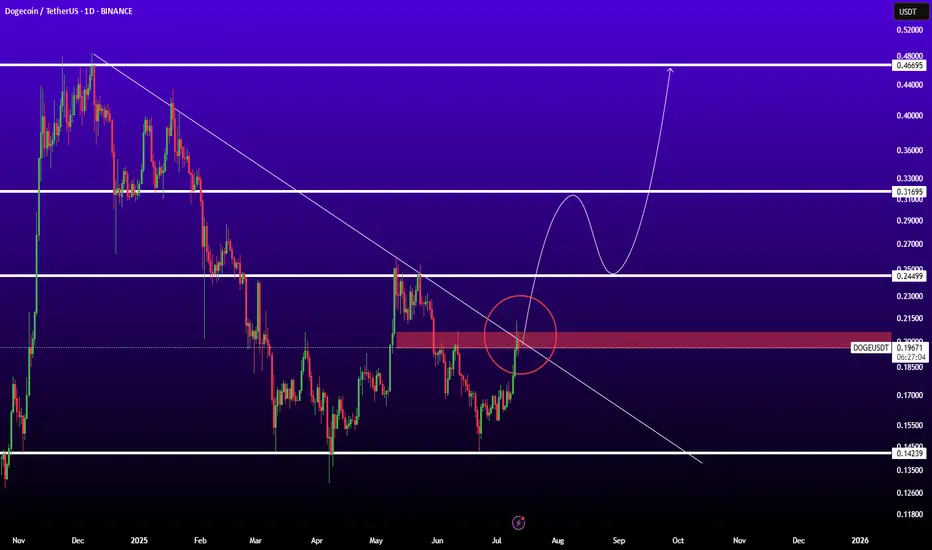
DOGEUSDTBINANCE:DOGEUSDT is in good level for pump because if breaked trendline and resistance 0.200$ ready for sharp movement to next levels.
Resistances: 0.25 - 0.32 - 0.45
Support: 0.15
Dogeanalysis
DOGE/BTC: HTF Retest Complete — Reversal BrewingDiving into DOGE/BTC, we’re seeing strong bullish confluences that align well with the DOGE/USDT structure and support the idea that the macro low is in.
Looking back across all available data, DOGE/BTC has traded within a clear 7-year accumulation range dating back to 2014, bounded by a defined range high resistance and range low support. This long period of consolidation enabled massive accumulation, ultimately leading to the first breakout in 2021, which rejected at the highs, pulled back, and then exploded into a cycle ATH.
Since that 2021 high, DOGE/BTC has been in a 4-year downtrend, retracing back into discount pricing, right into the range high of that original accumulation zone — which now acts as a major HTF demand level and last point of support before the original breakout.
📉 What’s happened recently?
- Price swept 2024 swing lows (SSL)
- Tagged the HTF demand zone
- Retested the 2021 breakout level (accumulation range high)
- Coiling inside a descending wedge with contracting volatility
This entire region is a key reversal zone from both a structural and psychological standpoint. It’s where we typically see major trend shifts form, and the structure suggests we’re forming a HTF swing low and bottom from this area.
🧠 Add this to the confluence from DOGE/USDT — which also appears to have printed its bottom — and the case for a macro reversal gets even stronger.
As this wedge tightens and price continues to compress against long-term support, I’m anticipating an explosive breakout that kickstarts the next leg of the HTF uptrend — effectively a continuation of the original breakout from the 7-year range.
5D:

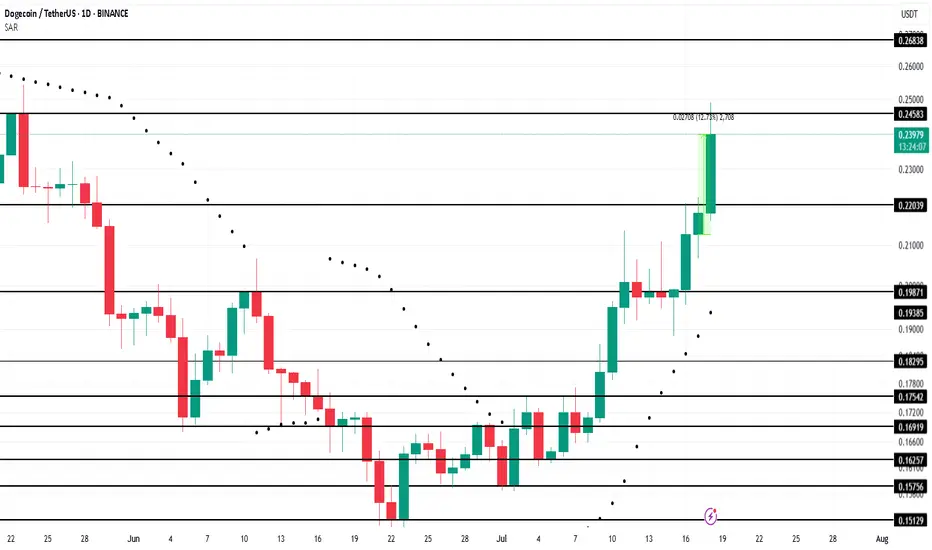
Dogecoin Leads Meme Coins With 12% Rally In 24 HoursBINANCE:DOGEUSDT , the leader of meme coins, surged 12% over the last 24 hours , reaching $0.239. This rally has positively impacted other meme tokens, showcasing DOGE’s influence within the market.
Currently facing resistance at $0.245, BINANCE:DOGEUSDT has reached a 2-month high . The Parabolic SAR below the candlesticks signals that DOGE is likely to maintain its upward trend in the coming days. If this support holds, the meme coin could continue pushing towards higher price levels, attracting more buyers and momentum.
However, meme coins are volatile. If BINANCE:DOGEUSDT holders decide to cash out their profits, the price could drop back down to $0.220 . Losing this support would invalidate the bullish outlook, signaling a possible downturn for the altcoin in the short term.
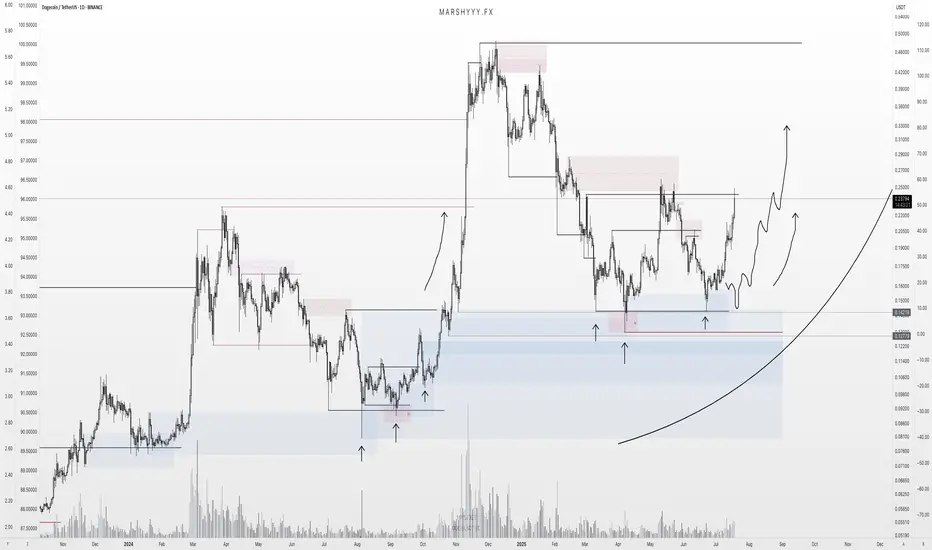
DOGE Update: Reversal Playing Out — $1+ in Sight?DOGE is playing out almost exactly as forecast back on June 14th, where I was monitoring for price to sweep the SSL and tap into range low demand within this larger HTF range.
Price did exactly that — pushing into discount, tagging the marked demand zone, and bottoming out right where I expected the reversal. I DCA’d hard at $0.165 after the initial low printed — just as planned.
Now sitting around +50% on those buys, and my plan remains to ride this out toward the ATH at $0.74 and potentially $1+.
The HTF closes forming here — across 3D, 4D, 5D, 6D candles — are showing clear strength. For me, the low is likely in, and I’m expecting new higher highs and ATHs from here. Now it’s just about letting the market do its thing, trailing stops, and taking profits into strength as alerts and targets get hit.
Zooming way out — I’m also watching DOGE’s 10-year uptrend channel. Price has once again tagged the lower bound of that channel, and historically, this has led to moves back to the channel highs.
🧠 Layer on a fib projection from the previous ATH to the bear market low, and we get:
1.272 Fib → ~$1.54
1.618 Fib → ~$3.92
Both of which align perfectly with the upper bounds of that long-term trend channel — giving us a key HTF reversal zone to monitor in the future.
In summary:
- Reversal from demand ✅
- DCA filled ✅
- HLs printing ✅
- Targets = ATH and beyond
- Watching HTF fibs + channel highs for eventual cycle top formation
DOGE is doing what DOGE does — don’t overcomplicate it.
1D:
3D:
1W:
1M:
Dogecoin - This is the key structure!Dogecoin - CRYPTO:DOGEUSD - has to reverse now:
(click chart above to see the in depth analysis👆🏻)
A couple of months ago Dogecoin retested the previous all time high. We have been seeing a harsh correction of about -65% thereafter. However Dogecoin still remains in a bullish market with bullish structure. In order to validate this trend, a reversal must happen now.
Levels to watch: $0.15, $0.5
Keep your long term vision🙏🙏
Philip (BasicTrading)

Complete Analysis of DOGE/USDT 4hComplete Analysis of DOGE/USDT 4h
The chart suggests a transition phase toward an uptrend.
Moving averages are beginning to slope upward, indicating a potential trend reversal. The MACD shows weakening selling pressure and is approaching a bullish crossover, which often precedes upward price movement.
Entry zones: Between 0.14452 and 0.15185 — favorable areas for position accumulation.
Price targets:
First target: 0.20455 (a key resistance zone).
Second target: 0.22942, where stronger selling pressure may emerge.
Risk management: A suggested stop-loss at 0.13561 to protect capital if the anticipated move fails.
If the price breaks and consolidates above 0.17, the market could gain momentum to reach the projected targets. Monitor volume during breakout candles to confirm the presence of buying flow.

This retrace was never weakness — it was refinementDOGE delivered the exact narrative I’ve come to expect from algorithmic flow on the low timeframes. This wasn’t about volatility. This was about cleanup.
The play:
After the initial spike, price formed a visible FVG and retraced into the 0.5–0.618 fib zone. That’s not random — that’s rebalancing. Not only did we see a fade into the midpoint, but volume increased into the dip, not out of it.
What this does is simple: it clears out early longs, taps deeper liquidity, and prepares for re-delivery — all while structure remains intact.
Expectation:
Two paths are mapped — both favoring upside:
Ideal scenario: sweep 0.618 or 0.786 (down to 0.1726) → quick rejection → rally back into the FVG and above
Conservative: hold above 0.1761 fib (0.5) and slowly grind into 0.1795
Final target remains the inefficiency fill near 0.1825
Risk profile:
Entry: 0.174–0.176 zone
Invalidation: below 0.169
TP1: 0.1795
TP2: 0.1825
I’m not interested in chasing. I’m interested in absorption. This is where smart entries are born — deep in discount, backed by displacement.
Final word:
“If you can’t see the intention behind the pullback, you’re not trading Smart Money — you’re reacting to it.”

DOGEUSDT BINANCE:DOGEUSDT Price is ranging between 0.18200 and 0.18650 dollars after a sharp rise from 0.17000. A break above 0.186 triggers a buy, targeting 0.19450 and 0.19950 dollars. A break below 0.182 triggers a sell, with supports at 0.17650 and 0.17000 dollars.
Trigger Levels:
Buy Trigger: 0.186
Sell Trigger: 0.182
⚠️Contorl Risk management for trades.

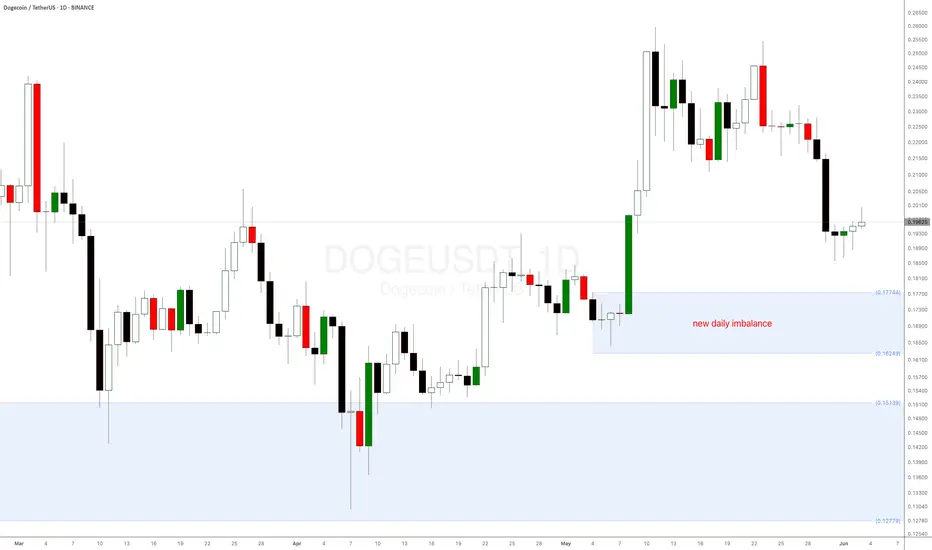
How to Spot the Perfect Dogecoin Buy Signal!Dogecoin (DOGE) is showing another major bullish signal!
After bouncing from the key weekly demand level at $0.151 mentioned in a previous supply and demand crypto analysis, DOGE coin is now approaching a new daily demand imbalance at $0.18035—a level where buyers have historically stepped in aggressively.
Why This Matters:
Strong Reaction Expected: Similar imbalances on other altcoins have led to sharp upward moves.
Long-term weekly imbalance: The weekly demand level is playing out very well.
Dogecoin (DOGE), the world’s favourite meme cryptocurrency, is trying to reach a critical weekly demand level at $0.151—its strongest daily demand zone in a long time! This presents a prime buying opportunity, especially for crypto beginners looking to enter the market.
Check the previous DOGE analysis from a few weeks ago.
DOGE Analysis (4H)It appears that Dogecoin's correction has started from the point where we placed the red arrow on the chart. This correction seems to be a flat pattern, with the first two parts forming a diametric and a triangle.
If the price reaches the green zone | which is a key area | we can start looking for buy/long positions.
Targets : 0.23092 _ 0.25283 _ 0.29426 _ 0.32217
A daily candle closing below the invalidation level will invalidate this analysis.
For risk management, please don't forget stop loss and capital management
Comment if you have any questions
Thank You

DOGE About to Explode? Key Levels to Watch!Yello, Paradisers! Are you watching #DOGE closely? Because a breakout is forming right in front of our eyes, and most traders won’t be ready for it.
💎After completing a clean ABC correction, DOGE formed an inverse head and shoulders pattern which is a classic bottom structure that has already initiated its breakout with a strong first push from the bulls. This was a major shift in sentiment, and momentum is clearly shifting in favor of buyers.
💎#DOGEUSDT is currently forming a bullish flag patten, a consolidation pattern that signals continuation rather than exhaustion. This ongoing flag has held firm over the past few days, and price is now coiling tighter, indicating that a fresh breakout is nearing. If the bulls maintain control, the next leg higher is about to be triggered.
💎The critical level to watch is $0.2325. A clean break above this resistance would activate the next impulse move, opening the door toward $0.250 as the first target, followed by $0.2620. That is where some profit-taking is likely to occur, but as long as bulls hold momentum, the rally is unlikely to stop there.
💎The full target of the bull flag formation extends into the $0.300–$0.3200 region. This area is not just a technical objective rather it’s also a strong horizontal resistance zone and aligns with the 61.8% Fibonacci retracement level from the previous move down. This convergence makes it a high-risk, high-reward area and a critical decision point for the market.
💎DOGE remains technically supported at the $0.2100 level, which has proven resilient during short-term pullbacks. Below that, both the EMA-200 and EMA-50 are providing additional support. These two moving averages are on the verge of forming a golden cross — one of the strongest signals in trend continuation analysis, reinforcing the medium-term bullish outlook.
Paradisers, strive for consistency, not quick profits. Treat the market as a businessman, not as a gambler.
MyCryptoParadise
iFeel the success🌴

Is It "GO" Time for $DOGE Dominance to Flippen BTC?Been talking about this for a while.
Early, but not wrong.
Remember: nothing ever moves in a straight line except c0caine- and even then, only if you're a degenerate.
But enough about my theory- this market is breaking a lot of old "ObViOuS" patterns, because they never repeat perfectly.
What do YOU think is going on here?
Is it actually GO time?

Dogecoin 🚨 Dogecoin at a turning point!
💰 Price is hovering around 0.15842 dollars, moving within a symmetrical triangle. Right at the intersection of dynamic resistance and a descending trendline 📉. A breakout above 0.16643 dollars could pave the way for a rally toward 0.17830 and even 0.19401 dollars 🚀
But if sellers take control and price gets rejected 🔻, supports at 0.14632 and 0.13850 dollars come into play. Further pressure could push it down to the key support at 0.12980 dollars.
📊 With tightening price action and approaching the triangle’s apex, a breakout in the coming days seems likely. The big question: who’s in charge — buyers or sellers? 🤔
📈 Breaking 0.16643 = buyer strength
📉 Rejection = seller dominance

Dogecoin Breakout Alert: Is a Major Recovery Rally Starting Now?Dogecoin on the Cusp? Analyzing the Potential Breakout and Path to Recovery
Dogecoin (DOGE), the original meme coin that captured the world's attention with its Shiba Inu mascot and community-driven rallies, is once again stirring excitement in the cryptocurrency markets. After a period of consolidation and navigating broader market volatility, DOGE is showing signs of life, prompting speculation about whether a significant upside move could be on the horizon, potentially leading to a more sustained recovery. Recent price action, technical indicators, and optimistic trader sentiment are converging, painting a picture of a coin potentially coiling for its next big move.
Finding Footing: The Bounce from $0.1500
The foundation for the current optimism was laid when Dogecoin successfully defended the $0.1500 support zone against the US Dollar. In volatile markets, establishing clear support levels is crucial. Holding above $0.1500 demonstrated resilience and provided a base from which buyers could initiate a fresh push upwards. Following this defense, DOGE began a "decent upward move," managing to climb above the $0.1550 level.
This initial climb is significant because it signals a shift from purely defensive price action to potentially offensive momentum. Buyers stepped in at a key psychological and technical level, absorbing selling pressure and turning the tide, at least in the short term. The ability to not only hold support but to initiate a bounce suggests underlying demand and interest returning to the meme coin.
Consolidation and Key Technical Signals
Currently, Dogecoin appears to be in a consolidation phase, trading above the $0.1580 level. Consolidation after an upward move is often viewed constructively by technical analysts. It can represent a period where the market digests recent gains, shakes out weak hands, and builds energy for the next directional leg. The key question during consolidation is whether it resolves upwards (a continuation of the prior move) or downwards.
Several technical indicators are lending credence to the bullish case during this consolidation:
1. Trading Above the 100-Hourly Simple Moving Average (SMA): The price remaining above this key short-term moving average is generally considered a bullish sign on hourly charts. It indicates that the average price over the recent past is trending upwards, and the current price is maintaining strength relative to that average. It often acts as dynamic support during pullbacks within an uptrend.
2. Bullish Trend Line: The formation of a short-term bullish trend line with support currently identified around $0.1590 on the hourly DOGE/USD chart is another positive signal. This ascending line connects recent lows and visually represents the current upward trajectory. As long as the price stays above this trend line, the immediate bullish structure remains intact. It provides traders with a clear reference point for potential entry or stop-loss levels.
These technical factors suggest that despite the consolidation, the underlying momentum favors the bulls in the immediate term. The market structure is building higher lows, supported by the trend line and the moving average.
The Resistance Hurdle and Breakout Potential
While the support and short-term indicators are encouraging, the true test for Dogecoin lies in overcoming resistance. The immediate significant hurdle identified is the $0.1650 level. A decisive break and close above this resistance zone would be a strong technical signal, potentially confirming the end of the consolidation phase and the beginning of a more substantial rally. Breaking resistance often triggers further buying activity, including stop-loss orders from short sellers and new entries from breakout traders.
Beyond $0.1650, the next major target highlighted is the $0.2050 resistance zone. Clearing this level would represent a more significant milestone, potentially putting Dogecoin firmly back on the path towards higher valuations seen earlier in the cycle. A move towards $0.2050 would likely require sustained buying pressure and positive sentiment across the broader crypto market.
Trader Sentiment and Bold Predictions
Adding fuel to the speculative fire are optimistic predictions from market participants. Notably, one trader, who reportedly "nailed" a previous 300% rally in Dogecoin, is suggesting that history might be about to repeat itself. While such predictions should always be taken with caution, they reflect a growing bullish sentiment within certain segments of the trading community. These forecasts often rely on pattern recognition, fractal analysis (comparing current price structures to historical ones), and sentiment indicators.
Furthermore, bullish signals are reportedly pointing towards a potential "pump," with some analysts setting longer-term price targets as high as $0.28. Achieving such a target would represent a significant recovery and substantial gains from current levels. This level likely corresponds to previous key resistance or Fibonacci extension levels, representing areas where traders anticipate strong price reactions.
Why the Optimism? Potential Catalysts
Several factors could be contributing to this renewed optimism:
• Broader Market Recovery: Cryptocurrencies often move in tandem, especially Bitcoin and major altcoins. If Bitcoin continues its strength or embarks on a new leg up, it often lifts sentiment across the market, benefiting coins like Dogecoin.
• Meme Coin Season: Historically, periods of market exuberance have seen "meme coin seasons" where highly speculative, community-driven tokens experience outsized gains. Renewed interest in this sector could benefit its leading token, DOGE.
• Community Engagement: Dogecoin boasts one of the most active and vocal communities in crypto. Social media hype and coordinated community efforts can significantly impact its price, especially during positive market conditions.
• Technical Setup: As outlined above, the technical picture (holding support, bullish trend line, potential breakout from consolidation) provides a logical basis for traders anticipating an upward move.
Risks and Considerations
Despite the bullish signals and optimistic forecasts, investing in Dogecoin remains inherently risky and speculative:
• Volatility: DOGE is known for its extreme price swings. Gains can be rapid, but losses can be equally swift.
• Resistance is Real: Failure to break decisively above $0.1650 or $0.2050 could lead to a rejection and a move back down to test support levels, potentially invalidating the bullish setup.
• Market Dependence: A downturn in Bitcoin or the broader crypto market could easily drag Dogecoin down, regardless of its individual technical setup.
• Hype-Driven: Price action can be heavily influenced by social media trends, celebrity endorsements (like those historically from Elon Musk), and general market sentiment, which can change rapidly and unpredictably.
Conclusion: Poised for Potential, Confirmation Needed
Dogecoin currently stands at an intriguing juncture. It has established a solid base of support, initiated an upward move, and is consolidating above key short-term indicators, supported by a bullish trend line. Optimistic traders are eyeing significant upside potential, with targets ranging from $0.1650 and $0.2050 to as high as $0.28, fueled by predictions of repeating past explosive rallies.
However, potential does not guarantee performance. The immediate challenge is converting the current consolidation into a confirmed breakout above the $0.1650 resistance. A successful breach could indeed ignite further buying pressure and set the stage for a move towards $0.2050 and potentially higher, sparking the "full-on recovery" bulls are hoping for. Conversely, failure to overcome resistance could see momentum wane.
For traders and investors, the current situation demands careful monitoring of key levels. While the technical signals lean bullish in the short term, Dogecoin's inherent volatility and sensitivity to broader market conditions necessitate cautious optimism and robust risk management. Whether DOGE is truly about to repeat history remains to be seen, but the current setup has certainly put the beloved meme coin back in the spotlight.

DOGE Will Show Relief Rally Before CrashHello, Skyrexians!
Yesterday we pointed out that Ethereum has not finished the global correction and is waiting for crush, today we found the same pattern for BINANCE:DOGEUSDT . We still have some space to go up, but finally we will see another one drop to new lows.
Let's take a look at the daily chart. Here we can see the potential Elliott waves counting. Recent dip was the wave 3, not a wave 5 because of awesome oscillator. It has not crossed the zero line which means that wave 4 has not been completed. Green dot on the bottom on the Bullish/Bearish Reversal Bar Indicator does not mean the global reversal, it's only the end of the wave 3. Target area for wave 4 is 0.38-0.5 Fibonacci. If there we will see the red dot, it can be great short opportunity. Target for DOGE wave 5 is very low, it can be even lower than $0.1.
Best regards,
Skyrexio Team
___________________________________________________________
Please, boost this article and subscribe our page if you like analysis!

Dogecoin Foundation Bolsters Reserves with 10M Token Purchase
The Dogecoin Foundation, the non-profit organization dedicated to the development and advocacy of Dogecoin (DOGE), has made a significant move by purchasing 10 million DOGE tokens.1 This strategic acquisition, part of a broader initiative to establish a robust DOGE reserve, signals the Foundation's commitment to the long-term sustainability and growth of the meme-turned-cryptocurrency.2 The purchase coincides with a notable price surge, as traders weigh potential shifts in US tariff and Federal Reserve policies, fueling speculation about Dogecoin's future trajectory.3
In February, the Dogecoin Foundation announced a five-year partnership with House of Doge, designating them as its official commercialization partner.4 This collaboration aims to enhance Dogecoin's utility and adoption by exploring innovative applications and fostering strategic partnerships.5 The establishment of a DOGE reserve, now augmented by the 10 million token purchase, appears to be a crucial component of this broader strategy, intended to provide financial stability and support future development initiatives.6
The purchase reflects a proactive approach by the Foundation to manage Dogecoin's ecosystem. By building a reserve, the Foundation can potentially fund future projects, support community initiatives, and mitigate potential market volatility.7 This move underscores the Foundation's commitment to ensuring Dogecoin's long-term viability, moving beyond its meme origins to establish a more structured and sustainable framework.
Simultaneously, the cryptocurrency market has witnessed a resurgence of interest in Dogecoin, with its price jumping by approximately 7% in a single day.8 This surge is attributed to a confluence of factors, including speculation that upcoming US tariffs might be less severe than initially anticipated. Traders are also closely monitoring potential shifts in Federal Reserve policies, which could impact the broader cryptocurrency market.9
The renewed optimism surrounding Dogecoin has led to its outperformance against major cryptocurrencies like Bitcoin (BTC), Solana (SOL), and XRP.10 This surge in interest highlights the enduring appeal of meme coins, which often experience significant price fluctuations driven by social media sentiment and speculative trading.11
Dogecoin's Bullish Momentum: Analyst Predicts Surge to $0.4
Technical analysis indicates that Dogecoin has recently broken above a bullish daily pattern, further fueling optimism among traders.12 This breakout suggests a potential upward trend, with analysts predicting a possible surge to $0.4.13 The bullish pattern, often characterized by a series of higher lows and higher highs, signals increased buying pressure and a shift in market sentiment.
The $0.4 target represents a significant milestone for Dogecoin, potentially marking a substantial increase from its current price. This prediction is based on technical indicators and historical price action, which suggest that a breakout from the current pattern could lead to a sustained upward trend.
Analysts emphasize the importance of monitoring key support and resistance levels. A sustained break above the current resistance could validate the bullish prediction, while a failure to maintain momentum could lead to a price correction. The volatile nature of the cryptocurrency market necessitates a cautious approach, as unexpected developments can significantly impact price movements.14
The confluence of factors, including the Dogecoin Foundation's token purchase, the potential easing of US tariffs, and the bullish technical analysis, has created a perfect storm for Dogecoin. The surge in trading volume and increased social media activity further amplify the bullish sentiment, contributing to the overall market optimism.15
However, it's crucial to acknowledge the inherent risks associated with cryptocurrency trading. The market is highly volatile, and price predictions are subject to significant uncertainty.16 While the current momentum appears promising, unexpected news or market corrections could quickly reverse the trend.
Will Dogecoin Reach $1? The Speculative Frenzy
The question on many traders' minds is whether Dogecoin can reach the coveted $1 mark. This milestone, once considered a distant dream, now seems within reach for some optimistic investors. The recent price surge and positive market sentiment have reignited speculation about Dogecoin's potential to achieve this target.
Achieving $1 would represent a significant increase from Dogecoin's current price, requiring a substantial influx of capital and sustained buying pressure.17 The cryptocurrency market is known for its rapid and unpredictable price swings, making such predictions inherently speculative.18
The Dogecoin community, known for its enthusiastic support and social media prowess, plays a crucial role in driving price movements.19 The power of social media and online communities to influence market sentiment cannot be underestimated, particularly in the case of meme coins like Dogecoin.20
However, fundamental factors, such as adoption rates, technological developments, and regulatory clarity, will ultimately determine Dogecoin's long-term success. The Dogecoin Foundation's efforts to enhance the cryptocurrency's utility and establish a stable ecosystem are crucial steps in this direction.21
The partnership with House of Doge and the establishment of a DOGE reserve demonstrate a commitment to building a more sustainable and functional cryptocurrency. These initiatives aim to move beyond the meme-driven hype and establish a solid foundation for long-term growth.
In conclusion, the Dogecoin Foundation's purchase of 10 million tokens, coupled with positive market sentiment and bullish technical indicators, has created a wave of optimism.22 While the $1 target remains speculative, the recent developments suggest that Dogecoin is experiencing a resurgence of interest and potential for further growth.
Traders should remain vigilant and exercise caution, as the cryptocurrency market is inherently volatile.23 The blend of community, development, and market conditions all contribute to the current and future potential of Dogecoin.


DOGE reng?🚀 Uptrend Breakout Zone
The chart shows a strong bullish breakout above the resistance level of $0.20812 and a retest of the support trendline. The upward move reached $0.38664, forming a new high. 📈
🔻 Correction Phase
A sharp drop from the $0.38664 level indicates profit-taking or potential bearish divergence. The price is approaching the highlighted $0.20357 zone, marked as a key support area. 🔴
📉 Short-term Bearish Trend
If the price breaks below $0.20357, further declines toward $0.11664 are possible. Traders should watch for a bullish signal (e.g., green candles) at these levels. 🛑
💡 Long-term Prediction
A potential cup-and-handle pattern formation is visible, suggesting a gradual recovery and a bullish reversal back toward $0.38823. 📈 Look for a breakout above this resistance level for confirmation.
📢 Trading Signals
✅ Buy Zone: Near $0.20357, if bullish candles appear. Target: $0.33000 to $0.38823.
❌ Sell Signal: If price closes below $0.20357, target lower support at $0.11664.
🚀 Long-term Buy: After a confirmed breakout above $0.38823.
📊 Risk Management: Use stop-loss orders to protect against unexpected moves below key levels. ⛔

DOGE📉 Price Trend: The price is currently trending downwards, as shown by the lower highs and the recent dip.
📊 Resistance Levels:
🔴 Strong resistance at 0.47 - 0.59.
🟪 Medium resistance near 0.39 - 0.43.
📈 Key Levels to Watch:
🟩 Current price is 0.33, hovering near a critical level of support.
🟢 Potential supports at 0.2673 and 0.2091.
🚨 Break below 0.2091 could lead to further downside, testing the 0.18 - 0.15 range.
📌 Targets:
🎯 Upside: 0.39, 0.43, and 0.47 as potential take-profit levels.
🔻 Downside: Watch 0.2673 and 0.2091 for buy zones or further consolidation.
🔥 Momentum: Mixed; recent dip suggests weakness, but support zones could trigger recovery.

PUMP to 2$This chart displays a bullish outlook for DOGE/USD on the weekly timeframe. The current price is $0.33, with an EMA (50) at $0.19 signaling a strong uptrend 📊. The chart suggests a key support zone around $0.20, ideal for entries 📉, and targets an ambitious price of $2.06, indicating potential growth of over 500% 🚀. A descending wedge breakout and higher lows support the bullish thesis 📈. The RSI is at 67.35, close to overbought, hinting at momentum but also a need for caution ⚠️. A pullback near $0.20 could provide better risk-reward entry opportunities.

Dogecoin ABC correction entering final phaseI made a fresh clean chart for you to see the obvious.
1 Fibonacci Retracement of the 5th wave from 8 cent to 48.5 cent
2 Fibonacci Retracement from the bottom wick of the A wave to the top wick of the B wave
3 Date & Price Range measuring the A wave and one for the expected C wave both showing us -46% & 12 days
4 Orange Trendline you have seen also in the previous which sits on the top of the 3rd wave.
5 Green Trendlines x4
6 Notice the volume to the left we have a nice green volume when we pumped the 5th wave and to the right we have a nice red volume increasing
7 VWAP indicator also confirming our targets are legit!
Conclusion:
If we drop from here exactly the 46% like we did on the A wave we will perfectly hit our targets between the 0.618 of wave 5 and the 1.272 of the B wave plus support from the Orange Trendline
The last drop lasted 12 days and if the next one should also last around 12 days then time is running out and it might drop in the next 5 days before the upcoming monthly close and might be already finding bottom by then.
We most likely have some reactions on the way down when we reach the 0.786 also green line and the 1 Fib.
If you have not see the previous Idea (Editor Pick) please have a look at it here:

Dogecoin at Key Support: Trend Analysis & Next Moves for DOGE👀 👉 In this video, we dive deep into Dogecoin (DOGE) paired with USDT, examining its trend, market structure, price action, key support and resistance levels, and the impact of liquidity on the markets. At the moment, DOGE is trading near a critical support level. With the bearish break in market structure, we explore potential ways to engage if the downtrend persists. Everything is covered in detail here. Please note, this is not financial advice.

DOGE Analysis: Unpacking Liquidity & the Battle at Support👀 👉 In this video, we take an in-depth look at Dogecoin (DOGE) paired with USDT. We analyze the trend, market structure, price action, key support and resistance levels, and the role liquidity plays in the markets. Currently, DOGE is trading at a significant support level. On the daily timeframe, there's a case for higher highs and higher lows, while the weekly chart shows bearish pressure over the past week. The big question is: where does it go next? We unpack it all in this video. This is not financial advice.
