doge lagging after market recovery.doge lagging after market recovery.
doge lagging after market recovery.
doge lagging after market recovery.
doge lagging after market recovery.
doge lagging after market recovery.
doge lagging after market recovery.
doge lagging after market recovery.
doge lagging after market recovery.
Maybe Elon tweets and you'll earn some hard earned money, he also said something about a merchstore that will accept doge and btc payments.
DOGEBTC

Early hints of trend reversal!DOGE has been struggling against BTC for several months, but sellers are exhausted. I'm seeing bullish divergence on the daily chart and we're in an extended Falling Wedge. A breakout of this wedge could be explosive. Keep an eye on DOGE in the next couple weeks. I'm interested in averaging in here.
--------------------------------------------
These are my personal views and not financial advice. Please do your own research before investing.
I'd love to hear your thoughts, ideas and feedback. Feel free to comment and I'll try and get back to you quickly.
If you appreciated this analysis, consider Liking or Following. Thanks!

DOGE -39.50% Volume in the last 24hDogecoin is sitting at a fragile support with a substantial decrease in volume in the last 24h: -39.50%
if we continue like that there is a threat to see it drop to the 0.10usd support.
there is a volume gap between the actual price and the next support level.

DOGE A lot of price fluctuations and trying to defend the price The 7 days chart shows that doge is gradually rising, there are some worrying fluctuations in the price during this time, but the main trend looks solid and unidirectional, a lot will depend on BTC and the impact it will have, with a large increase in BTC, DOGE will gain a lot

DOGEUSDT | The best target for correction♻️Hello traders, Dogecoin in daily timeframe , this analysis has been prepared in daily timeframe but has been published for a better view in 2 day timeframe.
In the count we had, the main waves 1, 2 and 3 were completed.
You checked wave 4 and from wave 4 we are sure that wave a is complete.
But we still have doubts about wave b because it is not normal in terms of time.
Preferably we counted wave b as finished and now we are waiting for wave c movements.
At times lower than wave c, waves 1,2,3 are completed, and based on new observations, we think we are inside wave 4, and the other two waves will probably remain to be completed, and then we will have a climb for wave 5.
This wave count should be revised if the warning signal range is broken upwards.
🙏If you have an idea that helps me provide a better analysis, I will be happy to write in the comments🙏
❤️Please, support this idea with a like and comment!❤️

DOGEUSDT-SHORTThere is a short position in DOGEUSDT Dogecoin
DOGEUSDT Dogecoin
🔴Short Now or set on Key Level 0.1835
🟢Target 1 0.1735
🟢Target 2 0.1635
❌Stop loss 0.1870
#K_Level
Please support our activity with your likes and comments.

DOGEUSDT IN BEARISH SCENARIO SO STRONGDOGE/USDT
Doge in bearish scenario
Still not good for DOGE
That my outlook
Hope you get something from my IDEAS
Thanks!
#tipsfortradingplanning


DOGE - Daily Chart ✅Let's see how DOGE is behaving.
This is a 1H chart. (Valid for 24 hours)
The Fib retracement shows that the price has consolidated and did a small pump.
The market is showing NEUTRAL volumes for DOGE.
Two resistance levels push down on value, and two support levels hold the price high and show strength.
The Middle Bollinger Band supports the value and helps it go back up.
If the price crosses the local resistance and stays above it for confirmation, we can open our long positions, aim for the next resistance, and use it as a TP point.
The RSI shows that DOGE is above the 50 levels, the center. It's coming back down.
If you want to know how the RSI indicator works, take a look at this Educational Idea. It'll help you have better readings:
Current Market Price: $0.1914
Let me know your ideas.
Good luck.

DOGE COIN LONGS 💰💰💰Expect bullish price action from this area on DOGECOIN as price takes out liquidity below 0.18000 the lowest part of the range/accumulation phase of the coin and also closed a d1 bullish imbalance that signs a potential reversal bullish for the coin.
What do you think ? Comment below..

dogeusdt ANALYSIS👑 ̲F̲X̲o̲n̲e̲4̲a̲l̲l̲ 👑 VIP 🚀🚀,
🟢 #DOGE - USDT 🔚BINANCE
💰 Buy now : 0.19 / 0.17
🔸TARGET 🎯
🔹0.31
🔹 0.41

DOGEUSDT-LONGThere is a long position in DOGEUSDT Dogecoin
DOGEUSDT Dogecoin
🔵Long Now or set on Key Level 0.1785
🟢Target 1 0.1950
❌Stop loss 0.1745
#K_Level

DOGE New Rally ...Take position after breakout and closing candle.
It's just for education.
I will be happy to use your comments.

DOGEUSDT - Enjoy 🚀🚀🚀 Follow me, its good IDEA :)
Now DOGE are inside of triangle, this is good time for a scalping but we need to be careful and wait strong trend.
Please share your opinion in the comments !!!
This is not financial advice !!!

DOGEI expect a burst to the 0.26 level and again a correction below $ 0.2. I fix the profit at $ 0.26.
Subscribe to the channel, fresh signals every day.

Doge Intensifies. Getting ready for Doge #1 to the Moon?Successful traders spend 90% of their time waiting.
Could it be the wait is over? Is it time yet?
I think so! At least around the corner.
Doge weekly is going to print bullish divergence soon and is targeting 0.87 minimum
here you see the bullish divergence on the daily.. the wick from yesterday has touched the bottom Bollinger Bands making a lower low in price yet the oscilators RSI and MACD showing a higher high.. so i expect a big move up latest by monday
same thing on the BTC pair
the daily confirmed and weekly should confirm tomorrow night at weekly close USD
BTC
now volume should pick up soon.
----------------------------------
Trading is an IQ game.
Until you realize the real winner is the one who can dominate fear and greed, not the smartest.
Trading is a psychological war against your emotions.
Money is a universal means of exchanging time, energy, and information.
Fiat currency is a false idol.
#Bitcoin is honest money.
#Dogecoin is funny money!


DOGE - Daily Chart ✅Let's see how DOGE is behaving.
This is a 4H chart.
The Fib retracement shows that the price has been consolidating since the last dump between the support and resistance range.
The market is showing SELL volumes for DOGE.
This time, three resistance levels push down on value. Two of which are local, and one is the solid resistance. And one support level holds the price high and shows strength.
This local support is our last hope to turn the market into bullish. If the price drops lower than that, we will have to fight more strong resistance levels on the solid support.
The RSI shows that DOGE is under the 50 levels, the center. And going near the upper half might be a good sign for DOGE. We will have a short-term bullish run if we confirm a price above the 50 RSI.
If you want to know how the RSI indicator works, take a look at this Educational Idea. It'll help you have better readings:
Current Market Price: $0.1723
Let me know your ideas.
Good luck.

DOGE slight decrease and stabilizationdoge fell from 0.19 to 0.17 and defends the price level, the green candle is a good sign and shows that the situation is stabilizing

DOGE chart will be LTC chart soonDOGE chart will be LTC chart soon.. check the LTC chart i posted and start packing your LTC bags.. sorry for DOGE fans for using it as example..

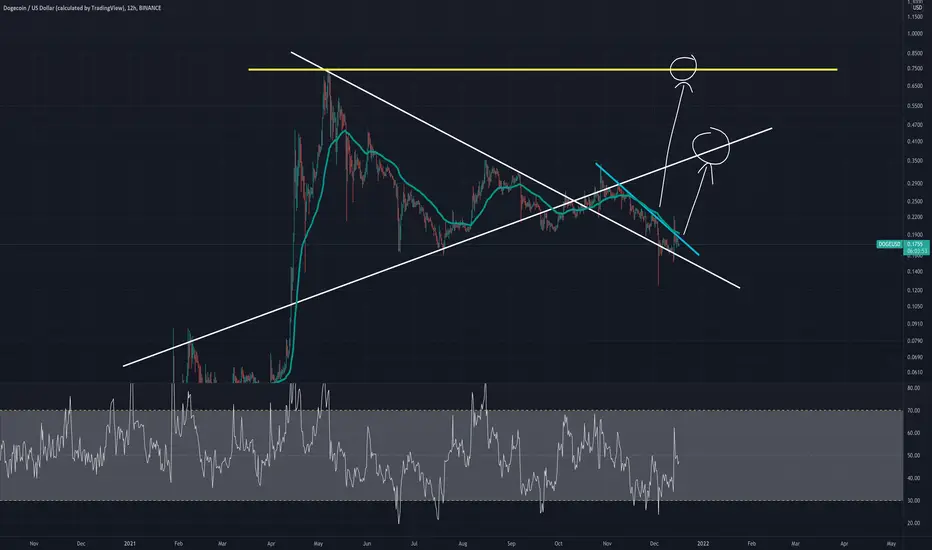
Dogecoin - Bullish For December & JanuaryThe two white lines have been acting as resistance and support at different times. The key price targets will be the upward trending white line (which has been acting as resistance in the short term) and the yellow line (the previous all time high for DOGE).
Sometimes in life things don't need to make sense Doge to $1.35?Just an idea, at this point this coin has utility and fees are extremely low compared to ETH somewhat making this a interesting opportunity. Regardless of if things make sense or not, if you think Bitcoin will go to $200-300k then every other coin will follow it its just how the market goes. If there is another run that peaks in may around 100k or 150k then I don't see why Doge doesn't surpass its ATH and hits 1.35, its all dependent on BTC. NOT FINANCIAL ADVICE, I like turtles.

DOGE strong price positionDOGE has huge support from Elon Musk, other meme coins have only community, DOGE in long term is much safer for hodlers than other meme coins
