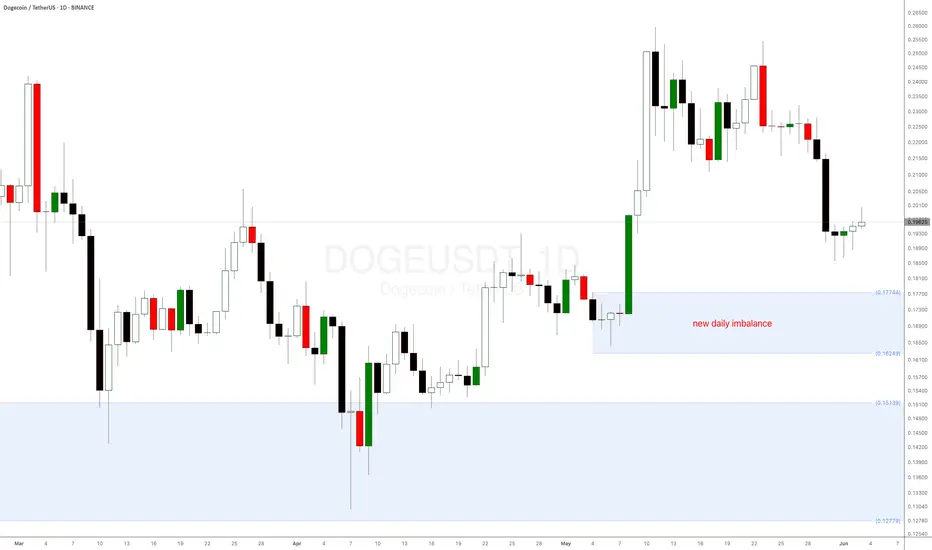
How to Spot the Perfect Dogecoin Buy Signal!Dogecoin (DOGE) is showing another major bullish signal!
After bouncing from the key weekly demand level at $0.151 mentioned in a previous supply and demand crypto analysis, DOGE coin is now approaching a new daily demand imbalance at $0.18035—a level where buyers have historically stepped in aggressively.
Why This Matters:
Strong Reaction Expected: Similar imbalances on other altcoins have led to sharp upward moves.
Long-term weekly imbalance: The weekly demand level is playing out very well.
Dogecoin (DOGE), the world’s favourite meme cryptocurrency, is trying to reach a critical weekly demand level at $0.151—its strongest daily demand zone in a long time! This presents a prime buying opportunity, especially for crypto beginners looking to enter the market.
Check the previous DOGE analysis from a few weeks ago.
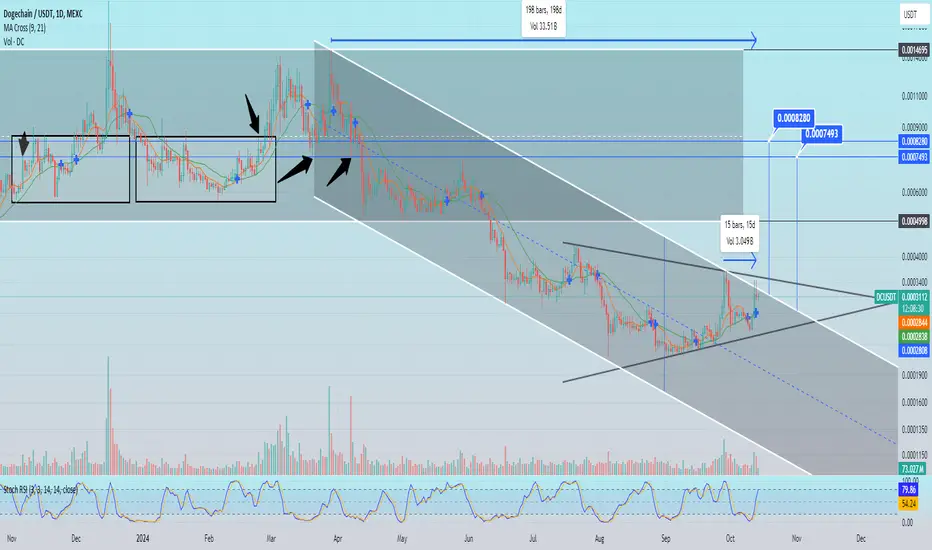
Dogechain
DogechainDc usdt Daily analysis
Time frame 4hours
Risk rewards ratio >3 👈👌
Here is a very good time to entrance and cache decisions big fish in short-term

OMNOM. What's next?Sellers' strength is running out and the price tests the moving average twice in 105 days of downtrend. The asset is completely oversold, as is probably the case with many things on the market now.

DC. Descending channel.Imo this descending channel is key to determining AMEX:DC trend as a whole. You can accumulate here, you can wait for probable price exit to trade breakout point. From here there can be both the lowest values and the highest. Market is not predictable at the moment.

OMNOM. Gud fluctuation.Awesome $OMNOM fluctuation, dear sirs. Locally, the price will overcome another 15% up, preparing the ground for a medium-term breakout of the downtrend.

OMNOM. Bullish Pin Bar/Hammer.If CRYPTOCAP:BTC don't highly dumping, $OMNOM could return to trading range within a few weeks breaking a three-month downtrend which is about 70% . Return to the previous local high is 1,100% . Also, we can interpret this candle as a Bullish Pin Bar with some consolidation or a Hammer. Here, sellers could lose control over the price and there is a high probability that we will see a trend change.

OMNOM. No fear, accumulate.$OMNOM price has been moving in a local descending channel for 84 days and recent dump brought almost to support, immediately bouncing back 67% and currently moving in the middle of the channel. Possible local rebound target is 800% higher than the current price.

OMNOM. Bifurcation point. Time to buy for moonshot.If we take $OMNOM time periods - distribution cycle is currently going and probable peak in fall of '25. Price has fallen more than 90% from March '24. Several big wallets have $TRUMP fomo, so there's plenty LP to form a big position without any moving. Do it before it's too late

OMNOM. SHIB Killer.Probable OMNOM bullish pennant formation chart implies an x187 up. Preliminary local growth could be 296% - to the resistance. Also, given valid of global ascending channel - bullish pennant breakout will coincide with a channel breakout on x10,000

DC. Parabola with moon target.Bullish flag on daily candles with $0.00089 target. Medium term move will mark the beginning of impressive trend.

DC. Playbook. Having broken through the triangle, the price went up exactly to the height of the pattern. Now we are testing global descending channel, which was broken. Please note that testing and price correction occurs against the background of oversold by RSI. Considering the beginning of the bull market and the mass excitement of retail for DOGE, I want to say that this is an ultra-bullish situation and in addition to holding the asset, I would prefer to accumulate more.

DC. Before I wake.Assuming that DC is completing a bullish consolidation, it is reasonable to extrapolate the expected growth. In my opinion, the price will not reach the lower boundary of the triangle, but will systematically trade higher and test the resistance level.

DC. $0.0014 price target.The falling wedge, as one of the basic patterns for this chart, is an excellent indicator of where the price will go in the medium term. Also, I noted potential trading levels, which in turn are resistance and, in the case of a bullrun and continuation of the upward trend, will be support levels.

DC. Patterns in price action.Quite an accurate test of the descending channel after breakout. Pay attention to the moving averages and probable price action. The patterns in price action may be similar. DC is on the cusp of global growth.

DC. Parabola?If you look closely, you can see a parabola forming here, originating from $0.000215 level. Probable level of the parabola top may be equal to the height of the channel - that is, the level to which the price will reach upon breaking through descending channel. Again, the price has touched the level of June prices. This means that we have a sideways trend for 140 days and those who accumulate in it are buying the bottom.

DC. Growth potential x10 in 8 days.If we extrapolate the historical chart to the present time, we can assume that asset is capable of experiencing a similar upward movement. Given the bull market factor and ratio of assets in liquidity pools on decentralized exchanges, x10 may only be the beginning of global growth.

DC. Hold your bags. We are moving.Get ready for the uptrend to continue. From current candle high, the price has made 300% up in 56 days if you looking back. Hold your bags. Prepare for volatility. We are moving.

DC. Several patterns indicates moon.Descending global channel, which has been the main one in the trend formation for the last six months, has been broken. Now, based on several patterns, we can assume that the trend is broken and the moon will coming soon. Potential formation of a golden cross, equilateral triangle, a descending wedge - will probably throw the price above all trading levels. Get ready, accumulate more.

DC. Soon.Price tests moving average for the first time in over half a year + buying volume is at its best in 8 months. If market trend continues, the result of testing the upper line of the triangle will be pattern breakout and an upward move to $0.0008

DC. Everything new is a well-forgotten old.The global descending channel formed in April is currently under pressure. The price has been testing the resistance line for two weeks. The potential breakout looks interesting for two reasons:
1. The price target of the channel breakout with a probable time lag, which is due to the formation of an equilateral triangle, curiously coincides with reference points from more than six months ago.
2. The price target of the channel breakout with a probable time lag, which is due to the formation of an equilateral triangle, curiously coincides with the trading area from more than six months ago.
DC. Reversed Head and Shoulders.The potential formation of the "Inverted Head and Shoulders" pattern indicates a local trend change is coming. Considering all my previous ideas and considering what the chart says - a change in the global trend is coming. Structures are being built, structures in the plural, which together can create a bullish trend. And in my subjective view, the trend can be impressive.

DC. Potential Cup and Handle with 775% gain.Here it is important to initially pay attention to moving averages and fact that the price has taken hold above the long-term moving average for the first time more than half a year. The price is potentially forming a Cup and Handle pattern on a two-year downtrend. Moon soon.

DC. Bottomed out.DC through the prism of the Fibonacci grid has a minimum 389% growth potential. If CRYPTOCAP:DOGE shake out the market again then all dogs-meme assets will spike hard. RSI is oversold on the monthly and weekly charts. Bottomed out.
