BTC/USD: More Bullish MOVE Ahead? (READ THE CAPTION)By analyzing the #Bitcoin chart on the weekly timeframe, we can see that the price has finally reached our expected level of $111,880, setting a new all-time high.
Currently, Bitcoin is trading around $110,800, and if it manages to hold above this key level, we could expect further bullish movement.
The next potential targets are $130,000 and $163,000, respectively.
Please support me with your likes and comments to motivate me to share more analysis with you and share your opinion about the possible trend of this chart with me !
Best Regards , Arman Shaban
Dogecoin

Dogecoin Bearish But...Yes, Dogecoin is bearish now but this is only a short-term situation, it is the end of a long-term correction. Notice the chart, Dogecoin has been producing lower highs long-term, since December 2024.
Recently, there was a major low in April and then a recovery and after this recovery we have local lower highs. The current drop is the continuation of the retrace that started 11-May. This retrace should end soon, within weeks or just a few days.
As soon as the low settles, we can enter the market bullish again. If you trade spot, simply wait. Day traders can easily SHORT but the range is short, after a small drop cover and switch back to LONG. Experts only.
That's the scenario. We are very likely to get a higher low compared to 7-April. If too many leveraged positions are open though and the market wants to remove those, there can be a long wick that pierces support for the action to recover the next day.
So, the drop can be fast, can be small, can be hard, can be easy or it can be short, it doesn't matter, once it is over, Dogecoin will continue to grow.
Patience is key.
Thanks a lot for your continued support.
Namaste.

DOGEUSDT BINANCE:DOGEUSDT Price is ranging between 0.18200 and 0.18650 dollars after a sharp rise from 0.17000. A break above 0.186 triggers a buy, targeting 0.19450 and 0.19950 dollars. A break below 0.182 triggers a sell, with supports at 0.17650 and 0.17000 dollars.
Trigger Levels:
Buy Trigger: 0.186
Sell Trigger: 0.182
⚠️Contorl Risk management for trades.

Doge Double Trouble $0.22 or $0.17 NextTwofer Doge . 10-15% move either way likely based on how bitcoin does.
Breakout
0.224
Breakdown
0.172
Decided to throw this chart together based on my original idea of the end to end cloud touch that is working out well.

Doge Rocket End to End Cloud MoveThe idea basis is simple.
1) Full M pattern target did not fully hit, look for resistance that can send it lower to complete it.
2) Found the Daily Cloud End to End Move where we go to the very top and reject straight back down to fill out the M
We also have an inverse h&S showing 0.207 target
Good Luck

DOGE | BULLISH Pattern | +100%DOGE is seemingly ready for more upside as we start to see a pattern resembling an inverse head and shoulders pattern:
✅Usually, the Inverse H&S plays out something like this:
📢But the pattern is not quite confirmed just yet. We'd need to see a close ABOVE the current resistance zone to validate the pattern:
If we can see that, it's likely that there can be BIG gains on DOGE. It will especially help if ETH makes more increases, showing that the general alt market is heading in the right direction.
____________________
BINANCE:DOGEUSDT

Doge(based on NEowave)like ETH wave E is ending and soon it will start a huge bullish wave.
wave E look likes a bow-tie diametrical and wave g is at the end which is the last chance to buy.

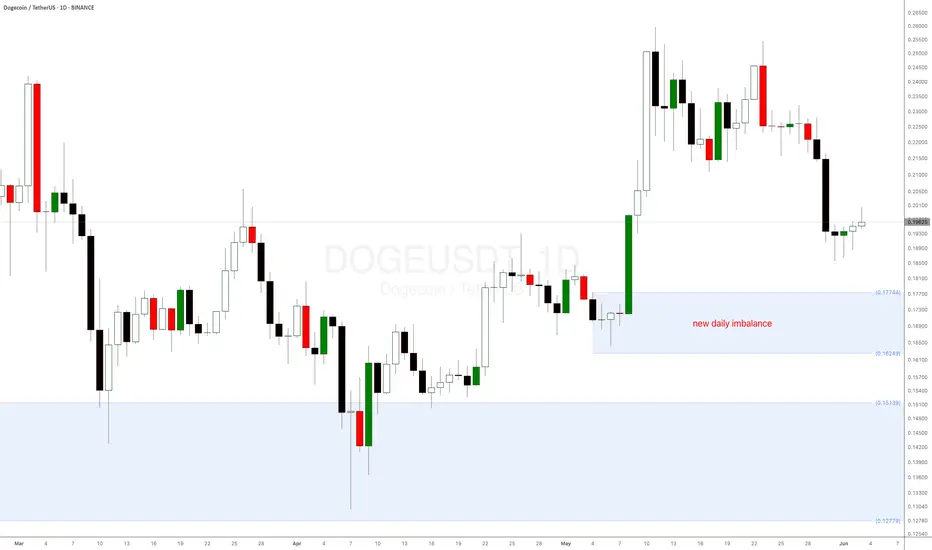
Doge Meme Coin daily demand level is playing out wellThe strong daily demand imbalance mentioned in a previous update is still in control and trying to play out as expected. Any long positions on this meme coin should be managed.

#DOGE/USDT#DOGE
The price is moving within a descending channel on the 1-hour frame and is expected to break and continue upward.
We have a trend to stabilize above the 100 moving average once again.
We have a downtrend on the RSI indicator, which supports the upward move by breaking it upward.
We have a support area at the lower limit of the channel at 0.1800, acting as strong support from which the price can rebound.
Entry price: 0.1838
First target: 0.1886
Second target: 0.1928
Third target: 0.1972

I positioned here — while others waited for confirmation.This was a textbook setup. Clean structure, high-probability narrative, and the kind of zone that doesn’t ask for your belief — it commands it.
Breakdown:
Price delivered a sharp move into a 1H OB confluence with an untouched 60min FVG sitting just below. That OB wasn’t noise — it was a true origin point, the last down candle before a major rally.
As price retraced, it swept short-term liquidity and tapped into that OB with precision. I watched volume spike on the drop — not retail fear, but Smart Money engineering the entry.
The 0.1795 zone wasn’t random. It was deliberate. A key equilibrium between displacement and rebalancing. And if this holds, the next logical draw is above 0.1860 — into the unmitigated FVG and resting buy-side liquidity.
Expectation:
From this 1H OB / FVG stack, I’m looking for:
Entry: ~0.1795
SL: Just under the 1.0 fib — under 0.1777
TP1: Mid FVG at 0.1831 (0.5)
TP2: Full inefficiency fill at 0.1887
I’m not forcing anything. If the market wants lower, there’s another FVG just below to absorb it — but structure still favors premium re-pricing.
Final note:
I don’t chase breakouts. I trap Smart Money setups, wait in silence — and strike when the chart gives me the story.
“The market doesn’t move by chance. It moves by design. And I design my trades the same way.”

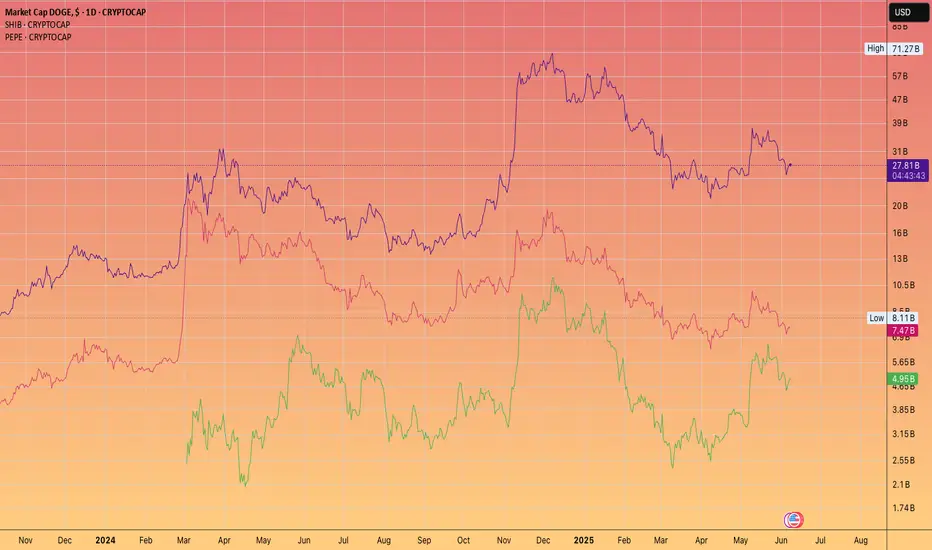
Pepe is going flip SHIB. But can it catch Dogecoin?If Ethereum were to smash $10k
Then it has a genuine chance IMHO
We shall be watching and tracking this as the cycle reaches it's mania phase!
DogeusdtDOGE/USDT – 4H Chart Analysis
Dogecoin is currently testing a key resistance zone between $0.1855 and $0.1880, which aligns with the descending trendline from the May highs. Price action is showing early signs of bullish momentum, but a confirmed breakout above $0.1880 is needed to shift the market structure.
🔹 Bullish Scenario:
If DOGE breaks and closes above $0.1880 with volume, it could trigger a trend reversal. Immediate targets would be:
$0.1980
$0.2100
🔹 Bearish Scenario:
Failure to break resistance and a drop below $0.1810 would likely lead to further downside toward:
$0.1760
$0.1640
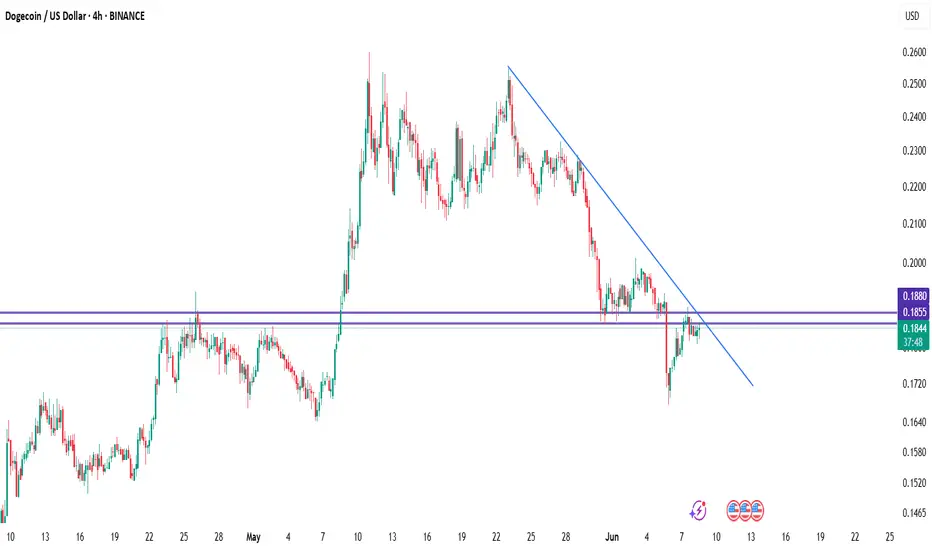
DOGE Short Setup in Play—Targeting $0.13258 and $0.08840The broader price structure of DOGEUSDT continues to reflect a clear downtrend, with price consistently printing lower highs and lower lows. This trend is well-respected, as shown by the descending blue trendline, which has acted as dynamic resistance since early 2025.
In late April to early May, DOGE saw a sharp rally, briefly breaking above the trendline. However, this move turned out to be a false breakout against the trend, highlighted on the chart with a label and visual marker. The breakout failed to sustain above resistance and quickly reversed, trapping bullish traders and reaffirming the bearish dominance. This type of price action often signals a bull trap, and in this case, the reversal was swift and aggressive.
The price has since declined and is currently trading around the $0.18258 region, hovering just below the local resistance and just above the initial support levels.
Key Levels Observed on the Chart
• Stop-Loss / Resistance Zone:
The red resistance area around $0.20930–$0.22643 marks a critical stop-loss zone for any short positions. This is the top boundary where the false breakout failed and where sellers previously regained control.
• Entry / Decision Zone:
Price is currently within a small neutral box (shown in light blue), indicating a potential short entry zone as price consolidates below resistance.
• Key Support Level 1 / Take Profit 1:
$0.13258 – This level has been labeled as the first major support and serves as the initial take-profit zone for short setups. Historically, this zone has held price during strong down moves, and it aligns well with past structure.
• Key Support Level 2 / Take Profit 2:
$0.08840 – The second support level is marked as a deeper profit target for continuation of the downtrend. This level is closer to multi-month lows and reflects potential bearish extension.
• Final Support Base:
$0.05000 – This level is the lowest green horizontal line on the chart, showing long-term structural support. If macro conditions worsen, this remains a plausible downside target.
Detrended Price Oscillator (DPO) Indicator
The DPO reading remains below zero at approximately –0.04, reinforcing the bearish momentum. The indicator does not show any bullish divergence, suggesting that there’s currently no sign of an upward reversal forming. The gradual downward slope of the DPO supports the probability of a continuation move to the downside.
Trade Setup (Short Bias)
• Entry Zone: $0.18258 – $0.18546 (current price range just under resistance)
• Stop-Loss: $0.20930 (above key resistance where breakout failed)
• Take Profit 1: $0.13258
• Take Profit 2: $0.08840
• Extended Bearish Target: $0.05000
Conclusion
DOGEUSDT continues to respect its long-term bearish structure, and the recent false breakout further validates the dominance of sellers. The failed attempt to reverse the trend above $0.20930 provides a well-defined stop for short setups, while the clean stair-step structure of support levels offers logical take-profit zones.
Unless DOGE manages to close above the $0.20930–$0.22643 resistance band with strong follow-through, the current bias remains bearish. Traders can monitor for short opportunities while protecting capital above the invalidation zone.

A lesson in DOGEDoge vs btc is one of my favorite altcoin charts. it has done well for me.
I ignored it this cycle to my detriment and forgot the significance of alt/bitcoin charts like a fool.
Already have seen good swings in doge we might get back to $0.70 but expecting anything more is greedy. we likely will not see the level of speculation we saw last cycle when Elon Musk performed a DOGE skit on SNL... lets try to be as reasonable as we can with our magical internet money.
to be clear. short term underperformance to BTC then DOGE rips like it does every cycle for like a month.
Get in near the -90% discount vs btc (sell your btc to buy some doge)
If you just look at the usd chart then it should be up only from here.

DOGEUSDT 1D Analysis DOGE ~ 1D Analysis
#DOGE Buy back gradually from here with a short term target of at least 15%+ from here.

They see relief. I see rebalancing.BINANCE:DOGEUSDT.P isn't bullish — it's rebalancing. What we’re witnessing now is price doing what it always does after manipulation: return to efficiency before delivering its next displacement.
Here’s the setup:
Price tapped into the 4H discount zone — a structural STB
We’re now reacting from the 0.618 (0.1940) and pushing up toward the 4H OB at 0.20403
That OB is perfectly nested just above the 0.5 fib (0.20190), and below the 0.382 (0.20970) — prime for internal liquidity collection
If price fails to break structure above that 4H OB, the move is complete. This isn’t bullish continuation — it’s cleanup. From there, I’m watching closely for signs of rejection and displacement back toward the OB + BTS zone near 0.16884.
This is where real risk is priced in — and where Smart Money actually loads up.
Execution mindset:
Let price reach into 0.204–0.209
Watch for rejection — that’s the trigger
Downside target: 0.18299 → 0.16884
If we impulsively break 0.2097 and reclaim it, the bearish thesis is invalidated and I’ll re-evaluate
This isn’t trading a bounce. It’s reading the cleanup.
You want real entries, real invalidations, real structure? Check the profile description. The trades speak louder than the noise.

DOGEUSD Fibonacci Channel shows minimum $1 Target end of year.Dogecoin (DOGEUSD) has held perfectly its 1W MA200 (orange trend-line) on the April 07 bottom, rebounded and is now consolidating around its 1W MA50 (blue trend-line). This consolidation shouldn't last for too long as based on the previous Cycles, this 1W MA200 test was the new bottom that should kick-start the final year rally.
As you can see, DOGE's historic pattern since its first trading day has been a Channel Up, which with the added element of the Fibonacci lines, only broke during the 2021 Top formation on its 1.5 Fib extension.
A key characteristic of the final year of each Bull Cycle is that after a 1W Golden Cross is formed, the price has always first hit the Mayer Multiple Bands (MMB) 2SD above (thin orange trend-line) and shortly after the MMB 3SD above (thin red trend-line).
So far the current Cycle has only hit the MMB 2SD because as the pace of this Cycle naturally slowed down (the higher the cap the slower the pace), it didn't go straight for a MMB 3SD test.
Despite the delay, the Fibonacci Channel along with the MMB give, in our opinion, two Target levels for this final year of the Cycle, a fair one and an optimistic. The fair one is at $1.00, which would make a perfect test of both the MMB 3SD and the 1.0 Fib ext at the top of the Channel Up. The optimistic is at $3.5 (potentially even higher), which would be exactly on the 1.618 horizontal Fibonacci extension (still below the 1.5 Channel Fib), which was the January 2018 Cycle Top and of course was greatly exceeded during the May 2021 Cycle Top.
-------------------------------------------------------------------------------
** Please LIKE 👍, FOLLOW ✅, SHARE 🙌 and COMMENT ✍ if you enjoy this idea! Also share your ideas and charts in the comments section below! This is best way to keep it relevant, support us, keep the content here free and allow the idea to reach as many people as possible. **
-------------------------------------------------------------------------------
💸💸💸💸💸💸
👇 👇 👇 👇 👇 👇

How to Spot the Perfect Dogecoin Buy Signal!Dogecoin (DOGE) is showing another major bullish signal!
After bouncing from the key weekly demand level at $0.151 mentioned in a previous supply and demand crypto analysis, DOGE coin is now approaching a new daily demand imbalance at $0.18035—a level where buyers have historically stepped in aggressively.
Why This Matters:
Strong Reaction Expected: Similar imbalances on other altcoins have led to sharp upward moves.
Long-term weekly imbalance: The weekly demand level is playing out very well.
Dogecoin (DOGE), the world’s favourite meme cryptocurrency, is trying to reach a critical weekly demand level at $0.151—its strongest daily demand zone in a long time! This presents a prime buying opportunity, especially for crypto beginners looking to enter the market.
Check the previous DOGE analysis from a few weeks ago.
Price tapped the discount — now it’s time to test premium.This setup on DOGE/USDT was mechanical. Not emotional.
I’ve seen this formation enough to know what comes next. The chart has already spoken.
After a clean markdown into the 4H OB, price hit the 0.786 retracement level — right inside a prior imbalance zone. That wasn’t a random drop. That was engineered. Liquidity was swept, sentiment reset, and now we have structure ready to reverse.
Notice this:
We’re sitting in a 4H demand OB with confluence from the FVG just above.
The Fibonacci levels are aligning with Smart Money delivery: 0.5 sits right at the base of the new rally expectation.
The 0.20928 level is the first key reaction point — I expect a stall or consolidation there.
But the real test comes higher: the 0.22094 OB, which also aligns with the 0.382 fib level — the market’s threshold between discount and premium.
I’ll be watching price closely on its approach into that 0.209–0.22094 region. If it delivers clean displacement through FVG, the next liquidity grab sets up a premium continuation model.
If we reject early — that tells me distribution is starting, and I’ll prep for a secondary sweep below 0.18 to retest the deeper 4H OB near 0.16387.
This setup didn’t require a confirmation signal.
It required understanding why price dropped — and where it’s designed to go.
I don’t need to guess. I just need to be aligned.

TONCOIN Hits First Target with 27% Gain – More Upside Ahead?By examining the #TONCOIN chart on the 3-day timeframe, we can see that after the last analysis, the price successfully hit the $3.64 target and has gained a total of 27%. Following this rise, the price entered a corrective phase and is currently trading around $3.15. The analysis remains valid, and I still expect further upside from this cryptocurrency. The expected return is around 20% in the short term, 40% to 55% in the medium term, and 110% in the long term.
Please support me with your likes and comments to motivate me to share more analysis with you and share your opinion about the possible trend of this chart with me !
Best Regards , Arman Shaban

The key is whether it can find support at 0.18951 and go up
Hello, traders.
If you "Follow", you can always get new information quickly.
Have a nice day today.
-------------------------------------
(DOGEUSDT 1D chart)
It touched the A section, which was the previous breakout trading section, again.
That is, if it is supported and rises near 0.18951, it is a time to buy.
If not, it will fall below the M-Signal indicator of the 1M chart, so caution is required when trading.
This is because in order to continue the upward trend in the medium to long term, the price must be maintained above the M-Signal indicator of the 1M chart.
Therefore, a short and quick response is required when trading below the M-Signal indicator of the 1M chart.
-
The channel of the High Line ~ Low Line of the OBV indicator is showing signs of turning into a downward channel.
Therefore, you should check whether the OBV shows signs of rising above the High Line.
-
The basic trading strategy is to buy near the HA-Low indicator and sell near the HA-High indicator.
It currently meets the HA-High indicator and falls to meet the HA-Low indicator.
Therefore, this wave should be interpreted as closed.
Therefore, a new wave will start from the HA-Low indicator that we met this time.
If it falls from the HA-Low indicator, it is likely to show a stepwise downtrend, and if it rises from the HA-High indicator, it is likely to show a stepwise uptrend.
Therefore, we need to check whether the HA-Low indicator supports the new wave to see if it is a downtrend or an uptrend.
-
Thank you for reading to the end.
I hope you have a successful trade.
--------------------------------------------------
- This is an explanation of the big picture.
(3-year bull market, 1-year bear market pattern)
I will explain more details when the bear market starts.
------------------------------------------------------

DOGE ShortOne of the ones that looks good for short. I entered a little bit from here, I will add a little bit more with the trend break.
I am short-biased because I think there will be a correction in my general market bias. After a correction I will look for long positions

#DOGEUSDT: Swing Buy Coming Up, Get Ready Dear Traders,
Price of Dogecoin has dropped similarly to the other crypto pairs, price is on the way to fill the void area and then we can see price reversal. Wait for price to drop a bit more than you can enter a buy entry, taking price to a new level.
