DOGE Ready for PUMP or what ?What I see now is that the price could correct to the PRZ and then pump again, and currently, there is no specific bullish pattern in the chart. which could cause the price to drop below 20 cents.
Dogecoin

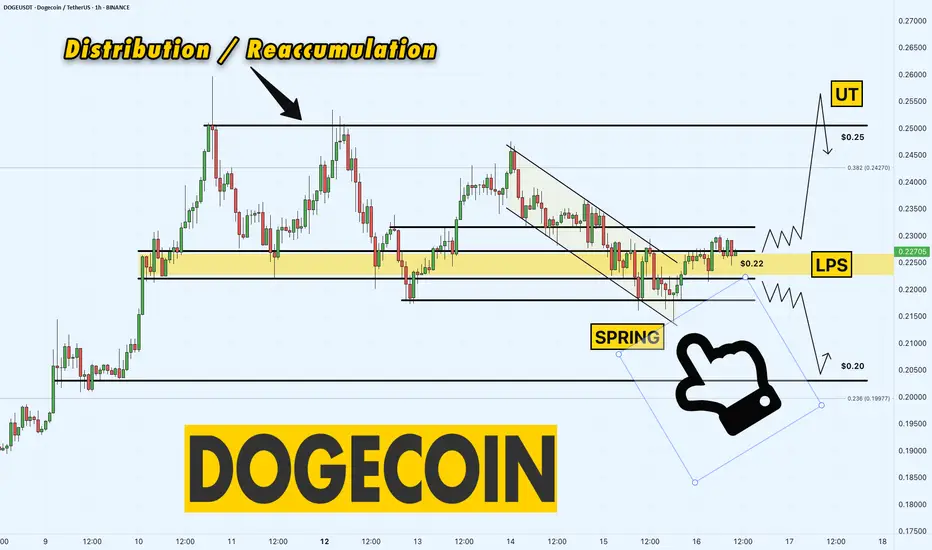
DOGE/USDT 1-Hour Chart – Distribution or Reaccumulation?Dogecoin is at a critical juncture on the 1-hour chart!
We’re seeing signs of a Distribution/Reaccumulation phase, with the price action teasing a potential move. After a possible Spring shakeout at $0.215, DOGE has climbed into the Last Point of Support (LPS) range between $0.22 and $0.23. This could be a launching pad for a bullish move!
I’m watching for a push toward $0.25, where we might see a UT (Upthrust) structure form — a solid target for this setup. However, if the price fails to hold, a breakdown below $0.22 could send us toward the $0.20 level, a key support to watch. The $0.22-$0.23 zone is critical right now — will bulls take control, or will bears strike back? Let’s find out!
Key Levels to Watch:
Support: $0.22 (LPS range), $0.20 (breakdown target)
Resistance: $0.23 (upper LPS range)
Target: $0.25 (potential UT structure)
What’s your call, traders? Are we heading for $0.25, or will $0.20 come into play ? Drop your thoughts below!
First step towards ATH BULIISH FLAG on DOGE
In several time frames DOGE has formed a Bullish Flag from around $0.16 going to $0.32.
This is the first dog step to the ATH!


Short DOGEUSDT With Confidence – Bearish Setup + Targets🔍 Technical Analysis Summary
Pattern: Bearish Flag (Bearish Continuation)
Resistance Zone: Around 0.25945 USDT
Price Channel: Price is consolidating inside a descending flag channel after a sharp upward move.
Potential Breakdown: If price breaks below the lower trendline of the flag, continuation to the downside is expected.
📉 Trade Setup (Short Position)
Entry Point: Around 0.22534 USDT (at or just below the flag's lower trendline to confirm breakdown)
Stop Loss: Around 0.23581 USDT (above the upper flag boundary for invalidation)
Take Profit Targets:
o TP1: 0.20573 USDT (first strong support zone)
o TP2: 0.18691 USDT (second strong support zone)
✅ Risk-Reward Ratio Analysis
Entry: 0.22534
Stop Loss: 0.23581 → Risk: ~1.05 cents
TP1: 0.20573 → Reward: ~1.96 cents → RR ≈ 1.86:1
TP2: 0.18691 → Reward: ~3.84 cents → RR ≈ 3.66:1
📌 Conclusion
This bearish flag setup on DOGEUSDT presents a strong opportunity for a short position. A confirmed breakdown below the flag pattern could lead to a test of the strong support zones marked. It's a good setup with a favorable risk-reward ratio, especially if TP2 is reached.

Be careful with DOGE !!!So if you pay attention to the DOGE chart you can see that the price has formed a Ascending FLAG or DOGE which means it is expected to price move as equal as the measured price movement.( AB=CD )
NOTE: wait for break of the FLAG .
Give me some energy !!
✨We spend hours finding potential opportunities and writing useful ideas, we would be happy if you support us.
Best regards CobraVanguard.💚
_ _ _ _ __ _ _ _ _ _ _ _ _ _ _ _ _ _ _ _ _ _ _ _ _ _ _ _ _ _ _ _
✅Thank you, and for more ideas, hit ❤️Like❤️ and 🌟Follow🌟!
⚠️Things can change...
The markets are always changing and even with all these signals, the market changes tend to be strong and fast!!

Dogecoin (DOGE) OverboughtI have been trading for a long time using the DCA strategy indicator that I have developed and I have recently published the indicator on my Tradingview page.
According to this indicator, I have been buying DOGEs at support levels with more money than I would have thrown away so far. This support level is generally seen at $0.056. In addition, I dumped some of my DOGE at $0.2285, but then bought again at $0.107. I have already shared this analysis.
I think that DOGE, which has broken through two resistances, will advance at least up to $0.75 (potential 89% return). But for this progress, I think that it must first find support at the $0.2285 level, which was broken again. This is because the indicator also gives an overbought signal. Therefore, I will tailor my portfolio accordingly. But I wouldn't be surprised if it continues relentlessly.
As long as Elon Musk remains in government, I think this cryptocurrency will be on a continuous upward trend.

Dogecoin Long-Term, Weekly TimeframeRepeating patterns are great because you can easily predict the future by studying them.
Good...
Dogecoin produced a peak in March 2024 and starts a decent. This descent creates a sequence of lows marked 1,2,3 on the chart. This ends up as a rounded bottom. As soon as the action recovers above the baseline of the rounded bottom, there is some consolidation and then massive growth. The highest prices in several years. The situation is very similar today.
Dogecoin produced a peak in December 2024 and then starts a descent. This descent creates the bottom pattern shown on the chart. The market is already bullish as all the bearish action since February has been removed. DOGEUSDT moves now as if it were February 2025. March and April where the months that produced the final market shakeout (flush) before the 2025 bull market cycle and wave.
Right now we can see some consolidation based on the weekly timeframe, very short, followed by additional growth. The biggest wave since 2021. Something awesome.
Are you ready?
I hope you are...
Namaste.

Dogecoin is ready to blast off!A lot of people have no idea just how big the Dogecoin pump could be. We’ve seen a massive, multi-year accumulation pattern—very similar to what happened before explosive moves in assets like Tesla and Bitcoin. I believe this quiet phase is about to end, and Dogecoin could soon break out in a huge way.
This could send DOGE soaring to a new all-time high and ignite a powerful bull market.
As always, stay profitable.
– Dalin Anderson


Dogecoin Buy Signal: Will the Channel Break Today?Hello friends
Given the good growth we had, you can see that the price has taken a break, which can be used as a buying opportunity.
We have identified the buying steps for you to buy in steps and move to the specified goals.
*Trade safely with us*

DOGEUSD Massive Bull Flag targets $0.40 like late 2024!Dogecoin (DOGEUSD) is posting a Bull Flag pattern on the 4H time-frame, being supported by the 4H MA50 (blue trend-line).
A similar Bull Flag was formed at the start of its previous major rally in October 2024, which made the price jump to the 2.0 Fibonacci extension, in as much time as it took for the price to reach the Bull Flag's start from the bottom.
As a result, we expect DOGE's next short-term Target to be $0.40.
-------------------------------------------------------------------------------
** Please LIKE 👍, FOLLOW ✅, SHARE 🙌 and COMMENT ✍ if you enjoy this idea! Also share your ideas and charts in the comments section below! This is best way to keep it relevant, support us, keep the content here free and allow the idea to reach as many people as possible. **
-------------------------------------------------------------------------------
💸💸💸💸💸💸
👇 👇 👇 👇 👇 👇

"DOGE - Time to buy again!" (Update)Finally, this pattern was broken and had a positive impact, leading to significant growth. Now, with a slight price correction, higher price levels can be reached.
PREVIOUS ANALYSIS
Stay Awesome , CobraVanguard

#DOGE/USDT#DOGE
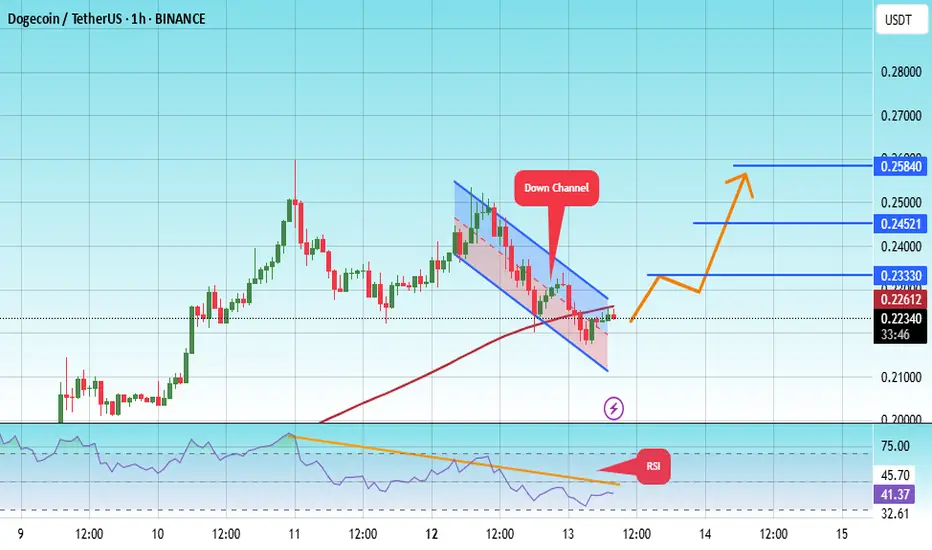
The price is moving within a descending channel on the 1-hour frame, adhering well to it, and is on its way to breaking it strongly upwards and retesting it.
We are seeing a bounce from the lower boundary of the descending channel, this support at 0.2136.
We have a downtrend on the RSI indicator that is about to break and retest, supporting the upward trend.
We are looking for stability above the 100 Moving Average.
Entry price: 0.21390
First target: 0.23330
Second target: 0.24521
Third target: 0.25840
Strong DOGE Breakout Points to 20% Upside Toward 0.28Hello and greetings to all the crypto enthusiasts, ✌
All previous targets were nailed ✅! Now, let’s dive into a full analysis of the upcoming price potential for Dogecoin 🔍📈.
DOGE has broken out of its descending channel with strong bullish momentum 📈. Backed by healthy volume and a bounce near key Fibonacci support, I'm anticipating up to a 2 0% upside, with the primary target set at 0.28 🚀.
🧨 Our team's main opinion is: 🧨
DOGE broke out with strong volume, eyeing up to 20% upside toward the 0.28 target 📈.
Give me some energy !!
✨We invest hours crafting valuable ideas, and your support means everything—feel free to ask questions in the comments! 😊💬
Cheers, Mad Whale. 🐋

Is DOGE ready to pump 20% toward $0.22 next?Hello and greetings to all the crypto enthusiasts, ✌
All previous targets were nailed ✅! Now, let’s dive into a full analysis of the upcoming price potential for Dogecoin 🔍📈.
DOGE is showing strong signs of an imminent breakout above the descending channel resistance. A confirmed breakout could open the door for a potential +20% move, with the next key target around $0.22, aligning with a major supply zone 📈. Watching for volume confirmation and momentum strength on lower timeframes 🚀.
🧨 Our team's main opinion is: 🧨
DOGE is gearing up for a strong breakout above its descending channel, with a 20% upside potential and a key target at $0.22 if momentum confirms 📊.
Give me some energy !!
✨We invest hours crafting valuable ideas, and your support means everything—feel free to ask questions in the comments! 😊💬
Cheers, Mad Whale. 🐋

Dogecoin Vs Bitcoin: Mapping The 2025 All-Time HighThese are not the numbers that I am using for my DOGEBTC trade, these are very strong targets, for my numbers I am using the conservative targets for whatever reason. I guess it has been just too long since the last bull run phase.
Dogecoin is now trading within a long-term support zone vs Bitcoin, the strongest support range ever for this Cryptocurrency trading pair.
In the 2021 bull market, this level worked as resistance before the fifth and final wave. After the end of the bull market, this resistance turned support and it has been tested over and over and it holds.
The first time it was tested was June 202, then again in late 2023, early 2024 and again late 2024. This is the blue zone on the chart.
After the bullish jump last year, DOGEBTC is back again moving in this trading range. The action is happening as a higher low compared to previous years and there is no volume. It is 100% certain that this support will hold, which means that we are now in a very strong buy-zone, the accumulation zone. The best entry range possible before the 2025/26 bull market phase and bull run.
» Buy and hold.
Namaste.

DOGE to new ATHDOGE has been sleeping since the ATH in 2024. But has now woken up. The interest in this coin of freedom between people has again started to spike. On 21D chart there's a giant Cup & Holder with the promise of taken this coin to a minimum of $0.72 !

Cup & Holder on Doge DOGE has been sleeping since the ATH in 2024. But has now woken up. The interest in this coin of freedom between people has again started to spike. On 21D chart there's a giant Cup & Holder with the promise of taken this coin to $0.72.

Is It "GO" Time for $DOGE Dominance to Flippen BTC?Been talking about this for a while.
Early, but not wrong.
Remember: nothing ever moves in a straight line except c0caine- and even then, only if you're a degenerate.
But enough about my theory- this market is breaking a lot of old "ObViOuS" patterns, because they never repeat perfectly.
What do YOU think is going on here?
Is it actually GO time?

DOGE - 1$ NextDoge is getting ready for the next wave. Based on the previous trend we are looking at the next target around 1.1$.
Doge can break 1$ easily based on the current trend and overall interested in DOGE.
Entry: 0.1766
TP1: 0.22086
TP2: 0.30439
TP3: 0.40104
TP4: 0.53436
TP5: 1.13587
Stop Loss: 0.1143
Follow us for more such ideas.
Cheers
GreenCrypto

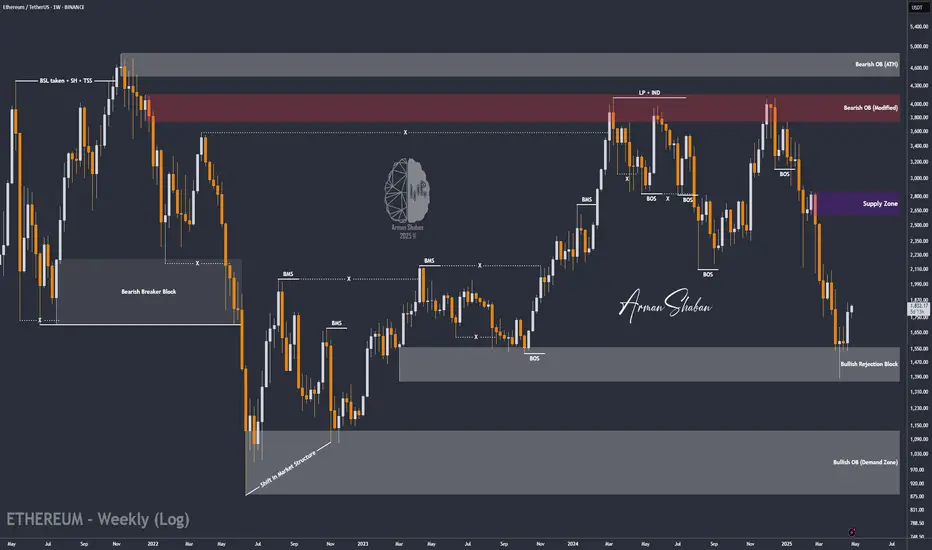
ETH/USDT : Bulls are coming back? (READ THE CAPTION)By analyzing the #Ethereum chart on the weekly (logarithmic) timeframe, we can see that after reaching the demand zone between $1400 and $1550, buying pressure increased significantly. Currently, Ethereum is trading around $1800, and I expect to see the next bullish wave soon. The potential upside targets are $1990, $2500, and $2600. This analysis will be updated accordingly!
Please support me with your likes and comments to motivate me to share more analysis with you and share your opinion about the possible trend of this chart with me !
Best Regards , Arman Shaban
TON/USDT : The Next Bullish Rally Ahead? (READ THE CAPTION)By analyzing the #Toncoin chart on the 3-day timeframe, we can see that the price is currently trading around $3.00, which is approximately 60% below its all-time high of $8.20. If Toncoin can hold above the $2.80 level, we may expect further bullish momentum in the mid-term.
The next potential upside targets are $3.39, $3.64, $4.20, and $4.66.
Please support me with your likes and comments to motivate me to share more analysis with you and share your opinion about the possible trend of this chart with me !
Best Regards , Arman Shaban
