DOGEBTC still supported. Will it go higher or not?Hi everyone, this is another update on dogebtc. As per chart we can see that for time of writing we have a nice reaction from fib 50%, but i would like to point out that after almost 1000% gain, we may see a 61.8% retracment on doge before any futher upside.
This information is not a recommendation to buy or sell. It is to be used for educational purposes only.
"A is for my attitude working through the patience
Money comes and goes so the M is for motivation
Gotta stay consistent, the P is to persevere..."
Dogecoinbtc

DOGE - Buy a break setup.Dogecoin - Intraday - We look to Buy a break of 0.0876 (stop at 0.0839)
Daily signals are bullish.
Pivot resistance is at 0.0875.
A break of bespoke resistance at 0.0875, and the move higher is already underway.
Trading close to the psychological 0.10 level.
We look for gains to be extended today.
Short term indicators have turned positive.
Our profit targets will be 0.0989 and 0.1122
Resistance: 0.0835 / 0.0875 / 0.1000
Support: 0.0800 / 0.0760 / 0.0700

4 hour renkos doge to the moon. I would like to point out some key trends I've notice over dogecoin recently. First of I trade on kraken. It was very wild to see that doge has moved up so fast. I've been messing with doge since It was viable to me for two things. Consistent market making profits, and a low transaction cost way of moving currency between exchanges. XLM still works well for the lower transaction cost. Than I turn back Into what I'm really Interested In. But Kraken was moving up perfectly to break the high from the recent pump, and dump. But It ended the following rally at the exact same point of .088. Wow scary but the market recorrected ~25 percent In the next four hours. But after Doge was still In a parabolic state. In my opinion It overstayed It's welcome. Since than On kraken I'm currently looking at a beautiful four hour chart. After pushing towards a new local low at .0617330 on kraken We've seen higher lows, and higher highs. It's Important to not these are extreme velocity movements. 15 minute candles going down 10 points from .08 to .07. Yet over the past four hour periods things have changed as the velocity has dropped continuously. So what does this tell us? Well Doge Is taking In all of that recoil posing Itself for extreme movements In one direction. It's looking primed for breaking new high highs after coming down to earth to balance the technical side. This could be a beautiful rally. But this does not constitute any investment advice. Simply pointing out what I see.
Let's dip Into the chart I posted on renkos of doge. Renkos are great for analyzing overall direction of markets. This Is because they are very difficult to make. Put simply whatever chart your'e using they take that integar x 14 periods default. Now If you the Average True Range over that period It has to break a certain point to make a block. Or to move down break blow a point. As you go down with Renkos In charts from say this you will see a lot more Insight Into where doge Is, and has been heeaded. Notice the four hour renkos starting to form for doge. Than pull back. Note these higher level renkos for doge are a much less frequent occurrence. So I'm keeping my eye on the market for that next step up to hopefully breakthrough 10 cents and push up hopefully to the 15 cents range. Although technically speaking the fundamentals are what's bringing our Analysis of past data out of proportion. 12 or 12.5 Is more realistic from just a technical perspective alone. It's very Important doge was able to match the pump and dump on It's own. Now I'm watching for the velocity to move one way or another. When we do push up and make our next new high high the market Is Ready for that. Compared to when we were going parabolic recently. Yolo!
I'm getting started on trading view. I very much appreciate any feedback, follows, likes, and comments. I'm working to continuously prove. I truly appreciate the support I've received so far

DOGECOIN : BUY BEFORE NEXT PUMP (POSSIBLE DIP)Hello everyone!
The last idea I posted was much appreciated (+15 likes), I have to say that I did miss TradingView Community! :D
The Dogecoin is gaining more and more attraction and exposure from a lot of different ways ! (Billboards, Celebrities, News articles, Social Networks etc..)
As people get excited, the more they buy, the higher Dogecoin market price will be!
Following Technical and Fundamental, the Dogecoin will bounce from the support line and the resistance line in the next days (maybe a week or earlier) before breaching it again and pushing it upper again!
To the moon!

DOGE prepare for selloff!After this massive bull run based on endorsements, also prepare for the worst!
The indicator signals sell on lower timeframes!
Please leave me a message if you want to test the buy and sell indicator that i am using.

DOGECOIN DOOM OR MOON PART 3Bearish signals
- Death cross (ma) forming in 45m-4hr time frames
- volume decreasing
- macd dropping
Expecting drop to continue to $0.060 and dropping after to $0.050 range
What do you all think of the new visual style? let me know (:
Always be careful when trading doge as it is very volatile right now and can change market directions rapidly and unexpectedly, be wise and use your stop losses or buy limits
''Buy Big Sell BIGGER'' - MegaWhale

DOGECOIN PULLBACK AFTER IMPRESSIVE RUNDOGECOIN will be pulling back after an impressive run to a new ATH,
bearish indicators
- ma death cross incoming
- macd cross downward
- volume decreasing
Let me know your thoughts
''Buy Big Sell BIGGER'' - MegaWhale


Doge Bullish!There's not much data to predict where this coin is going but, for the last few days the price action has respected a trend line and resisted a major zone of supply. The price continuation has two scenarios depending if it can break through the resistance zone but in both cases price is bullish!
Trade safely, this is my own bias on the market.


DOGE COIN MOON OR DOOM PART 2Dogecoin has definitely been the hype coin of the week reaching a new ATH in a very short period of time - largely due to all the hype spread form WSB and Reddit.
Currently, Dogecoin has broken out of a pennant it has been in since the newly found all-time high - while finding support on the new up trend line although briefly breaking below yesterday.
If doge can break above a strong resistance level of $0.040 we could potentially see a run-up close to the newly set ATH - bear case: if doge fails we could see it retest the $0.030 - 0.020 range.
Always be safe when trading hype coins as market directions can change rapidly - let me know what you all think doge will do over the next few days!
''Buy Big Sell BIGGER'' - MegaWhale

Dogecoin ready for next rallyHey friends, hope you are well, and welcome to the new update on Dogecoin.
Small Gartley move:
Previously we have seen that the Dogecoin formed a Gartley pattern on a 4-hour chart. There was a complete opened alligator’s mouth below the buying zone like we had the smallest time period simple moving average 25 above all and the biggest time period SMA 200 below all and the priceline surged more than 102%.
New Gartley moves.
Now the priceline of Doge has formed another bullish reversal Gartley move. This time this pattern is bigger than the previous one because it has been formed on the daily time period chart. This time again there is a complete opened alligator’s mouth below the potential reversal zone because again we have the smallest time period simple moving average 25 above all and the biggest time period simple moving average 200 below all.
The priceline of Dogecoin has also formed another Gartley on the same daily chart with Bitcoin pair as below:
Conclusion:
As the priceline of Doge produced more than 102% when it formed a small Gartley pattern then it can be possible that Dogecoin will rally more than the previous rally because this time the harmonic move has been formed on the daily time period chart.

Will we break above or below?Current trend lines are holding but soon will have to make a decision within a few hours.
Break above $0.043 and we're going higher.
We can consolidate out of the support line, and the we may break out tomorrow.
Support levels:
$0.0372
$0.0361
$0.035
Center white line of Bollinger band and the Blue and Orange moving averages are also acting as support.
DOGE MACD about to cross on 4H chart and DOGE/BTC has an ascending triangle pattern.
Not Financial Advice. Please invest only what you can afford to lose. Limit Risk using stop losses below support levels


DOGE Triangle Pattern - Long @ 126 SatsTriangle Consolidation pattern on DOGE/BTC.
Resistance at 0.00000125 BTC
Support at 0.00000107 BTC
Price Target remains 0.00000214
Coincides with my DOGE/USD price prediction.
Not Financial Advice. Please invest only what you can afford to lose. Limit Risk using stop losses below support levels

Cup & Handle - DOGEClear cup & handle on 30 minute time frame.
Chart and Fib levels are in Log Scale.
Could possibly be the last buy zone before it skyrockets.
Support levels :
$0.03612
$0.035
Price target $0.07
Not Financial Advice. Please invest only what you can afford to lose. Limit Risk using stop losses below support levels


DOGE - $0.07 Target - Plus Fib PredictionsThere are 3 separate Wave 1 & 2's
Chart and Fib extensions are in Log Scale.
Intermediate (White) Wave 3 Targets are:
- 3.618 = $0.12
- 2.618 = $0.09 - $0.10
- 1.618 = $0.07
Minor (Yellow) Wave 3 Targets are:
- 3.618 = $0.14
- 2.618 = $0.09
- 1.618 = $0.057
Now because the intermediate 1.618 is greater than this price, I'm looking for 2.618 and 3.618 .
Primary (Light Red) Wave 3 Targets are :
- 3.618 = $0.31
- 2.618 = $0.232
- 1.618 = $0.15
Added a price channel which should act as support and resistance.
Validated by multiple touches.
Keep in mind that a large rally can break through the channel.
Fib predictions aren't scaled to time, they are scaled to price. So it may happen a lot faster and the X axis may be more to the left.
Support at $0.035
Not Financial Advice. Please invest only what you can afford to lose. Limit Risk using stop losses below support levels

ORAL PILL VACCINE !!! COVID 19-01/28/2021--------- BULL FLAG ON DAILY
01-29-2021-------BULL FLAG ON HOURLY
FEBRUARY 3RD PRESENTATION ON CONFERENCE WITH DR. FAUCI AND OTHER LEGENDS
ORAL VACCINE ------ COVID 19 PILL VACCINE ----- NOROVIRUS ----- FLU---- JNJ COLLABORATION----
NEXT WEEK IF FOLLOWED THE TREND AND NEWS are POSITIVE --- $16 IS EASY !!!
IF FALL DOWN --- WILL GO TO $10.45 AND STAY THERE TILL ANOTHER DIRECTION!
POSSIBLE SHORT SQUEEZE IF IT HITS $16, 33.97 MILLION SHORT AVAILABLE.. ONE OF THE MOST SHORTED TICKER IN 2020.

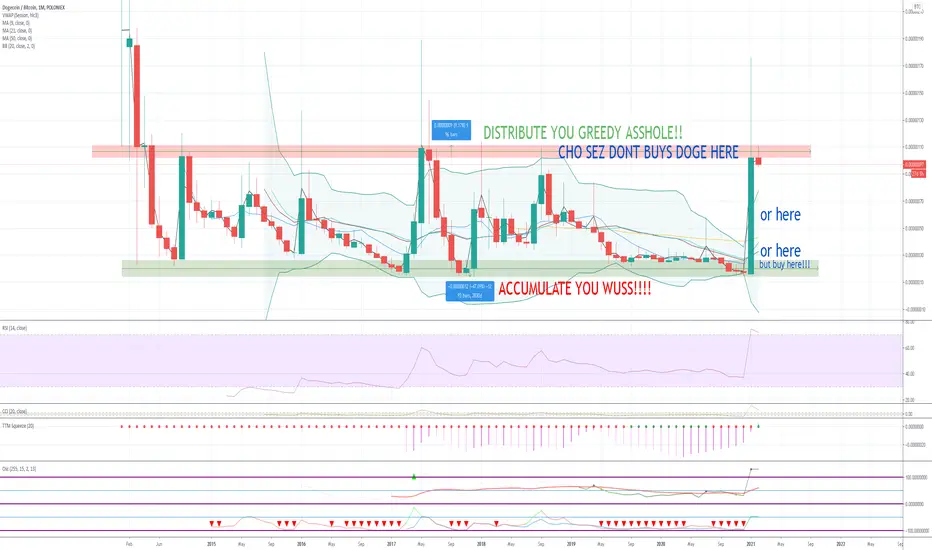
Dogecoin; the cycle will probably repeatDOGE/USD has too much noise, but DOGE/BTC is easier to read. Zoom out on 1W and you can see what I mean. This chart is my anticipated continuation of the cycle.
