Dogecoin formed bullish Gartley | A good buy opportunityHi dear friends, hope you are well and welcome to the new trade setup of Dogecoin (DOGE) with US Dollar pair
Prevously we caught a nice pump of Doge:
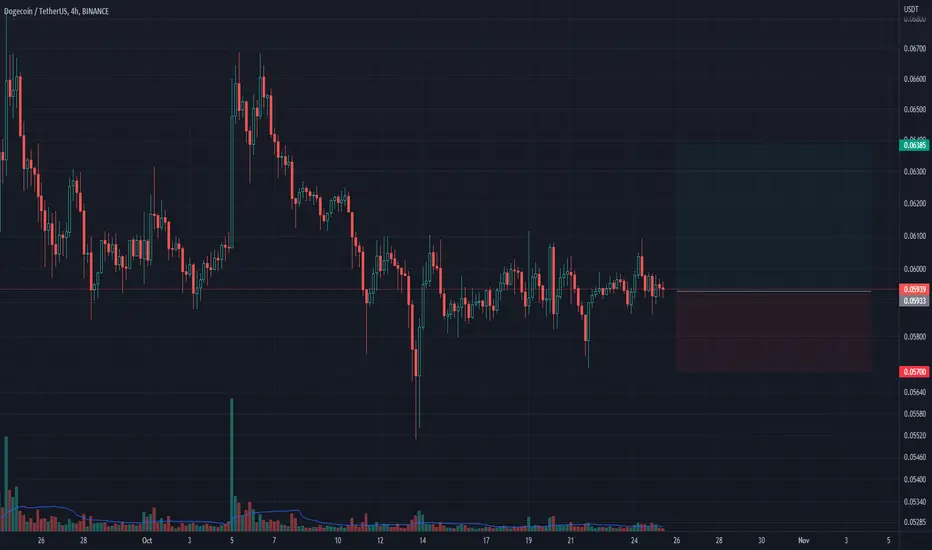
Now on a 4-hr time frame, DOGE has formed a bullish Gartley pattern for another price reversal move.
Note: Above idea is for educational purpose only. It is advised to diversify and strictly follow the stop loss, and don't get stuck with trade
Dogelong

Dogelon (ELON/USDT) technical analysisPrice is moving in a downtrend channel. We need to see price break the upper band of the downtrend channel as well as an increase in buy volume to confirm the trend change. Waiting for the price to form a higher low is a good strategy to lower the trading risk.

40% MOVE Incoming for DOGEDOGE is ripe for another pump.
Let's see if Elon will mention it if so it will fly since people are dumb.

DOGEUSDTDoge Breaking Falling Wedge In h4 Timeframe
Once Breakout Confirmed Expecting 20 to 25% Bulish Move
Always Wait For Breakout To Be Confirmed

Dogecoin’s December trajectory Dogecoin has now made its way through a trend reversal, after its sharp rise and pullback in the back half of October and first half of November. In October, DOGE began a massive rally, gaining over +150% in just five days. About half of these gains have been given up now as some traders booked their profits. In the middle of November, Dogecoin experienced a period of consolidation between 0.0742 and 0.0900 creating a double bottom at the same time, giving the first possible signal that the coin was ready for a trend switch.
The trend reversal was confirmed by the Fisher Transform Indicator on the daily timeframe. A crossover between the indicators signal lines can be witnessed after it created support at 0.07450. Since then, we have seen the price move to the upside, breaking above 0.0900, a previously strong resistance.
Looking at the current price action at the start of the week, DOGE may be in a new area of consolidation and trying to break the resistance at 0.1070. Looking back at the Fisher Transform, we can see that it is again indicating a crossover signal, which may hint that DOGE is posed for an upside breakout. If the price successfully breaks the resistance at 0.1070 and manages to close above the daily chart, the next price target to watch includes 0.1420 if the momentum is strong enough.
Besides the technical side of Dogecoin, it might pay to keep an eye on news emanating from Elon Musk by way of Twitter. Speculation has been rife that Musk will announce that the social media platform that he recently acquired will adopt Dogecoin as some form of payment method. Last week, Musk shared slides from a presentation he gave to the Twitter leadership team detailing his version for ‘Twitter 2.0’. Included in the presentation were slides related to ‘payments’, opening speculation that Musk may be wanting to form some kind of integration with his favourite cryptocurrency.

DogeCoin 4H AnalysisTrade Idea
🟡 #DogeCoin 4H
✍️The strength of the trend in Dogecoin is more likely to move up to the supply limits in the four-hour time frame. Consider two trading setups for buying or selling Dogecoin in the following ranges.
🔰 For buy a limit Orders👇👇
🟢Minor Order Block >🟢0.0.087$ -0.09$
🟢Major Order Block >🟢0.079$ -0.082$
🔰For Sell limit Orders👇👇
🔴Minor Order block >🔴0.113$ - 0.115$
🔴Major Order Block> 🔴0.122$-0.1305$
📊Poc (Point of Control) : 0.095$
⚠️ Margin 1% For each position.
⚠️Use Tight Stop Loss.
✍️Desert Eagle
📊Analysis Method SMART Money
Concept + ICT+ Volume Profile
(DYOR)
📆11.27.2022
⚠️This Analysis Will Be Updated⚠️
💸Good Luck Traders.

doge breakout - @dogelong ???How far will it go?
Doge break out for now. We are in uncertain territory after the twitter takeover from @ElonMusk

DOGEUSDTDOGEUSDT looks good for a small short setup here.
entry around 0.094 - 0.0972
Take profit areas: 0.087, 0.081, 0.075.
Wait for confirmed rejection, dogecoin has visited the level 3 times on the 4h chart now. Set strict SL and manage it yourself. Remember proper risk management.
On the hourly, we can see some sort of an uptrend or possibly ascending triangle.

every thing Fine with previous predictionDogecoin Break up the descending triangle and completed its pullback. Now after a few day with range movement , we can have a upward movement again. be aware that the BTC movement is important for this prediction Comes true.
first of all price should break up the 0.17 area that we can see in this chart.

I think Dogecoin Can move Up to midline in 4H TimeFrameI think Dogecoin Can move Up to midline But every thing depends On BTC Movement.
We should wait and see What Happened.

dogeanalysis was shared last week now done with 124% profit
this is we can get lots of profits by pure price action analysis

Ascending Triangle Pattern for dogecoinAfter the purchase Twitter by Elon Musk ,we saw that the long-term bearish trend line of dogecoin was broken upwards. An ascending triangle pattern is formed in the 4-hour time frame. If this pattern is broken upwards, the price will increase as much as the height of the triangle.

Dogecoin formed bullish Gartley for upto 41.50% moveHi dear friends, hope you are well and welcome to the new trade setup of Dogecoin .
On a 1-hr time frame, DOGE has formed bullish Gartley setup.
Note: Above idea is for educational purpose only. It is advised to diversify and strictly follow the stop loss, and don't get stuck with trade

DOGE LONG (Day Trade / Scalp)Day Trade / Scalp only
Longing Doge here
Take profits around .061 then set SL to breakeven once TP1 gets hit

DOGE - 8/30/2022Long dog coins for financial freedom.
Good points on the daily and weekly as far as MACD and RSI. Good levels of support around 6 cents and volume looks like it's coming in. Volatility seems like it's increasing and there may be a pump soon.
Not FA. :P


Trade Alert - Doge Long to .0937Order placed for entry at .0637. Target shall be .0937 with SL at .05573
Best to you!
Stew


DOGEUSDT testing OrderblockDOGEBTC already tested 230 sats (former ATH)
BTC already tested 20k (former ATH)
US Indexes show some strength on the Monthly OB
The FED is rising .75 points (already priced I think)
I guess we might get some local bottom, at least for a while.
Good moment to set unleveraged buys imho.
There are better setups, but Im still trading this since Im stuck (and ashamed).

$DOGEUSDT - Breakout & Reversal play with 15% to 50% upsideTechnical Analysis (TA)
Weekly Chart is showing signs of breaking out/reversing from the overbought zones.
The daily chart is breaking out of the resistance level of 0.07776 and attempting to break above the 100ema with solid indications of a reversal.
On the weekly we have plenty of space to fill up until the 0.09 level and further upside (if overall trends are good) to 0.117.
Price Target
Entry: 0.78
Target 1: 0.09 (+15%)
Target 2: 0.117 (50%

ELON MUSK BUY DOGE & BTCI think Elon just bought bitcoins below $20,000
◾️He wrote on June 19:
I will support DOGE
◾️They wrote to him: so buy
◾️He answered: I am
The rate was on June 19 - $19.000 for bitcoin.
Twitter link
Conclusion: he sold at breakeven at $29,000 to buy at $19,000.
The next report will be when bitcoin comes to ATH and everyone knows that Elon bought bitcoins... This will be a short signal...

DOGEUSD: Elliott Waves Intraday TradingRocket with DOGE COIN logo temporarily broke)
I have closed the old long position yesterday with a good profit, before the decline.
Edited my trading plan, and started gaining volume for the long position waiting for the completion of the correction within wave Y of wave 4.
All in all, some wave X is likely to be formed locally and it might end up on the boundary of the past trend line.
In the alternative scenario, the sluggish dynamics will continue and the current wave 4 structure may take on a triangle pattern.
Will the DOGE give a 40% gain, do you think?)
Best Regards,
CEO Tornado Capital
