DOGE ANALYSIS🔮 #DOGE Analysis
🌟🚀 #DOGE is trading in an Ascending Triangle Pattern and here we can see that #DOGE testing the ascending trendline. Also there is an instant major support zone. We can see a pullback from its major support zone.
🔖 Current Price: $0.34820
⏳ Target Price: $0.41960
⁉️ What to do?
- We have marked crucial levels in the chart . We can trade according to the chart and make some profits. 🚀
#DOGE #Cryptocurrency #Breakout #DYOR
Dogeusdt

Nobody appreciates it !!!Following the recent significant decline, DOGE has now developed an ascending triangle pattern on the daily chart, which might indicate a bullish trend. Keep in mind that this analysis is based on the daily time frame.
............................................
The Crypto Market Game: How to Win Against Fear and Manipulation
Did you really think profiting from the current bull run (a comprehensive upward market) would be easy? Don't be naive. Do you think they’ll let you buy low, hold, and sell high without any struggle? If it were that simple, everyone would be rich. But the truth is: 90% of you will lose. Why? Because the crypto market is not designed for everyone to win.
They will shake you. They will make you doubt everything. They will create panic, causing you to sell at the worst possible moment. Do you know what happens next? The best players in this game buy when there’s fear, not sell—because your panic gives them cheap assets.
This is how the game works: strong hands feed off weak hands. They exaggerate every dip, every correction, every sell-off. They make it look like the end of the world so you abandon everything. And when the market rises again, you’re left sitting there asking, “What just happened?”
This is not an accident. It’s a system. The market rewards patience and punishes weak emotions. The big players already know your thoughts. They know exactly when and how to stir fear, forcing you to give up. When you panic, they profit. They don’t just play the market—they play you. That’s why most people never succeed: they fall into the same traps over and over again.
People don’t realize that dips, FUD (fear, uncertainty, doubt), and panic are all part of the plan. But the winners? They block out the noise. They know that fear is temporary, but smart decisions last forever.
We’ve seen this play out hundreds of times. They pump the market after you sell. They take your assets, hold them, and sell them back to you at the top—leaving you with nothing, wondering how it happened.
Don’t play their game. Play your own.
..................................................................................
Give me some energy !!
✨We spend hours finding potential opportunities and writing useful ideas, we would be happy if you support us.
Best regards CobraVanguard.💚
_ _ _ _ __ _ _ _ _ _ _ _ _ _ _ _ _ _ _ _ _ _ _ _ _ _ _ _ _ _ _ _
✅Thank you, and for more ideas, hit ❤️Like❤️ and 🌟Follow🌟!
⚠️Things can change...
The markets are always changing and even with all these signals, the market changes tend to be strong and fast!!

DOGE LongDoge bullish target is 0.5760 level. Current situation is not ideal for buying but after prices retest 0.41 level we can identify how to enter long position.

BTCUSDT H4 : New Roadmap for BITCOIN Hello, Have good day.
After the big news from the US Federal Reserve last night, we saw a relatively sharp decline. I expect this kind of movement in the future.
SecondChanceCrypto
⏰ 8/Jan /25
⛔️DYOR
Always do your research.
If you have any questions, you can write them in the comments below and I will answer them.
And please don't forget to support this idea with your likes and comments.

Doge(based on Neowave)now is the time to buy doge is offering a good price,soon it will start pumping to 4$

DOGEUSDT (1-h)>>> Road mapThe price will reach the top of wedge = 0.39 in the short term.
Give me some energy !!
✨We spend hours finding potential opportunities and writing useful ideas, we would be happy if you support us.
Best regards CobraVanguard.💚
_ _ _ _ __ _ _ _ _ _ _ _ _ _ _ _ _ _ _ _ _ _ _ _ _ _ _ _ _ _ _ _
✅Thank you, and for more ideas, hit ❤️Like❤️ and 🌟Follow🌟!
⚠️Things can change...
The markets are always changing and even with all these signals, the market changes tend to be strong and fast!!

DOGE Update - Market Structure, Key Levels & Trade Opportunities👀 👉 In this video, we analyze DOGE's recent market structure break, driven by strong momentum that hints at institutional interest. 📊 Discover crucial support and resistance zones, identify liquidity areas, and explore potential trade setups based on our findings. Whether you're a seasoned trader or just getting started, this analysis provides valuable insights to enhance your trading decisions. ⚠️ This content is for educational purposes only and does not constitute financial advice.

Dogecoin Whales Buy 140M Coins: Signals of a Price Surge?Dogecoin (DOGE), the beloved dog-themed meme coin, has once again captured the crypto market's attention. Whales, or large-scale investors, have recently acquired 140 million DOGE, sparking optimism and speculations of a significant price rally. W
The Role of Whales and Market Dynamics
In the last 24 hours, Dogecoin whales have embarked on a buying spree, amassing 140 million DOGE tokens. This large-scale accumulation has not only heightened buying pressure but also reinvigorated market enthusiasm.
Adding to the excitement, Elon Musk’s plans for X Money, a payment platform integrated with his social media platform X, have further fueled speculation. The initiative is expected to introduce cryptocurrency support, potentially including Dogecoin, Bitcoin, and Tether (USDT). While official details remain scarce, the parallels to China’s WeChat suggest a transformative use case for Dogecoin in digital payments. This development aligns with Musk’s history of influencing DOGE’s market trajectory, providing a solid fundamental backdrop for optimism.
Technical Analysis
At the time of writing, CRYPTOCAP:DOGE is trading at $0.390, marking a 2.23% intraday increase. The coin’s price action has broken out of a consolidation pattern, forming a bullish engulfing candlestick. This breakout signifies renewed upward momentum, further supported by strong technical indicators:
1. Relative Strength Index (RSI): Currently at 70.55, the RSI suggests that DOGE is in overbought territory. While this indicates strong buying interest, it also calls for caution as a potential retracement may be on the horizon.
2. Fibonacci Retracement Levels: Immediate support lies at the 65% Fibonacci retracement level. This zone serves as a critical threshold for traders, providing a foundation for potential price stabilization before the next upward move.
3. Pivot Points: DOGE’s one-month high at $0.48 is a key resistance level. A breakout above this pivot point could trigger a bullish continuation pattern, potentially paving the way for a price surge.
DOGE’s technical and fundamental landscape suggests a bullish trajectory. If whales continue their accumulation spree and Musk’s X Money initiative gains traction, DOGE could easily surpass the $0.48 resistance level. From there, the next significant target would be a 70% rally, pushing the price closer to $0.60 or beyond.
However, traders should remain vigilant. The overbought RSI indicates the possibility of short-term pullbacks, offering strategic entry points for long-term holders. Monitoring the 65% Fibonacci retracement level as immediate support and the $0.48 pivot point as resistance will be crucial in navigating DOGE’s next moves.
Conclusion
Dogecoin’s recent whale activity and promising fundamental developments signal a potentially explosive period for the meme coin. With massive gain on the horizon, driven by strong market dynamics and technical indicators, DOGE is set to remain a focal point for traders and investors alike. As always, market participants should balance optimism with caution, ensuring informed decisions in the ever-volatile crypto landscape.

DOGE Paws and Reflect: corrective or new impulse?If you find this information inspiring/helpful, please consider a boost and follow! Any questions or comments, please leave a comment!
DOGE’s recent price action has us wagging our tails in anticipation. However, the current pattern suggests that the bulls might need to sniff out some serious momentum to keep upward continuation on track. With the potential triangle pattern now behind us, here’s where DOGE stands:
### Key Levels to Watch
1. **0.35 - The Ideal Bone to Chew On:**
This level is the sweet spot for maintaining a bullish outlook. If DOGE can hold 0.35, it keeps the door open for a potential rebound and a chance to bark back at resistance.
2. **0.30 - The Last Leash for Bulls:**
Should 0.35 slip through the paws, 0.30 becomes the final defense. A drop below this level could leave the bulls chasing their tails as bearish momentum takes hold.
3. **0.41 - The Alpha Level:**
This is the key resistance zone. If DOGE can break above 0.41, it could mark the start of a new upward sprint. A rejection here or below the level, however, might have the bears howling with delight.
### Scenarios to Consider
- **Bullish Continuation:**
DOGE breaks free above 0.41, signaling that the bulls are back in the driver’s seat, possibly targeting new highs.
- **Bearish Breakdown:**
A failure to hold 0.35 or a deeper slip below 0.30 would likely mean DOGE is heading into a doghouse of corrections, with bearish momentum wagging its tail all the way down.
### Final Thoughts
The DOGE pack is at a critical crossroads, and the next moves will define whether the bulls can retrieve control or if the bears are about to sink their teeth into the action. Stay sharp, keep your levels in focus, and don’t let this market collar you.

doge buylimit "🌟 Welcome to Golden Candle! 🌟
We're a team of 📈 passionate traders 📉 who love sharing our 🔍 technical analysis insights 🔎 with the TradingView community. 🌎
Our goal is to provide 💡 valuable perspectives 💡 on market trends and patterns, but 🚫 please note that our analyses are not intended as buy or sell recommendations. 🚫
Instead, they reflect our own 💭 personal attitudes and thoughts. 💭
Follow along and 📚 learn 📚 from our analyses! 📊💡"

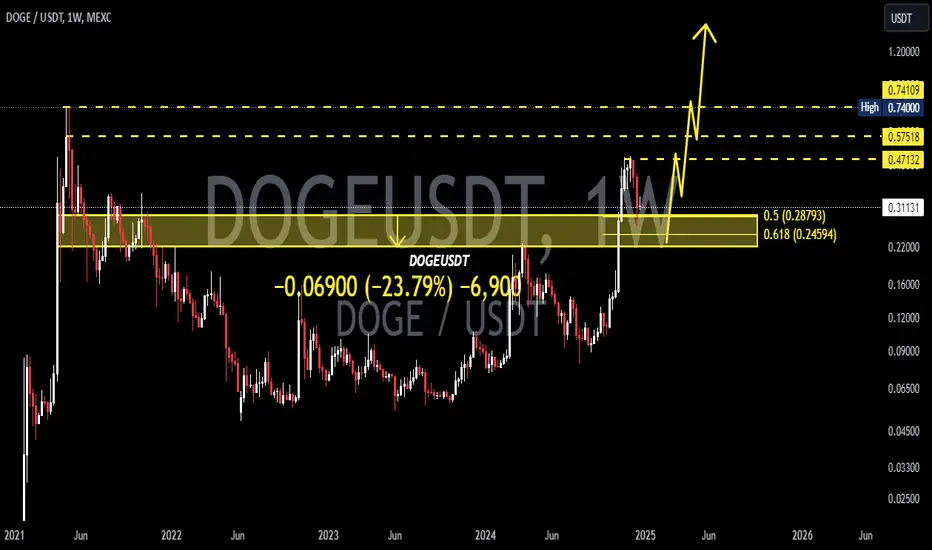
Dogecoin's Potential Resurgence: A Technical and Market AnalysisDogecoin, the meme-inspired cryptocurrency that has captured the attention of investors and enthusiasts alike, has recently shown signs of a potential resurgence. With its weekly Relative Strength Index (RSI) approaching the Moving Average (MA) line and recent price action suggesting fresh highs, the question on everyone's mind is: can Dogecoin resume its uptrend and break its all-time high (ATH) of $0.74? This article delves into the technical analysis, market trends, and underlying factors that could influence Dogecoin's price trajectory.
Technical Analysis: RSI and Price Action
The Relative Strength Index (RSI) is a momentum indicator used in technical analysis that measures the magnitude of recent price changes to evaluate overbought or oversold conditions in the price of a stock or other asset. When the RSI approaches the MA line, it often signals a potential shift in momentum. In Dogecoin's case, the weekly RSI approaching the MA line suggests that the cryptocurrency may be transitioning from a period of consolidation or correction to a renewed uptrend.
Furthermore, recent price action has been encouraging for Dogecoin enthusiasts. The cryptocurrency has shown signs of strength, with price movements suggesting the possibility of breaking through resistance levels and establishing fresh highs above $0.75. This positive price action, coupled with the RSI approaching the MA line, paints a bullish picture for Dogecoin's near-term future.
Market Trends and Influencing Factors
Several factors could be contributing to Dogecoin's recent surge and potential for further growth:
1. Increased Adoption and Utility: Dogecoin has seen increased adoption as a form of payment by various merchants and businesses. This growing utility adds real-world value to the cryptocurrency and could drive demand.
2. Social Media and Community Support: Dogecoin's strong community and social media presence play a significant role in its price movements. Positive sentiment and viral trends can lead to increased buying pressure and price appreciation.
3. Broader Cryptocurrency Market Trends: The overall health of the cryptocurrency market can also impact Dogecoin's price. A bullish trend in the broader market often lifts the prices of various cryptocurrencies, including Dogecoin.
4. Celebrity Endorsements and Influencer Marketing: Dogecoin has benefited from endorsements by celebrities and influencers, which can generate significant buzz and attract new investors.
Can Dogecoin Break its ATH?
While technical indicators and market trends suggest a positive outlook for Dogecoin, breaking its ATH of $0.74 will require sustained momentum and overcoming key resistance levels. The cryptocurrency has faced significant volatility in the past, and it is essential to consider the risks involved.
However, if Dogecoin can maintain its current trajectory, capitalize on positive market sentiment, and continue to grow its adoption and utility, breaking its ATH is a realistic possibility.
Conclusion
Dogecoin's recent price action and technical indicators suggest a potential resurgence for the meme-inspired cryptocurrency. With its weekly RSI approaching the MA line and price movements indicating fresh highs, Dogecoin could be poised for a renewed uptrend.
While breaking its ATH of $0.74 will be a significant challenge, the cryptocurrency's strong community, growing adoption, and positive market trends could provide the necessary impetus. As always, it is crucial to conduct thorough research and exercise caution when investing in cryptocurrencies, considering the inherent risks and volatility of the market.

DOGEUSDT: A Fantastic Blue Box Zone! DOGEUSDT: A Fantastic Blue Box Zone! 🐕🚀
Why This Zone Matters:
Prime Entry Opportunity: The blue box is an exceptional demand area, meticulously identified using advanced tools.
Strategic Setup: Perfectly positioned to capture a strong reaction, especially in current market conditions.
Learn the Secrets: Detailed education on identifying such zones is available in my profile, check it out and level up!
Reminder: Always confirm with tools like CDV, liquidity heatmaps, and volume profiles for precise entries. Manage your risk wisely and prepare for greatness!
Boost, comment, and follow to stay ahead of the game—together!
Let me tell you, folks, this is amazing. Nobody does analysis like I do. Believe me. If this helps you, don't forget to boost and comment! It’s a big deal, motivates me to share even more winning insights with you. Tremendous insights.
I keep my charts the best, clean, simple, and clear. You know it, I know it, clarity leads to better decisions. No question about it. My approach? Built on years of tremendous experience. Incredible track record. I don’t claim to know it all, but I spot high-probability setups like nobody else. Trust me.
Want to learn how to use the heatmap, cumulative volume delta, and volume footprint techniques I use to determine demand regions with stunning accuracy? Send me a private message—totally free, folks. That’s right. I help anyone who wants it, absolutely no charge. Unbelievable value.
Here’s the list, long list, great list, of some of my previous incredible analyses. Each one, a winner:
🎯 ZENUSDT.P: Patience & Profitability | %230 Reaction from the Sniper Entry
🐶 DOGEUSDT.P: Next Move
🎨 RENDERUSDT.P: Opportunity of the Month
💎 ETHUSDT.P: Where to Retrace
🟢 BNBUSDT.P: Potential Surge
📊 BTC Dominance: Reaction Zone
🌊 WAVESUSDT.P: Demand Zone Potential
🟣 UNIUSDT.P: Long-Term Trade
🔵 XRPUSDT.P: Entry Zones
🔗 LINKUSDT.P: Follow The River
📈 BTCUSDT.P: Two Key Demand Zones
🟩 POLUSDT: Bullish Momentum
🌟 PENDLEUSDT.P: Where Opportunity Meets Precision
🔥 BTCUSDT.P: Liquidation of Highly Leveraged Longs
🌊 SOLUSDT.P: SOL's Dip - Your Opportunity
🐸 1000PEPEUSDT.P: Prime Bounce Zone Unlocked
🚀 ETHUSDT.P: Set to Explode - Don't Miss This Game Changer
🤖 IQUSDT: Smart Plan
⚡️ PONDUSDT: A Trade Not Taken Is Better Than a Losing One
💼 STMXUSDT: 2 Buying Areas
🐢 TURBOUSDT: Buy Zones and Buyer Presence
🌍 ICPUSDT.P: Massive Upside Potential | Check the Trade Update For Seeing Results
🟠 IDEXUSDT: Spot Buy Area | %26 Profit if You Trade with MSB
📌 USUALUSDT: Buyers Are Active + %70 Profit in Total
🌟 FORTHUSDT: Sniper Entry +%26 Reaction
🐳 QKCUSDT: Sniper Entry +%57 Reaction
📊 BTC.D: Retest of Key Area Highly Likely
And that’s just the start. The list goes on and on, folks. It’s a tremendous list, the best. I stopped adding because, frankly, it’s tiring. So many wins. People are amazed. You can check my profile and see for yourself, winning moves, all the time. Believe me, nobody does it better.

Expect More Gain with DOGECOIN: 0.54 Level Is uploading Hello and greetings to all the crypto enthusiasts, ✌
In several of my previous analyses, I have accurately identified and hit all of the gain targets. In this analysis, I aim to provide you with a comprehensive overview of the future price potential for DOGECOIN, 📚💡
A 57% price surge for the coin seems likely, though brief bearish pullbacks or consolidation phases may occur first, which often happen before a major rally. Key support levels have been determined through Fibonacci retracements to manage these fluctuations. Recently, the coin surpassed multiple long-standing resistance points, indicating a shift in market sentiment. 📚
This shift is crucial, as the coin gains strength, driven by higher trading volumes and growing social media buzz. This combination signals positive momentum for the coin’s future performance. 📚✨
🧨 Our team's main opinion is: 🧨
A 57% price increase for the coin is likely, though short-term corrections or consolidation may occur first. Key support levels, identified with Fibonacci retracements, and a recent breakout above resistance levels signal growing market momentum, supported by rising trading volumes and social media attention.
Give me some energy !!
✨We invest countless hours researching opportunities and crafting valuable ideas. Your support means the world to us! If you have any questions, feel free to drop them in the comment box.
Cheers, Mad Whale. 🐋

DOGE Rally: Key Levels, Liquidity Zones & Trade Opportunities👀💡 In this video, we take an in-depth look at DOGE. The analysis reveals that DOGE has broken market structure with significant momentum, suggesting strong institutional interest. We explore key support and resistance levels, identify areas of liquidity, and discuss potential trade opportunities. As always, this content is for educational purposes only and should not be considered financial advice. 🚀

Dogecoin Price Confirms Breakout: Analyst Sets New Price Targets
Dogecoin (DOGE), the original meme coin that captured the imagination of the crypto world, has recently shown signs of a significant breakout, prompting analysts to revise their price targets.2 After a period of relative stagnation, Dogecoin has demonstrated renewed momentum, breaking through key resistance levels and signaling a potential shift in market sentiment.3 This article explores the factors contributing to this breakout, the significance of the new price targets, and the broader context of Dogecoin's place in the evolving cryptocurrency landscape.
Understanding the Breakout
In technical analysis, a breakout occurs when the price of an asset moves decisively above a key resistance level or below a key support level.4 These levels are identified by analyzing historical price data and represent areas where the price has previously struggled to move past.5 A breakout signifies a potential change in the prevailing trend, suggesting that the asset is likely to continue moving in the direction of the breakout.6
Dogecoin's recent price action has confirmed a breakout above a significant resistance level, indicating strong buying pressure and a potential shift from a bearish or sideways trend to a more bullish outlook. This breakout is a crucial development for Dogecoin holders, as it suggests that the cryptocurrency may be poised for further gains.
Factors Contributing to the Breakout
Several factors could be contributing to Dogecoin's recent resurgence. While attributing specific causes in the volatile crypto market can be challenging, a combination of influences likely plays a role:
• Renewed Community Engagement: Dogecoin has a strong and dedicated community that has been instrumental in its past successes.7 Renewed engagement and activity within the community can contribute to increased awareness and demand for the cryptocurrency. Online discussions, social media campaigns, and community-driven initiatives can all contribute to positive price movement.
• Broader Market Sentiment: The cryptocurrency market is often influenced by the overall sentiment surrounding Bitcoin and other major cryptocurrencies.8 When the market experiences a general uptrend, altcoins like Dogecoin can also benefit from the positive momentum. The current market conditions may be contributing to the renewed interest in Dogecoin.
• Potential Integrations and Adoption: While still primarily known as a meme coin, Dogecoin has seen some instances of adoption for payments and other use cases.9 Any news or speculation regarding further integrations or adoption by businesses or platforms can contribute to positive price action.
• Whale Activity: Large holders of Dogecoin, often referred to as "whales," can have a significant impact on the cryptocurrency's price. Large buy orders from whales can trigger significant price movements, contributing to breakouts and rallies.
Analyst Price Targets: A Sign of Confidence
Following Dogecoin's confirmed breakout, several analysts have revised their price targets for the cryptocurrency.10 These price targets represent predictions of where the price of Dogecoin could move in the near to medium term.11 While these targets are not guarantees, they reflect the analysts' assessment of the current market conditions and Dogecoin's potential.
The new price targets set by analysts indicate a growing confidence in Dogecoin's potential for further growth. These targets can act as psychological levels for traders and investors, influencing their trading decisions and contributing to market momentum.
The Significance of Dogecoin in the Crypto Landscape
Dogecoin occupies a unique position in the cryptocurrency world. It originated as a lighthearted joke but has since evolved into a significant player in the market.12 Its strong community, low transaction fees, and relatively fast transaction times have contributed to its popularity.13
While often dismissed as a meme coin, Dogecoin has demonstrated its resilience and ability to generate significant price movements.14 Its continued presence in the market highlights the dynamic and unpredictable nature of the cryptocurrency space.
Challenges and Future Outlook
Despite the recent breakout and positive price targets, it's important to acknowledge the challenges that Dogecoin may face. The cryptocurrency market is highly volatile, and sudden price swings are always a possibility.15 Dogecoin's reliance on community sentiment and social media hype can also make it susceptible to rapid changes in market dynamics.
Furthermore, Dogecoin faces competition from other cryptocurrencies with more advanced technology or specific use cases. Its long-term success will depend on its ability to evolve and adapt to the changing landscape of the cryptocurrency market.
However, the recent breakout and the positive price targets set by analysts suggest that Dogecoin still has the potential for further growth. The cryptocurrency's strong community and unique position in the market could contribute to its continued success.
Conclusion
Dogecoin's confirmed breakout represents a significant development for the cryptocurrency.16 The factors contributing to this breakout include renewed community engagement, broader market sentiment, potential integrations, and whale activity. The new price targets set by analysts reflect a growing confidence in Dogecoin's potential. While challenges remain, the cryptocurrency's unique position and strong community could contribute to its continued success in the evolving cryptocurrency landscape.

Doge(based on NEo wave)f wave of bow tie diametric is expanded so g wave shouldn't be too strong and also we can forget that bigger triangle and WXY is a better counting.

DOGE Dip Incoming? Perfect Entry Below 30cCRYPTOCAP:DOGE
I'm expecting a stronger retrace, although CRYPTOCAP:BTC is holding up extremely well at the moment.
This is just a preparation in case it happens.
Given the current strength of the market, it might not occur, but levels below 30c present excellent entry points.
I anticipate this idea to remain valid only within this month.

DOGE What will happen in the short term ?According to my calculations, the price will reach 0.32 in the short term.
Give me some energy !!
✨We spend hours finding potential opportunities and writing useful ideas, we would be happy if you support us.
Best regards CobraVanguard.💚
_ _ _ _ __ _ _ _ _ _ _ _ _ _ _ _ _ _ _ _ _ _ _ _ _ _ _ _ _ _ _ _
✅Thank you, and for more ideas, hit ❤️Like❤️ and 🌟Follow🌟!
⚠️Things can change...
The markets are always changing and even with all these signals, the market changes tend to be strong and fast!!

Doge(based on NEo wave)last counting failed but there is these 2 bullish scenarios for doge and I think soon we will see a dog which can fly!
one of the ways is complex corrective wave which contains WXY waves and the other one is triangle with ABCDE waves.
in short term the bow tie diametric with G wave (which is not formed yet), I prefer to buy more on G wave.

Dogecoin Analysis: Weak Uptrend or Correction Ahead?### 📊 Comprehensive Technical Market Analysis
---
### 🟢 Overall Market Trend
The ADX (Average Directional Index) shows a value of 12.42, indicating a weak trend. With +DI = 25.72 and -DI = 17.30, the market exhibits a weak upward trend.
- **Operational Insight:**
Given the low ADX value, this uptrend lacks the strength to develop into a solid movement. Traders should watch for potential pattern breakouts and carefully set their entry/exit points.
---
### 📉 Overbought and Oversold Conditions
- **RSI (Relative Strength Index):** A value of 59.54 indicates a neutral state, with the market neither overbought nor oversold.
- **Stochastic Oscillator:** With K = 88.24, the market is in the overbought zone, though it has slightly decreased from the previous candle's 93.58.
- **Insight:** Stochastic signals a potential short-term price correction.
⛔ **Implications:**
Overbought conditions (high Stochastic values) suggest a likelihood of short-term corrections. Traders may consider this an opportunity to exit or adjust their stop losses.
---
### 📈 Moving Averages Analysis (MA)
- **Short- and Long-Term Moving Averages:**
- Short-term MAs (10-, 20-, and 50-day) are above the long-term 200-day MA, signaling bullish momentum.
- EMA200 = 0.3362 and SMA200 = 0.3332 are below the closing price (0.325).
✔️ **Operational Insight:**
While the long-term outlook remains bearish, the current short-term trend is upward. Short-term traders may find buying opportunities, but strict stop-loss placement is essential.
---
### 🔍 Key Indicator Analysis
- **MACD (Moving Average Convergence Divergence):**
- The MACD line is above the signal line (0.0015 > 0.0005), issuing a buy signal.
- **CCI (Commodity Channel Index):** A value of 144.64 indicates an overbought condition.
- **Momentum Indicator:** A reading of 0.0065 reflects a strong downward pressure.
🎯 **Overall Signal:**
While MACD supports buying, CCI and Momentum warn of short-term price declines. Short-term traders should proceed with caution.
---
### 🛑 Key Support and Resistance Levels
- **Classic Pivot Levels:**
- **Supports (S1, S2):**
- S1: 0.297
- S2: 0.280
- **Resistances (R1, R2):**
- R1: 0.336
- R2: 0.359
- **Fibonacci Levels:**
- **Support 1:** 0.304
- **Resistance 1:** 0.334
✨ **Actionable Recommendation:**
- **Entry (Buy):** Near support at 0.304
- **Target (TP):** Around 0.336 or 0.359
- **Stop Loss (SL):** 0.280 (if key supports are breached)
---
### ✅ Summary and Recommendations
Under the current market conditions:
- **For Short-Term Traders:** The MACD buy signal and bullish short-term MAs suggest opportunities to buy near support levels.
- **For Long-Term Traders:** The weak upward trend and overbought conditions suggest waiting for corrections or stronger signals before entering.
🔔 **Recommendation:** Enter buying positions cautiously, with tight stop losses and well-defined profit targets.
⚠️ **Disclaimer:**
This analysis was fully generated by AI and is for educational and informational purposes only. Always consult your own expertise or a financial advisor before trading.

DOGE & ELON The price of Dogecoin is $0.09 today with a 24hour trading volume of 770 million dollar . This represents a 10% price increase since last week and 22% price increase since last month
Musk's tweet offering 1 million Dogecoin to anyone who could prove ownership of an emerald mine has led to gains of 4.9% and who can forget when he changed the Twitter logo to feature the Shiba Inu dog, which caused another 30% pump
while Dogecoin's technical structure is bullish, there is a lack of buying pressure behind the coin. traders should be cautious and consider waiting for a break in structure on lower timeframes before seeking to enter short positions. daily active addresses have increased as social media buzzed about Dogecoin, but the 90-day mean coin age has been sliding downward since mid-March.
Dogecoin bounced off the moving averages on April 12, as seen from the long tail on the day’s candlestick. The bulls tried to drive the DOGE/USDT pair above the 38.2% Fibonacci retracement level of $0.09 but the bears did not budge. This suggests that the sentiment remains negative and traders are selling on rallies. Buyers must push and sustain the price above $0.09 to indicate that the selling pressure may be reduced. The pair may then ascend to the 61.8% retracement level of $0.10. Usually, a break and close above this level results in a 100% retracement. If that happens, the pair may soar to $0.11.

DOGEUSDT 1WDOGE Update ~ 1W
#DOGE So far it still maintains its Bullish structure,. This is wave 2 of the Eliot Wave pattern. Buy gradually within this support block with a minimum target of 20+