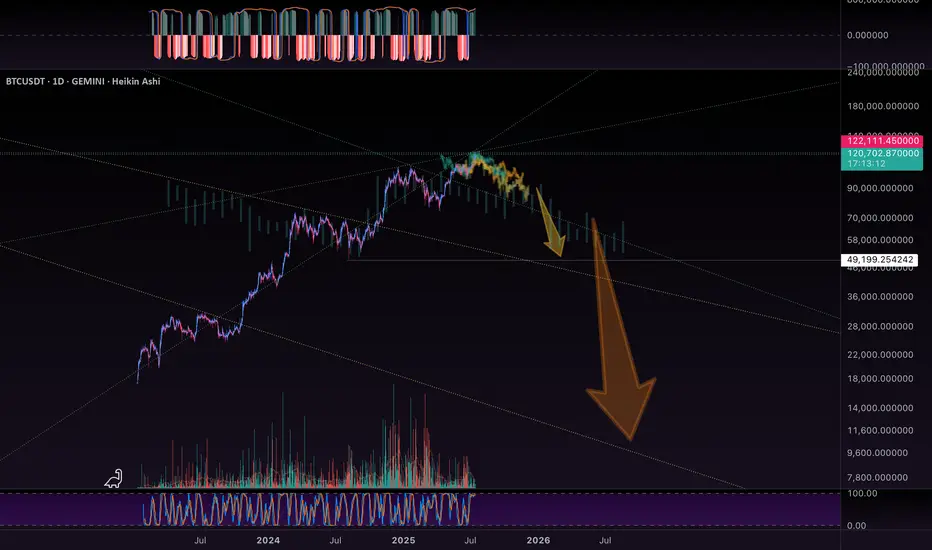
BTC - Historic Levels to CheckBTC has some checking in to do…. On historic resistance levels…
I drew in the major ones visible on this chart… and the initial bearish fractal, which was shown to us previously int he chart.
It will fractal for each arrow.
Pump and Dump!
Im going to run my DOGe.
See my linked post below for a bigger picture view of all this.
Dogeusdt
DOGE! _ RISK it ! Get itSince ages! Ive never seen such beautiful movement of charts and so is doge, lots of liquidity to get captured! Hopefully it gets done as I marked!

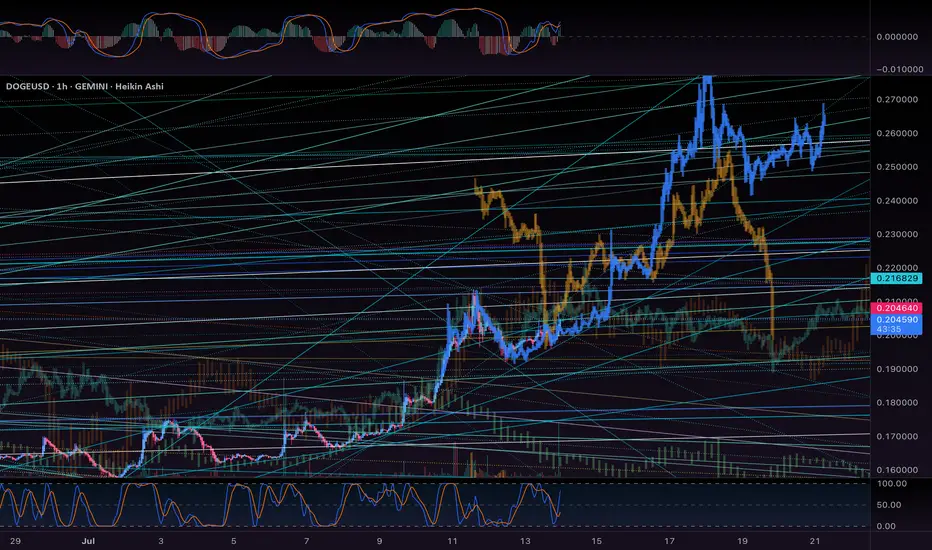
DOGE - Running your DOG.These traces represent a few of the prominent behaviors we would expect to see from our beloved DOGe.
As you can see, the orange traces Bearish leg leading into this is fit is much larger than our actual moves… indicating the Bulls are gaining strength. This pattern is matched harmonically to the relevant expansion / contraction patterns, and signature moves. Harmonically… in time. Shifted, in amplitude.
Blue trace is the bull run fractal we would expect to see propagate from the initial moves in this run. As we scale this trace to fit, it gains amplitude, indicating a strong bullish favor, and showing the chorus for an exponential run, as it continues to propagate.
DOGe is famous for its huge runs.
DOGe also assimilates unconditional LOVE… that humans share with DOG’s. Loyalty too…
As such, we expect DOGE to avoid any major corrections or market collapse sell offs. It’s like the emotional safe haven in the games of Fear vs Greed that is all other coins.
Also… check out the longer range analysis linked below. It’s a look at the 2W candle, and the all time chart… 10 years of data!
Let’s Go, Boy!
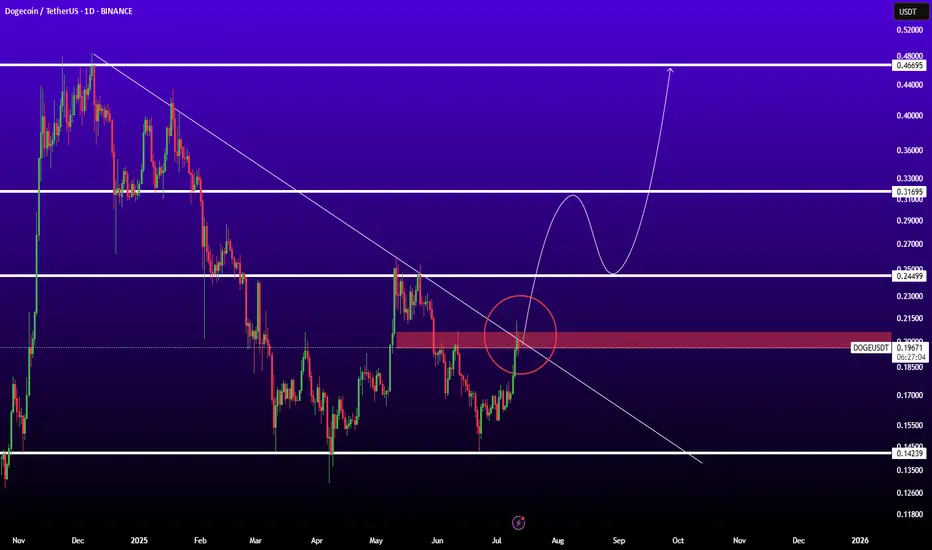
Check if there is an upward breakout of 0.21409-0.22958
Hello, traders.
If you "Follow", you can always get the latest information quickly.
Have a nice day today.
-------------------------------------
(DOGEUSDT 1D chart)
HA-High and HA-Low indicators are converging.
Accordingly, if it breaks through the 0.21409-0.22958 section, it is expected to surge.
However, since the DOM(60) indicator is formed at the 0.46635 point, we need to look at how the DOM(60) indicator is newly created.
It seems possible that the DOM(60) indicator will be newly created while shaking up and down in the 0.21409-0.31600 section, which is the HA-High indicator ~ DOM(60) indicator section of the 1M chart.
If the DOM(60) indicator is newly created, we need to check whether it is supported in the HA-High ~ DOM(60) section.
If it rises above the HA-High ~ DOM(60) section, it is likely to show a stepwise upward trend.
-
To summarize the above, it is as follows. - Buy range: 0.16343-0.22958
- Resistance range: 0.31600-0.37778
If the price breaks through the resistance range upward and maintains, there is a high possibility that the upward trend will continue in the medium to long term.
-
Thank you for reading to the end.
I hope you have a successful transaction.
--------------------------------------------------
- Here is an explanation of the big picture.
(3-year bull market, 1-year bear market pattern)
I will explain the details again when the bear market starts.
------------------------------------------------------

DOGE/USDT Breakout Theft Plan| Smart Entry + Exit| Bullish Bias🐶💰 DOGE/USDT Master Heist Plan – The Bullish Breakout Robbery! 💸🔓
(Thief Trading Style – Steal Profits, Not Dreams)
🌟Hello, Hola, Ola, Bonjour, Hallo, Marhaba!🌟
To all the fearless Market Movers & Silent Operators out there – welcome to another strategic DOGE raid guided by technical precision and macro-level insight! 📈🧠
🔐 The Game Plan – Let’s Break the Bank!
This chart outlines our long-entry mission for DOGE/USDT, based on a unique Thief Trading Style strategy. The market currently shows bullish momentum, setting the stage for an upside breakout—but not without traps! Stay sharp.
💥 Key Concepts at Play:
Pullback Zones = Entry Points (Mark the lows, grab the loot)
ATR Line Zone = High-Risk Area (Time to plan your exit)
Reversal & Consolidation Zones = Watch for fakes & traps
News Events = Potential market detonators – keep your stop-loss close
📍Entry Point – "The Vault’s Open!"
💰 Plan A: Instant execution for those already prepped.
📉 Plan B: Place Buy Limit Orders near recent 15–30 min swing lows for a stealthier entry during pullbacks.
🚨Stop-Loss Setup – Safety First, Always
📍 Recommended SL: Near the 2H swing low (around 0.15500)
🛡️ Adjust based on your personal risk, account size, and trade volume. Thieves plan smart—never go in blind.
🎯Target – Clean the House and Vanish
🎯 Primary Target: 0.18500
⚠️ Exit early if market conditions shift. The first rule of the game? Don’t get greedy.
⚡Scalpers’ Mode – Hit & Run
Only trade LONG setups. Whether you’re a heavy hitter or playing it safe, stick with the bulls. Use trailing SL to protect the bag.
📊Why This Heist Works – Under the Hood
The DOGE/USDT setup is driven by:
✅ Bullish sentiment
✅ Fundamental trends
✅ Macro drivers
✅ On-chain activity & intermarket signals
✅ COT Reports & future momentum indicators
(For full breakdown, check linkkied data 👉🔗🔍)
📡News & Risk Management Reminder
🚫 Avoid opening fresh trades during high-volatility news events.
📉 Always trail your stop to secure profits during live positions.
Adapt fast – the market changes in a blink.
❤️Support The Plan
💥 Smash the Boost button to help spread the Thief Trading Style across the platform! Let’s make smart money together, one chart at a time. Every like, comment, and follow powers the next move. 💪💵🚀
🔔 More Heist Plans Coming Soon – Stay connected, stay dangerous... and stay profitable.
🐱👤Until then – Trade Smart. Trade Thief. Make Your Mark. 💸

DOGEUSDTBINANCE:DOGEUSDT is in good level for pump because if breaked trendline and resistance 0.200$ ready for sharp movement to next levels.
Resistances: 0.25 - 0.32 - 0.45
Support: 0.15
DOGE's Situation, A Comprehensive Analysis !!!The price on the 3D timeframe is within an ascending triangle, which can be promising. If the price breaks this pattern with bullish candles, it could easily rise by the distance of AB=CD .
Best regards CobraVanguard.💚

DOGE's Situation, A Comprehensive Analysis (1h) !!!The price on the 1-hour timeframe is within an ascending triangle, which can be promising. If the price breaks this pattern with bullish candles, it could easily rise by the distance of AB=CD .
Best regards CobraVanguard.💚

Dogecoin Prepares 2025 Bullish Wave · New All-Time HighThe last time that Dogecoin produced strong bullish action was November 2024, more than 217 days ago. Before this wave, there was a small period of growth in early 2024 and that's about it, the market was bearish for a long-time after the 2021 all-time high. There is good news though. Dogecoin is preparing for a new major bullish cycle and this cycle is already in place.
Since mid-March 2025 the action has been weak. No growth but no decline either. Between May and June, there were more than 8 weeks of bearish action but Dogecoin's price remains strong within a mid-term higher low. The last three weeks have been green with this week being full green trading at the top of the candle, the market is about to produce a major advance.
If you look back to October 2024, late, you will see small candles then several huge big candles, maximum growth. That's how Crypto tends to operate. One day the market is silent, the next day we are witnessing the strongest ever bullish wave. This is what Dogecoin is getting into right now.
If you look back to early 2021 it is the same. Late March and early April 2021 we have very small candles and then everything changes suddenly and the market produced astonishing growth. We are on the verge of such an event, the 2025 bull market phase and bull run. Get ready and prepare for a new all-time high.
Namaste.

Dogecoin Daily, A Closer View · Next Target, How To Trade & MoreYesterday Dogecoin moved above EMA89, a major long-term moving average. Definitely bullish confirmed. We are giving Dogecoin a closer look because the other chart was based on the long long-term, the weekly timeframe. With this one, we will know exactly what happens next.
Today, DOGEUSDT is moving above EMA233 and this one is super long-term. Immediate resistance is found at 0.21300 but this is likely to break right away, always allowing for a few days of fluctuation because the market never moves straight down nor straight up. It fluctuates creating waves.
The next target after this one is 0.26500 followed by 0.34900. These can be hit short-term. In the coming weeks and days. After this one, we will aim at the last high which happened December 2024, now already a long-time ago.
The altcoins market is bullish but this bullishness is very early, it is only getting started. The market will be bullish for such a prolonged period of time that you will get used to seeing bullish action and at one point will become comfortable seeing your profits grow. When this happens, stay alert and make sure to secure some wins on the way up.
Do not chase rising pairs, buy those trading near support. Buy and hold.
This is the best strategy for maximum profits. Also, if you catch a winner, let it ride long-term. This also produces bigger profits in the end vs selling and trying to catch the retrace to buy again. It is better to buy big when prices are low and hold long-term. Only secure some profits when you are really high up, after 2-3 months. And of course, when the time for the new all-time highs is close, that's the time to close all positions.
Thanks a lot for your continued support.
Namaste.

DOGE/USDT – Is Dogecoin About to Ignite Altseason Again?Hey Traders!
If you’re finding value in this analysis, smash that 👍 and hit Follow for high-accuracy trade setups that actually deliver!
Dogecoin just broke out of a multi-month descending wedge — and history tells us to pay close attention when this meme king wakes up. Let’s dive into why this setup could be the start of something massive.
📈 Chart Pattern
DOGE has been consolidating for months inside a falling wedge — a classic bullish reversal structure. It’s now finally broken out with strong volume confirmation, holding above the 50 EMA and showing signs of momentum building up.
🔍 Historical Clue
Remember what happened in the previous bull markets?
✅ 2021: DOGE exploded 2000%+ and triggered the craziest altseason ever.
✅ 2017: DOGE moved first, followed by hundreds of altcoins rallying massively.
Now, in 2025 — it looks eerily similar. Every time DOGE wakes up, it signals that retail and meme sentiment is heating up, a classic altseason ignition.
🎯 Trade Setup
Entry: $0.198 (Already triggered)
Targets:
TP1: $0.28
TP2: $0.42
TP3: $0.64
Stoploss: $0.162
Risk-Reward: Massive upside potential, with clearly defined invalidation.
💡 Final Thoughts
Altcoins are starting to follow. ETH has broken out. XRP is running. BTC dominance has rejected trendline resistance. Everything is aligning. If history repeats, this breakout in DOGE could mark the official start of Altseason 2025.
👉 Don’t sleep on DOGE. This might just be the trigger we’ve been waiting for.
📌 Follow for more setups & insights. Stay tuned!

More DOGE - More WOWThe most probable trade of the morning times from Masta Crypta! with small sl like a sling shot!

DOGEUSDT - near support? Holds or not??#DOGEUSDT... market just reached near his supporting area even ultimate area. That is around 0.10 and current market price is around 0.15
If market holds current supporting area then we can expect a bounce from here.
Below 0.10 we will never see again bounce ... Note that.
Good luck
Trade wisely

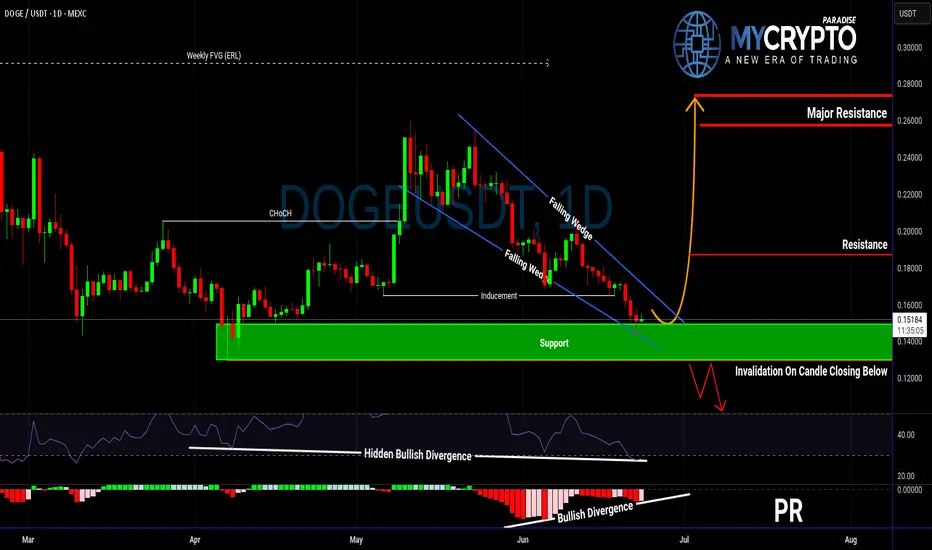
Is DOGE About to Explode or Collapse?Yello Paradisers! Are you ready for what could be DOGE’s most explosive move in weeks? DOGEUSDT is currently developing a very interesting bullish setup that deserves attention.
💎The pair has formed a falling wedge — a pattern that often precedes a breakout to the upside. This comes right after a confirmed bullish Change of Character (CHoCH), indicating that buyers are quietly stepping back in.
💎Even more important, we’ve seen a classic inducement grab, meaning early liquidity has been taken out, clearing the way for a potential real move. On top of that, there’s hidden bullish divergence on the RSI and clear bullish divergence on the MACD. This combination of signals significantly increases the probability of a bullish reversal from the current support zone.
💎If DOGE prints a convincing bullish candlestick pattern at these levels, it could offer a high-probability long opportunity with a strong risk-to-reward ratio. But be careful — if the price breaksdown and closes candle below this key support, the bullish scenario becomes invalid, and it’s better to wait for a more favorable structure to develop.
Strive for consistency, not quick profits. Treat the market as a businessman, not as a gambler. This is the only way you will make it far in your crypto trading journey. Be a PRO.
MyCryptoParadise
iFeel the success🌴
#DOGE/USDT Long Swing Setup #DOGE
The price is moving within a descending channel on the 1-hour frame, adhering well to it, and is on its way to breaking it strongly upwards and retesting it.
We have a bounce from the lower boundary of the descending channel, this support at 0.1660.
We have a downtrend on the RSI indicator that is about to break and retest, supporting the upside.
There is a key support area in green at 0.16200, which represents a strong basis for the upside.
Don't forget one simple thing: ease and capital.
When you reach the first target, save some money and then change your stop-loss order to an entry order.
For inquiries, please leave a comment.
We have a trend of stability above the Moving Average 100.
Entry price: 0.17120
First target: 0.17420
Second target: 0.17788
Third target: 0.18250
Don't forget one simple thing: ease and capital.
When you reach the first target, save some money and then change your stop-loss order to an entry order.
For inquiries, please leave a comment.
Thank you.

DOGE Long Swing Setup – Musk-Fueled Hype & Political BuzzElon Musk’s launch of the “America Party” is reigniting interest in his potential impact on crypto—especially Dogecoin. With his history of moving DOGE’s price, this political pivot could stir volatility and renewed upside. We’re watching for a dip into the $0.15–$0.16 zone for a possible long entry.
📌 Trade Setup:
• Entry Zone: $0.15 – $0.16
• Take Profit Targets:
o 🥇 $0.19 - $0.20
o 🥈 $0.23 – $0.24
• Stop Loss: Daily close below $0.13

All market will face to fall!All markets are expected to decline, so the focus should be on short positions.

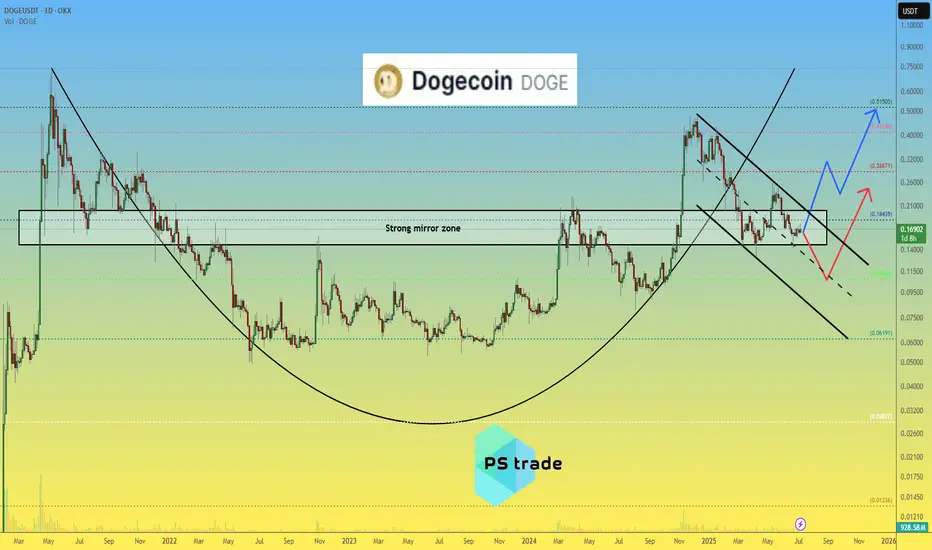
Dogecoin DOGE price analysisCRYPTOCAP:DOGE price is now in the middle of a strong mirror zone of $0.15-0.20
📈 It looks like the position is now accumulating, forming a "double bottom" and then, only a way for growth, to the highs in the region of $0.45-0.50
🐻 On the other hand, the scenario of another "leg" down fits perfectly into the TA canons. That is, it is very likely that if the price of OKX:DOGEUSDT drops below $0.15, then it is already fall to $0.10)
P.S.:
#Doge is an interesting asset, it is worth watching with one eye, and with the other eye, watch how the "battle" between Trump and Musk (who is the main influencer and "pumper" of #Dogecoin) will end.
💡 And then put the two pieces of information together and make a trading decision - "easy money" !)
_____________________
Did you like our analysis? Leave a comment, like, and follow to get more
DOGEUSDT Buy Long SetupWait for entry, if the tp hits first, then ignore the trade, I will share new entry.

Doge Buy / Long SetupDoge has some Bullish Momentum, Invalidation if 4hrs closes below the mentioned point, then close on entry, otherwise wick doesn't matter. If tp achieved first then Cancel the trade.

Much DOGE Much WOW!DOGE will caught you on the guard to eat you! Beware! You know the direction well! Its a well liq hump!

Trending Tokens Are Traps they Destroy your Portfolios🚨 Why Everyone Falls for Trending Projects That End in Disaster
Have you ever bought a token just because everyone was talking about it?
And the moment you jumped in, it started crashing?
This isn’t a rare story; it’s a repeating trap. But why does our brain love buying at the worst possible moment?
Hello✌
Spend 3 minutes ⏰ reading this educational material.
🎯 Analytical Insight on Dogecoin:
BINANCE:DOGEUSDT is currently forming a tight price structure, resembling a compressed spring just below a key daily resistance and trendline. A clean breakout above this area, supported by volume, could trigger a strong bullish continuation, with a projected upside of approximately 30 percent toward the 0.21 level. Traders should monitor this setup closely for confirmation before entering any positions. 📈🐶
Now , let's dive into the educational section,
💸 Trend Equals Triggering Your Greed
Trending coins don’t just pump prices; they pump emotions. One word: FOMO. Fear of missing out makes us ditch logic, ignore risk, and buy because it feels like everyone else is making money. That’s when the trap is set.
🧠 The Market Forgets, But You Shouldn’t
The crypto space is littered with the graves of hyped-up tokens. The cycle is always the same: quick pump, viral noise, massive retail entry, then a violent crash. The names may change, but the pattern doesn’t.
📊 Practical TradingView Tools to Spot Sketchy Trends
Before you click that “Buy” button just because something is trending, take a breath and open your charting tools. Here's a shortlist of powerful features you can use on TradingView that’ll help you filter out dangerous pump tokens:
Volume Profile: Shows where real smart money sits. If most volume spikes near the top, chances are whales are exiting.
RSI (14) : If RSI is above 70 and climbing with no pullback, odds are you're catching it too late.
Anchored VWAP: Anchor it at the start of the trend and see how far price has stretched from rational levels.
Stochastic RSI: Sharp crosses in overbought zones equal major risk signals.
Make it a habit to cross-check multiple timeframes with these tools. Blindly following trends without analysis? That’s how portfolios get burned.
🧪 Pre-Entry Checklist That Could Save You
If something feels “too hot to miss,” ask yourself:
Is the chart readable, or just a straight line up?
Are there healthy pullbacks or just blind momentum?
Is volume spiking only at the top?
Does the project show signs of organic market interest?
Do your TradingView tools confirm a smart entry?
Stick to this list, and you’ll avoid being just another exit-liquidity victim.
🕵️ Spotting Fake Pumps Before It’s Too Late
Here are the red flags no one talks about but every rug has them:
Massive vertical candles in low timeframes
Chaotic candlestick structures with no rhythm
Sharp volatility without any legit updates
Sudden spikes in follower hype and buzz
Real analysts don’t get excited when everyone else is; they start questioning why.
💥 Even Pro Traders Get Caught
Yes, even experienced traders can fall for a perfectly staged hype cycle. Why? Because human brains are wired to chase the crowd. That’s why having a pre-built system is critical. If you rely on gut feelings in a FOMO storm, you’re gambling.
✨ Need a little love!
We put so much love and time into bringing you useful content & your support truly keeps us going. don’t be shy—drop a comment below. We’d love to hear from you! 💛
Big thanks , Mad Whale 🐋
📜Please remember to do your own research before making any investment decisions. Also, don’t forget to check the disclaimer at the bottom of each post for more details.

Dogecoin $0.1725 Next Target ? #DOGE
The price is moving within a descending channel on the 1-hour frame, adhering well to it, and is on its way to breaking it strongly upwards and retesting it.
We have a bounce from the lower boundary of the descending channel. This support is at 0.1624.
We have a downtrend on the RSI indicator that is about to break and retest, supporting the upside.
There is a major support area in green at 0.16000, which represents a strong basis for the upside.
Don't forget a simple thing: ease and capital.
When you reach the first target, save some money and then change your stop-loss order to an entry order.
For inquiries, please leave a comment.
We have a trend to hold above the 100 Moving Average.
Entry price: 0.1656
First target: 0.1682
Second target: 0.1713
Third target: 0.1752
Don't forget a simple thing: ease and capital.
When you reach the first target, save some money and then change your stop-loss order to an entry order.
For inquiries, please leave a comment.
Thank you.
