Everything Looks Fine Until You're Liquidated Ever felt like the market is calm and steady, then boom — everything crashes?
Everything seems fine … until one liquidation candle slaps you awake.
This analysis explores how the illusion of safety can destroy your capital — and how to use TradingView tools to stay ahead.
Hello✌
Spend 3 minutes ⏰ reading this educational material.
🎯 Analytical Insight on Dogecoin:
If Dogecoin fails to gain at least 30% in the next two weeks—while Bitcoin continues to rally—this divergence could signal a broader market weakness. When BTC outperforms and altcoins lag, it often reflects declining risk appetite and potential capital rotation out of speculative assets. A move toward the $0.25 target is key for confirming bullish continuation across the altcoin sector. 📉
Now , let's dive into the educational section,
🧠 The Illusion of Safety: Silent Capital Killers
The biggest risk in trading is when things “seem fine.” A quiet chart is often the calm before the liquidation storm. Don't get cozy.
📍 TradingView Tools That Could Save You 🛠️
When the market feels safe, that’s exactly when danger starts brewing.
This is where TradingView’s tools come into play as your best defense.
First up: Volume Profile V isible Range. It reveals exactly where big players entered and where liquidity is building up.
Right near these zones, you’ll often find fake breakouts and whale traps.
Next: Fixed Range Volume Profile — great for identifying volume clusters within specific price ranges. If volatility shrinks while nearing a high-volume zone, get ready: a shakeout may be coming.
Don't just use price alerts. Go deeper — set alerts for EMA crossovers, sudden RSI shifts, or breaks through low-volume areas . That’s where silent moves become violent moves.
One underrated gem: Long/Short Position Tool . Use it to simulate your liquidation points before you open a trade. It’s like pre-visualizing your own death — so you can avoid it.
These tools aren’t just fancy widgets. They’re how you read the silent signals of the market before it slaps.
🐍 Whales Hunt Your Comfort Zone
The market doesn’t wait for you to be ready. Whales wait until you feel safe. Then they hit, wiping retail traders to create room for entry.
🚩 Trades Without a Plan Are Liquidation Invitations
Opening a position without mapping your liquidation zone? That’s like flying blind into a hurricane. Always have Plan A — and a backup Plan B.
🔍 Quiet Crashes Begin With Fake Breakouts
The market won’t warn you. It teases with one green candle, maybe a soft pump... and then drops like a rock. That’s the trick.
🧮 Moving Averages: When Smooth Means Scary
When EMA 21 and 55 flatten out too much, it’s not peace — it’s buildup. Flat EMAs = warning. Don’t be fooled by “smooth” charts.
⚠️ Liquidation Data = Psychological Red Flag
Liquidation spikes on sites like Coinglass aren’t just stats — they’re signs of herd slaughter. Use them as sentiment analysis. It's not just what got liquidated — it's who and why.
🧪 Post-Liquidation Analysis: Recovery or Spiral?
After liquidation, many rush to “make it back.” That's when more destruction happens. You need a post-liquidation plan, not just a pre-trade strategy.
🔐 The Best Trades Are Sometimes Early Exits
Exiting a trade that looks “fine” is a pro move. When everything feels stable, the market may be prepping to flip the table.
🧊 Cold-Minded Trading Saves Accounts
Pros stay ready during calm markets. Amateurs dive in when it’s “finally safe.” That mindset difference defines survival.
🧭 Final Takeaway
If there’s one thing to remember from this analysis, it’s this:
Never trust the market. Trust your tools. Trust your strategy.
The market is never safe — it only pretends to be.
✨ Need a little love!
We put so much love and time into bringing you useful content & your support truly keeps us going. don’t be shy—drop a comment below. We’d love to hear from you! 💛
Big thanks,
Mad Whale 🐋
📜Please remember to do your own research before making any investment decisions. Also, don’t forget to check the disclaimer at the bottom of each post for more details.
Dogeusdt

DOGE | BULLISH Pattern | +100%DOGE is seemingly ready for more upside as we start to see a pattern resembling an inverse head and shoulders pattern:
✅Usually, the Inverse H&S plays out something like this:
📢But the pattern is not quite confirmed just yet. We'd need to see a close ABOVE the current resistance zone to validate the pattern:
If we can see that, it's likely that there can be BIG gains on DOGE. It will especially help if ETH makes more increases, showing that the general alt market is heading in the right direction.
____________________
BINANCE:DOGEUSDT

Doge(based on NEowave)like ETH wave E is ending and soon it will start a huge bullish wave.
wave E look likes a bow-tie diametrical and wave g is at the end which is the last chance to buy.

#DOGE/USDT#DOGE
The price is moving within a descending channel on the 1-hour frame and is expected to break and continue upward.
We have a trend to stabilize above the 100 moving average once again.
We have a downtrend on the RSI indicator, which supports the upward move by breaking it upward.
We have a support area at the lower limit of the channel at 0.1800, acting as strong support from which the price can rebound.
Entry price: 0.1838
First target: 0.1886
Second target: 0.1928
Third target: 0.1972

I positioned here — while others waited for confirmation.This was a textbook setup. Clean structure, high-probability narrative, and the kind of zone that doesn’t ask for your belief — it commands it.
Breakdown:
Price delivered a sharp move into a 1H OB confluence with an untouched 60min FVG sitting just below. That OB wasn’t noise — it was a true origin point, the last down candle before a major rally.
As price retraced, it swept short-term liquidity and tapped into that OB with precision. I watched volume spike on the drop — not retail fear, but Smart Money engineering the entry.
The 0.1795 zone wasn’t random. It was deliberate. A key equilibrium between displacement and rebalancing. And if this holds, the next logical draw is above 0.1860 — into the unmitigated FVG and resting buy-side liquidity.
Expectation:
From this 1H OB / FVG stack, I’m looking for:
Entry: ~0.1795
SL: Just under the 1.0 fib — under 0.1777
TP1: Mid FVG at 0.1831 (0.5)
TP2: Full inefficiency fill at 0.1887
I’m not forcing anything. If the market wants lower, there’s another FVG just below to absorb it — but structure still favors premium re-pricing.
Final note:
I don’t chase breakouts. I trap Smart Money setups, wait in silence — and strike when the chart gives me the story.
“The market doesn’t move by chance. It moves by design. And I design my trades the same way.”

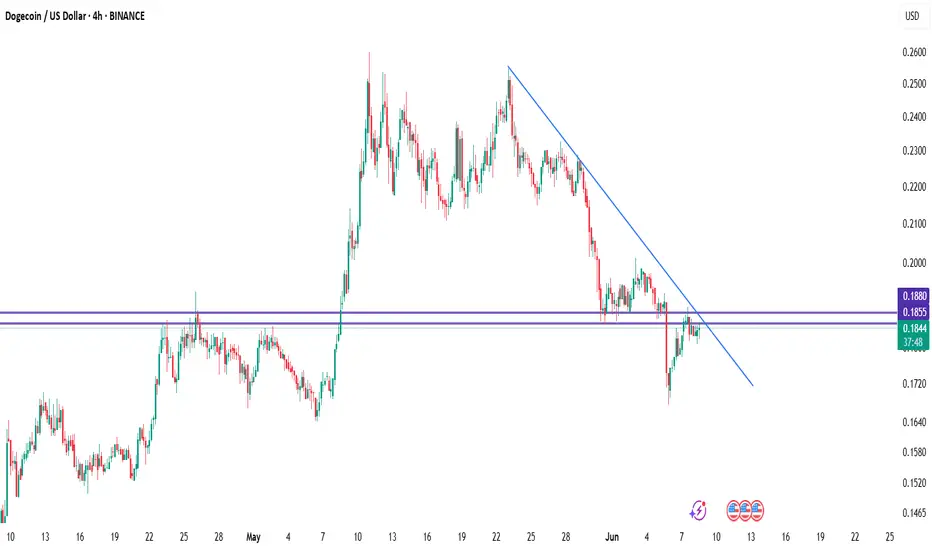
DogeusdtDOGE/USDT – 4H Chart Analysis
Dogecoin is currently testing a key resistance zone between $0.1855 and $0.1880, which aligns with the descending trendline from the May highs. Price action is showing early signs of bullish momentum, but a confirmed breakout above $0.1880 is needed to shift the market structure.
🔹 Bullish Scenario:
If DOGE breaks and closes above $0.1880 with volume, it could trigger a trend reversal. Immediate targets would be:
$0.1980
$0.2100
🔹 Bearish Scenario:
Failure to break resistance and a drop below $0.1810 would likely lead to further downside toward:
$0.1760
$0.1640
DOGE Short Setup in Play—Targeting $0.13258 and $0.08840The broader price structure of DOGEUSDT continues to reflect a clear downtrend, with price consistently printing lower highs and lower lows. This trend is well-respected, as shown by the descending blue trendline, which has acted as dynamic resistance since early 2025.
In late April to early May, DOGE saw a sharp rally, briefly breaking above the trendline. However, this move turned out to be a false breakout against the trend, highlighted on the chart with a label and visual marker. The breakout failed to sustain above resistance and quickly reversed, trapping bullish traders and reaffirming the bearish dominance. This type of price action often signals a bull trap, and in this case, the reversal was swift and aggressive.
The price has since declined and is currently trading around the $0.18258 region, hovering just below the local resistance and just above the initial support levels.
Key Levels Observed on the Chart
• Stop-Loss / Resistance Zone:
The red resistance area around $0.20930–$0.22643 marks a critical stop-loss zone for any short positions. This is the top boundary where the false breakout failed and where sellers previously regained control.
• Entry / Decision Zone:
Price is currently within a small neutral box (shown in light blue), indicating a potential short entry zone as price consolidates below resistance.
• Key Support Level 1 / Take Profit 1:
$0.13258 – This level has been labeled as the first major support and serves as the initial take-profit zone for short setups. Historically, this zone has held price during strong down moves, and it aligns well with past structure.
• Key Support Level 2 / Take Profit 2:
$0.08840 – The second support level is marked as a deeper profit target for continuation of the downtrend. This level is closer to multi-month lows and reflects potential bearish extension.
• Final Support Base:
$0.05000 – This level is the lowest green horizontal line on the chart, showing long-term structural support. If macro conditions worsen, this remains a plausible downside target.
Detrended Price Oscillator (DPO) Indicator
The DPO reading remains below zero at approximately –0.04, reinforcing the bearish momentum. The indicator does not show any bullish divergence, suggesting that there’s currently no sign of an upward reversal forming. The gradual downward slope of the DPO supports the probability of a continuation move to the downside.
Trade Setup (Short Bias)
• Entry Zone: $0.18258 – $0.18546 (current price range just under resistance)
• Stop-Loss: $0.20930 (above key resistance where breakout failed)
• Take Profit 1: $0.13258
• Take Profit 2: $0.08840
• Extended Bearish Target: $0.05000
Conclusion
DOGEUSDT continues to respect its long-term bearish structure, and the recent false breakout further validates the dominance of sellers. The failed attempt to reverse the trend above $0.20930 provides a well-defined stop for short setups, while the clean stair-step structure of support levels offers logical take-profit zones.
Unless DOGE manages to close above the $0.20930–$0.22643 resistance band with strong follow-through, the current bias remains bearish. Traders can monitor for short opportunities while protecting capital above the invalidation zone.

DOGEUSDT 1D Analysis DOGE ~ 1D Analysis
#DOGE Buy back gradually from here with a short term target of at least 15%+ from here.

DOGEUSDT 0.2550 TPWe are seeing a price rebound from strong support around the ~0.1900 level, which may signal the end of the correction. A potential double bottom formation is forming, which often indicates a trend reversal to the upside.
Additional arguments:
The WT_LB oscillator shows an oversold zone and initial upward curvature of signal lines – a typical buy signal.
After a strong downtrend, a consolidation phase has occurred, likely acting as an accumulation zone before a potential move upward.
The risk-to-reward ratio (R/R) is very favorable (around 1:5), supporting a long entry at the current market structure.
📌Technical signals and a strong R/R ratio support a bullish scenario, with a target around 0.252 and a stop-loss set near 0.185.

They see relief. I see rebalancing.BINANCE:DOGEUSDT.P isn't bullish — it's rebalancing. What we’re witnessing now is price doing what it always does after manipulation: return to efficiency before delivering its next displacement.
Here’s the setup:
Price tapped into the 4H discount zone — a structural STB
We’re now reacting from the 0.618 (0.1940) and pushing up toward the 4H OB at 0.20403
That OB is perfectly nested just above the 0.5 fib (0.20190), and below the 0.382 (0.20970) — prime for internal liquidity collection
If price fails to break structure above that 4H OB, the move is complete. This isn’t bullish continuation — it’s cleanup. From there, I’m watching closely for signs of rejection and displacement back toward the OB + BTS zone near 0.16884.
This is where real risk is priced in — and where Smart Money actually loads up.
Execution mindset:
Let price reach into 0.204–0.209
Watch for rejection — that’s the trigger
Downside target: 0.18299 → 0.16884
If we impulsively break 0.2097 and reclaim it, the bearish thesis is invalidated and I’ll re-evaluate
This isn’t trading a bounce. It’s reading the cleanup.
You want real entries, real invalidations, real structure? Check the profile description. The trades speak louder than the noise.

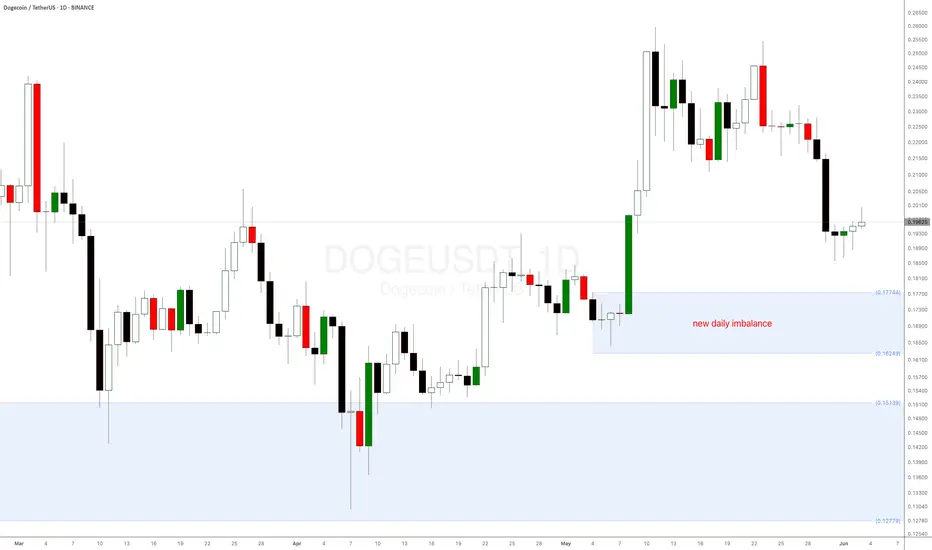
How to Spot the Perfect Dogecoin Buy Signal!Dogecoin (DOGE) is showing another major bullish signal!
After bouncing from the key weekly demand level at $0.151 mentioned in a previous supply and demand crypto analysis, DOGE coin is now approaching a new daily demand imbalance at $0.18035—a level where buyers have historically stepped in aggressively.
Why This Matters:
Strong Reaction Expected: Similar imbalances on other altcoins have led to sharp upward moves.
Long-term weekly imbalance: The weekly demand level is playing out very well.
Dogecoin (DOGE), the world’s favourite meme cryptocurrency, is trying to reach a critical weekly demand level at $0.151—its strongest daily demand zone in a long time! This presents a prime buying opportunity, especially for crypto beginners looking to enter the market.
Check the previous DOGE analysis from a few weeks ago.
Price tapped the discount — now it’s time to test premium.This setup on DOGE/USDT was mechanical. Not emotional.
I’ve seen this formation enough to know what comes next. The chart has already spoken.
After a clean markdown into the 4H OB, price hit the 0.786 retracement level — right inside a prior imbalance zone. That wasn’t a random drop. That was engineered. Liquidity was swept, sentiment reset, and now we have structure ready to reverse.
Notice this:
We’re sitting in a 4H demand OB with confluence from the FVG just above.
The Fibonacci levels are aligning with Smart Money delivery: 0.5 sits right at the base of the new rally expectation.
The 0.20928 level is the first key reaction point — I expect a stall or consolidation there.
But the real test comes higher: the 0.22094 OB, which also aligns with the 0.382 fib level — the market’s threshold between discount and premium.
I’ll be watching price closely on its approach into that 0.209–0.22094 region. If it delivers clean displacement through FVG, the next liquidity grab sets up a premium continuation model.
If we reject early — that tells me distribution is starting, and I’ll prep for a secondary sweep below 0.18 to retest the deeper 4H OB near 0.16387.
This setup didn’t require a confirmation signal.
It required understanding why price dropped — and where it’s designed to go.
I don’t need to guess. I just need to be aligned.

DOGE Ready for PUMP or what ?What I see now is that the price could correct to the PRZ and then pump again, and currently, there is no specific bullish pattern in the chart. which could cause the price to drop below 17 cents.
Best regards CobraVanguard.💚

The key is whether it can find support at 0.18951 and go up
Hello, traders.
If you "Follow", you can always get new information quickly.
Have a nice day today.
-------------------------------------
(DOGEUSDT 1D chart)
It touched the A section, which was the previous breakout trading section, again.
That is, if it is supported and rises near 0.18951, it is a time to buy.
If not, it will fall below the M-Signal indicator of the 1M chart, so caution is required when trading.
This is because in order to continue the upward trend in the medium to long term, the price must be maintained above the M-Signal indicator of the 1M chart.
Therefore, a short and quick response is required when trading below the M-Signal indicator of the 1M chart.
-
The channel of the High Line ~ Low Line of the OBV indicator is showing signs of turning into a downward channel.
Therefore, you should check whether the OBV shows signs of rising above the High Line.
-
The basic trading strategy is to buy near the HA-Low indicator and sell near the HA-High indicator.
It currently meets the HA-High indicator and falls to meet the HA-Low indicator.
Therefore, this wave should be interpreted as closed.
Therefore, a new wave will start from the HA-Low indicator that we met this time.
If it falls from the HA-Low indicator, it is likely to show a stepwise downtrend, and if it rises from the HA-High indicator, it is likely to show a stepwise uptrend.
Therefore, we need to check whether the HA-Low indicator supports the new wave to see if it is a downtrend or an uptrend.
-
Thank you for reading to the end.
I hope you have a successful trade.
--------------------------------------------------
- This is an explanation of the big picture.
(3-year bull market, 1-year bear market pattern)
I will explain more details when the bear market starts.
------------------------------------------------------

DOGE ShortOne of the ones that looks good for short. I entered a little bit from here, I will add a little bit more with the trend break.
I am short-biased because I think there will be a correction in my general market bias. After a correction I will look for long positions

#DOGEUSDT: Swing Buy Coming Up, Get Ready Dear Traders,
Price of Dogecoin has dropped similarly to the other crypto pairs, price is on the way to fill the void area and then we can see price reversal. Wait for price to drop a bit more than you can enter a buy entry, taking price to a new level.

#DOGEUSDT: Another Big Time Buying Chance! BINANCE:DOGEUSDT
Price has fallen to previous lowest low, indicating another reversal from the same area, however, please wait to witness some bullish behaviour to occur. After that, we can have a buy entry and target the previous Higher High. Our final target is 0.22.
Good Luck

DOGECOING Bearish Signal | Technical + Custom AlgoSmart Trend Signal | Technical Analysis + Custom Algorithm
This signal is the result of a combination of classic technical trend analysis and a proprietary software I personally developed.

$DOGE At Key Support Reversal Ahead?The DOGEUSDT 1D chart shows price testing a strong support zone around $0.18–$0.19.
If this level holds, a bullish reversal could push DOGE toward the $0.32 resistance area.
The setup suggests a potential uptrend with higher highs, but a breakdown below support may invalidate this move.
DYRO, NFA

Dogecoin Bearish (BD) but Bullish (BU)You see, Dogecoin is bearish but this bearish is only short-term. This retrace can last a few days more and then the market will turn and start growing again. In the worst case scenario, the drop can extend and last one or two weeks, that's it. Nothing more.
So, what does it matter if it goes down short-term when it will grow in the long haul.
See the pattern on the chart and the rising trendline at the bottom. This is the main support. The bullish structure will remain intact, the market is adapting because obviously, too much leverage can never work.
Once the over-leverage is removed from the market, we resume growing and this resumption is just around the corner. Next week or the week after, it doesn't matter, we are going higher.
Namaste.

#DOGEUSDT: Targeting $2 By End Of The Year| Comment Your Views|DOGEUSDT stands as one of the most significant cryptocurrency pairs, yet its price has experienced substantial consolidation within a defined range, presenting challenges for trading and investment. However, we posit that the current price juncture holds the potential for a reversal, and we anticipate that by the end of the year, DOGEUSDT will reach approximately $2. In the interim, we recommend targeting smaller price ranges rather than aiming for $2, which may require months or even years to attain.
We extend our best wishes for your trading endeavours. It is imperative that you conduct your own analysis prior to making any investment decisions, as this does not guarantee any potential price movement.
If you’re feeling inspired by our content, we’d love to hear from you! Just give it a like, comment, or share your thoughts. It means the world to us!
Cheers,
Team Setupsfx_

DOGE|Bearish Triangle Formation On30-Min Chart-Breakdown Ahead?📉 DOGE Bearish Triangle Breakdown | 30-Min Chart
This chart highlights a classic *bearish triangle formation* in DOGE's market cap on the 30-minute timeframe. The pattern shows a series of lower highs with horizontal support around the 32.45B zone.
🔍 Key Observations:
- Pattern: Bearish Triangle
- Resistance: ~34.7B
- Support Zone: ~32.45B
- Target Zone (Post-Breakdown): ~31.3B
A breakdown below the support level could signal further downside movement. However, confirmation is key — traders should watch for volume and candle close below support.
🕒 Timeframe: 30-Minute Chart
📆 Analysis Date: May 29, 2025
---
⚠ *Disclaimer:*
This analysis is shared purely for *educational purposes* and does not constitute financial advice. Please do your own research and risk management before making any trading decisions.

Strategies to Save Capital and Thrive in Bear MarketsEver felt stuck in a downtrend, unsure how to protect your capital?
Most traders burn their portfolios in bear markets just because they lack a real escape plan.
In this analysis, you'll uncover little-known strategies that could literally rescue your investments.
Hello✌
Spend 3 minutes ⏰ reading this educational material.
🎯 Analytical Insight on Dogecoin:
If Dogecoin fails to gain at least 20% in the next two weeks—while Bitcoin continues to rally—this divergence could signal a broader market weakness. When BTC outperforms and altcoins lag, it often reflects declining risk appetite and potential capital rotation out of speculative assets. A move toward the $0.27 target is key for confirming bullish continuation across the altcoin sector. 📉
Now , let's dive into the educational section,
🔧 TradingView Tools to Hunt Opportunities in Bear Markets
In bearish conditions, most traders only stare at price movements. But smart ones go deeper. With the right TradingView tools, you don’t just survive a bear market—you exploit it. Here are some must-use tools that can change your game:
Volume Profile: This helps highlight where trading activity is concentrated. These zones often act as hidden support in bearish phases.
Fixed Range Volume Profile: Use this to scan specific chart segments to understand volume-based zones of control. Perfect for pinpointing possible rebounds.
Auto Fib Retracement: TradingView’s automated Fibonacci retracement tool helps identify pullback levels. A critical asset when timing entries during downtrends.
Divergence Detector: Combine RSI or MACD to catch bullish divergences—these subtle signs often come before a trend reversal.
Multi-Timeframe S/R Indicator: This reveals support and resistance levels across different timeframes. Knowing where multiple levels align helps predict strong reactions.
For practical use, open a BTC or ETH chart, apply these tools, and look for volume clusters, divergences, and Fibonacci confluences. The more layers you add, the stronger your edge becomes. TradingView isn’t just a charting platform—it’s your bear market radar .
📉 Understanding Bear Market Psychology
Bear markets are all about fear and exhaustion. But that doesn’t mean opportunity is gone. If you learn to read the crowd’s psychology, you’ll see it’s just a phase—one you can use to your advantage.
🛡️ Capital Protection Comes First
Rule one in bear phases: protect, not profit. Logical stop-losses, reducing position sizes, using stablecoins, and cutting emotional trades are your survival kit.
🧲 Catching Opportunities in Pullbacks
Even bearish trends have bounces. These are golden moments to take short-term trades or exit from poor positions. The 4H chart with Fib retracement is your best friend here.
🔄 Range Trading = Consistent Gains
Sideways movement = scalping zone. Once price enters a range, clearly marked support/resistance levels from your indicators give sniper-level entries and exits.
🔮 Reverse Market Sentiment Like a Pro
In bear markets, everyone’s scared. Which means smart money starts buying. Flip your emotional lens. Fear on the street = quiet opportunity for the patient.
📊 Indicator Fusion for Early Signals
RSI + MACD + Volume = market whisperers. If RSI bottoms while volume spikes, you’re probably seeing the quiet before a bullish storm. Most won’t notice. You will.
🧬 Learn From the Past Market Cycles
History repeats. Mark previous bear market lows on your chart. Compare price action. Similar structure = similar outcome. Patterns from BTC 2018 or COVID crash are still valid today.
🧠 Your Mindset Is Your Strongest Tool
More than any tool or strategy, it’s your mental control that saves capital. If you can master your thoughts, you can master your trades. Bear markets punish the weak-minded—not just the unskilled.
🧭 Final Thoughts:
If you take away just one insight, let it be this: in bear markets, survival is the goal, and hidden opportunities are born from fear. No trend lasts forever. But the prepared trader lasts through every trend.
always conduct your own research before making investment decisions. That being said, please take note of the disclaimer section at the bottom of each post for further details 📜✅.
Give me some energy !!
✨We invest countless hours researching opportunities and crafting valuable ideas. Your support means the world to us! If you have any questions, feel free to drop them in the comment box.
Cheers, Mad Whale. 🐋
