DOGE/USDT: Key Buy Opportunity at 0.22800 Support Zone!Hey Traders, in today's trading session we are monitoring DOGE/USDT for a buying opportunity around 0.22800 zone, DOGE/USDT is trading in an uptrend and currently is in a correction phase in which it is approaching the trend at 0.22800 support and resistance area.
Trade safe, Joe.
Dogeusdt

Short DOGEUSDT With Confidence – Bearish Setup + Targets🔍 Technical Analysis Summary
Pattern: Bearish Flag (Bearish Continuation)
Resistance Zone: Around 0.25945 USDT
Price Channel: Price is consolidating inside a descending flag channel after a sharp upward move.
Potential Breakdown: If price breaks below the lower trendline of the flag, continuation to the downside is expected.
📉 Trade Setup (Short Position)
Entry Point: Around 0.22534 USDT (at or just below the flag's lower trendline to confirm breakdown)
Stop Loss: Around 0.23581 USDT (above the upper flag boundary for invalidation)
Take Profit Targets:
o TP1: 0.20573 USDT (first strong support zone)
o TP2: 0.18691 USDT (second strong support zone)
✅ Risk-Reward Ratio Analysis
Entry: 0.22534
Stop Loss: 0.23581 → Risk: ~1.05 cents
TP1: 0.20573 → Reward: ~1.96 cents → RR ≈ 1.86:1
TP2: 0.18691 → Reward: ~3.84 cents → RR ≈ 3.66:1
📌 Conclusion
This bearish flag setup on DOGEUSDT presents a strong opportunity for a short position. A confirmed breakdown below the flag pattern could lead to a test of the strong support zones marked. It's a good setup with a favorable risk-reward ratio, especially if TP2 is reached.

Be careful with DOGE !!!So if you pay attention to the DOGE chart you can see that the price has formed a Ascending FLAG or DOGE which means it is expected to price move as equal as the measured price movement.( AB=CD )
NOTE: wait for break of the FLAG .
Give me some energy !!
✨We spend hours finding potential opportunities and writing useful ideas, we would be happy if you support us.
Best regards CobraVanguard.💚
_ _ _ _ __ _ _ _ _ _ _ _ _ _ _ _ _ _ _ _ _ _ _ _ _ _ _ _ _ _ _ _
✅Thank you, and for more ideas, hit ❤️Like❤️ and 🌟Follow🌟!
⚠️Things can change...
The markets are always changing and even with all these signals, the market changes tend to be strong and fast!!

Dogecoin (DOGE) OverboughtI have been trading for a long time using the DCA strategy indicator that I have developed and I have recently published the indicator on my Tradingview page.
According to this indicator, I have been buying DOGEs at support levels with more money than I would have thrown away so far. This support level is generally seen at $0.056. In addition, I dumped some of my DOGE at $0.2285, but then bought again at $0.107. I have already shared this analysis.
I think that DOGE, which has broken through two resistances, will advance at least up to $0.75 (potential 89% return). But for this progress, I think that it must first find support at the $0.2285 level, which was broken again. This is because the indicator also gives an overbought signal. Therefore, I will tailor my portfolio accordingly. But I wouldn't be surprised if it continues relentlessly.
As long as Elon Musk remains in government, I think this cryptocurrency will be on a continuous upward trend.

Dogecoin Long-Term, Weekly TimeframeRepeating patterns are great because you can easily predict the future by studying them.
Good...
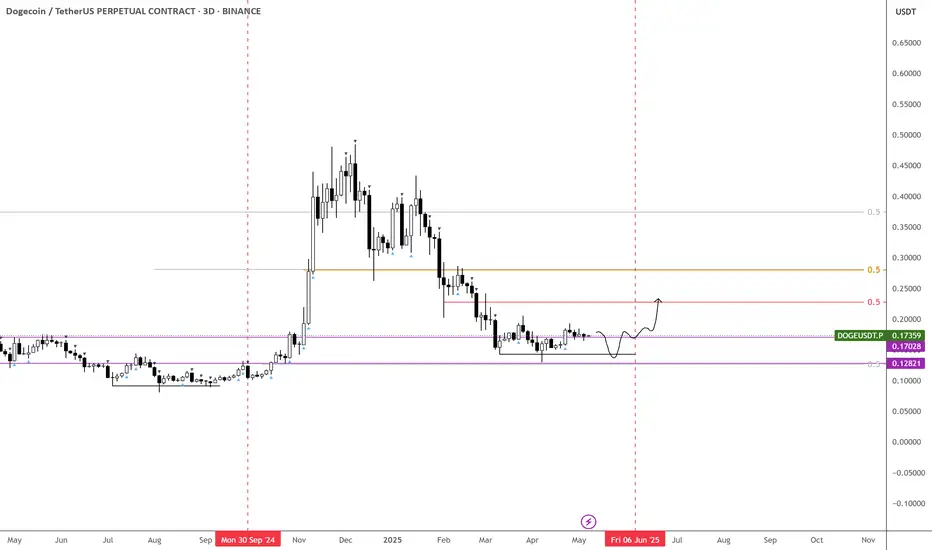
Dogecoin produced a peak in March 2024 and starts a decent. This descent creates a sequence of lows marked 1,2,3 on the chart. This ends up as a rounded bottom. As soon as the action recovers above the baseline of the rounded bottom, there is some consolidation and then massive growth. The highest prices in several years. The situation is very similar today.
Dogecoin produced a peak in December 2024 and then starts a descent. This descent creates the bottom pattern shown on the chart. The market is already bullish as all the bearish action since February has been removed. DOGEUSDT moves now as if it were February 2025. March and April where the months that produced the final market shakeout (flush) before the 2025 bull market cycle and wave.
Right now we can see some consolidation based on the weekly timeframe, very short, followed by additional growth. The biggest wave since 2021. Something awesome.
Are you ready?
I hope you are...
Namaste.

DOGE (Dogecoin)–Pullback Opportunity Amid Market-Wide ResistanceWith the total crypto market cap stalling at a major resistance zone, many altcoins — including DOGE — are due for a healthy retracement after recent strong moves. This sets up a potential buy-the-dip opportunity as DOGE returns to key support near $0.20.
🔹 Entry Zone:
$0.20 (next major support zone after recent rally)
🎯 Take Profit Targets:
🥇 $0.23 – $0.24
🥈 $0.30 – $0.31
🛑 Stop Loss:
Just below $0.18 (invalidates the support-based long idea)


DOGECOIN CONSOLIDATION - When Breakout?CRYPTOCAP:DOGE has been seen to range within the box on the 1hr timeframe chart since 10th May and it’s still within the box. Trade with caution.
Please support this idea with a LIKE👍 if you find it useful🥳
Happy Trading💰🥳🤗

Dogecoin Buy Signal: Will the Channel Break Today?Hello friends
Given the good growth we had, you can see that the price has taken a break, which can be used as a buying opportunity.
We have identified the buying steps for you to buy in steps and move to the specified goals.
*Trade safely with us*

DOGE/USDT 1D chart reviewHello everyone, let's look at the 1D dog chart to USDT, in this situation we can see, the price reflection here can be seen how the price continues under the downward trend line.
Going further, let's check the places of potential target for the price:
T1 = 0.246 $
T2 = 0.282 $
Т3 = 0.319 $ t4 = 0.369
Let's go to Stop-Loss now in case of further declines on the market:
SL1 = 0.229 $
SL2 = 0.195 $
SL3 = 0.157 $
Looking at the RSI indicator, you can see that when the indicator came out the top, it gave the relief for the price and now when the price lasts in a slight side trend, the indicator collects energy for a new move.

"DOGE - Time to buy again!" (Update)Finally, this pattern was broken and had a positive impact, leading to significant growth. Now, with a slight price correction, higher price levels can be reached.
PREVIOUS ANALYSIS
Stay Awesome , CobraVanguard

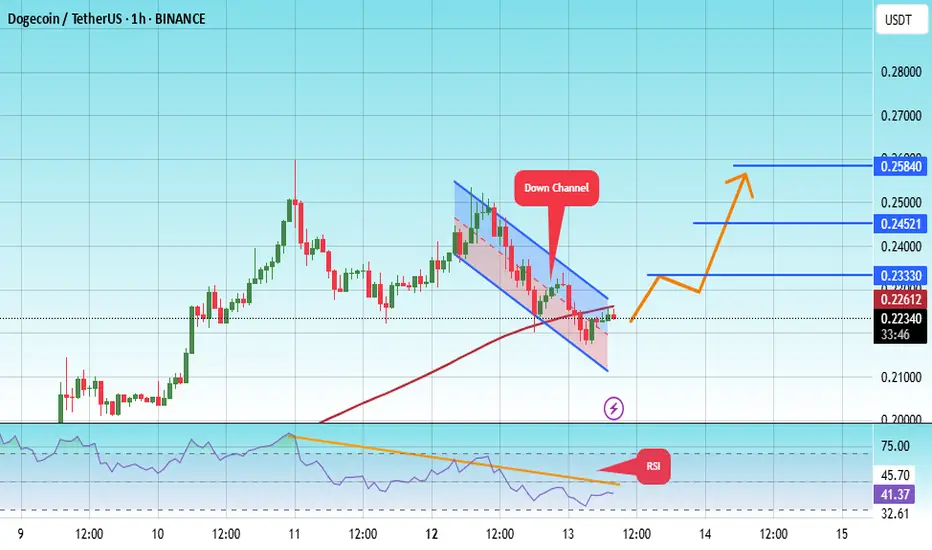
#DOGE/USDT#DOGE
The price is moving within a descending channel on the 1-hour frame, adhering well to it, and is on its way to breaking it strongly upwards and retesting it.
We are seeing a bounce from the lower boundary of the descending channel, this support at 0.2136.
We have a downtrend on the RSI indicator that is about to break and retest, supporting the upward trend.
We are looking for stability above the 100 Moving Average.
Entry price: 0.21390
First target: 0.23330
Second target: 0.24521
Third target: 0.25840
Strong DOGE Breakout Points to 20% Upside Toward 0.28Hello and greetings to all the crypto enthusiasts, ✌
All previous targets were nailed ✅! Now, let’s dive into a full analysis of the upcoming price potential for Dogecoin 🔍📈.
DOGE has broken out of its descending channel with strong bullish momentum 📈. Backed by healthy volume and a bounce near key Fibonacci support, I'm anticipating up to a 2 0% upside, with the primary target set at 0.28 🚀.
🧨 Our team's main opinion is: 🧨
DOGE broke out with strong volume, eyeing up to 20% upside toward the 0.28 target 📈.
Give me some energy !!
✨We invest hours crafting valuable ideas, and your support means everything—feel free to ask questions in the comments! 😊💬
Cheers, Mad Whale. 🐋

"DogeCoin" Crypto Heist - Bullish Breakout Plan!🌍 DOGEUSDT Crypto Heist Plan: Unleash the Thief Trading Style! 🤑💸🚀
Dear Market Mavericks & Crypto Bandits, 🏴☠️
Get ready to pull off the ultimate DOGEUSDT market heist with our Thief Trading Style, blending razor-sharp technical analysis and cunning fundamental insights! 📊🔥 Our mission? Storm the market, grab those bullish profits, and escape before the Dangerous Red Zone traps us in overbought chaos, consolidation, or a bearish reversal. 💥 Let’s outsmart the market and cash out like legends! 🏆🎉
📈 The Heist Blueprint: Long Entry Strategy
Entry Point 🚪:
The breakout is your signal! Wait for DOGEUSDT to smash through the Moving Average (MA) at 0.28000—that’s your green light for bullish glory! 🌟
Pro Tip:
Set Buy Stop Orders just above the MA for breakout confirmation.
OR place Buy Limit Orders at the most recent 15M/30M swing low/high for pullback entries.
Set an ALERT on your chart to catch the breakout in action! 🔔
Stop Loss (SL) 🛑:
Breakout traders: Hold off on setting your SL until the breakout confirms. Place it at the recent 1D swing low (0.2000) for swing/day trades.
Risk Management: Adjust SL based on your lot size, risk tolerance, and multiple orders. Play it smart—this is your safety net! ⚠️
Rebels beware: If you stray from the plan, you’re dancing with fire. Own the risk! 🔥
Take Profit (TP) 🎯:
Aim for 0.42000 — our golden exit.
Escape Plan: If the market screams overbought or shows reversal signs, get out early! Don’t get caught in the Red Zone trap. 🚨
🧲 Scalpers’ Corner 👀
Scalp LONG only—ride the bullish waves! 🌊
Got big capital? Dive in now. Smaller stack? Join the swing traders for the full heist.
Use Trailing Stop-Loss to lock in gains and protect your loot. 💰
📡 Market Pulse: Why DOGEUSDT?
The DOGEUSDT market is in a neutral trend with a high probability of bullish momentum. Here’s the intel driving our heist:
Fundamentals: Dive into macroeconomic data, COT reports, geopolitical events, and news sentiment.
Intermarket Analysis: Watch correlated assets for clues.
Seasonal & Positioning Trends: Align with the market’s rhythm.
Future Targets: Check the Overall Score for a full breakdown! 👉🌏🔗
⚠️ Trading Alert: News & Risk Management 📰
News releases can flip the market like a switch! Protect your positions:
Avoid new trades during high-impact news.
Use Trailing SL to secure profits and minimize losses.
Stay sharp—volatility is our friend, but only if we’re prepared!
💪 Join the Heist & Boost the Plan!
Hit the Boost Button to supercharge our Thief Trading Style and make this heist legendary! 🚀 Every boost strengthens our crew, helping us plunder profits daily with ease. 💥 Let’s dominate the DOGEUSDT market together! 🤝
Stay tuned for the next heist plan! 🐱👤 Keep your charts locked, your alerts set, and your trading spirit wild. See you in the profits, bandits! 🤑🎉
#ThiefTrading #DOGEUSD #CryptoHeist #TradingView #MakeMoney

Cup & Holder on Doge DOGE has been sleeping since the ATH in 2024. But has now woken up. The interest in this coin of freedom between people has again started to spike. On 21D chart there's a giant Cup & Holder with the promise of taken this coin to $0.72.

Is It "GO" Time for $DOGE Dominance to Flippen BTC?Been talking about this for a while.
Early, but not wrong.
Remember: nothing ever moves in a straight line except c0caine- and even then, only if you're a degenerate.
But enough about my theory- this market is breaking a lot of old "ObViOuS" patterns, because they never repeat perfectly.
What do YOU think is going on here?
Is it actually GO time?

BABYDOGEHey everyone,
Is it just me, or are we all seeing the same setup and potential move forming here?
Would love to hear your thoughts—feel free to share your analysis!
OKX:BABYDOGEUSDT

DOGE - 1$ NextDoge is getting ready for the next wave. Based on the previous trend we are looking at the next target around 1.1$.
Doge can break 1$ easily based on the current trend and overall interested in DOGE.
Entry: 0.1766
TP1: 0.22086
TP2: 0.30439
TP3: 0.40104
TP4: 0.53436
TP5: 1.13587
Stop Loss: 0.1143
Follow us for more such ideas.
Cheers
GreenCrypto

"DOGE Analysis" (Update)the price can form a head and shoulders pattern. If that is happen, expect a significant price increase.
Stay Awesome , CobraVanguard

LONG DOGE/USDT | Falling Wedge ⇒ Bullish ReversalDOGE/USDT | Falling Wedge ⇒ Bullish Reversal
If you recall my April 3 prediction to go long on DOGE/USDT at 0.13210, the pair bounced precisely at that level, surged 48%, and reached its second target on the daily timeframe.
We are now reassessing our setups to position for a second leg up.
📊 Market Structure
Pattern: Price has been compressing into a falling wedge, marked by lower highs and lower lows converging (blue lines).
🔹 Demand Order Block
Zone: 0.160 – 0.164 USDT (shaded blue)
0.16360 USDT – trend-line support test
0.16360 USDT – prior swing base
⚔️ Long Entry Strategies
Enter on a bounce off 0.16360 USDT with a bullish rejection/ retest.
🛑 Stop Loss
A close below the Level: 0.15580 USDT
Placed just below the demand block to absorb noise while capping downside.
🎯 Profit Targets
Target Price (USDT)
TP1 0.17123
TP2 0.18077
TP3 0.19296
🔧 Trade Management
Scale Out: Take partial profits at each TP to lock in gains.
Trail Stop: Move to breakeven after TP1 is reached.
Invalidation: A close below 0.15580 USDT negates the setup—exit and reassess.

$DOGE Consolidating - Q3 will be big!Would love to see another retest into the 15c zone—might be asking for a lot, but if it happens, I’ll be ready.
If not, expecting a move toward 22c before any significant retrace.
Looks like it’s setting up for some consolidation, with major expansion likely in July as the new quarter kicks off CRYPTOCAP:DOGE $DOGESUSDT
doge buy midterm"🌟 Welcome to Golden Candle! 🌟
We're a team of 📈 passionate traders 📉 who love sharing our 🔍 technical analysis insights 🔎 with the TradingView community. 🌎
Our goal is to provide 💡 valuable perspectives 💡 on market trends and patterns, but 🚫 please note that our analyses are not intended as buy or sell recommendations. 🚫
Instead, they reflect our own 💭 personal attitudes and thoughts. 💭
Follow along and 📚 learn 📚 from our analyses! 📊💡"

Dogecoin: Should I Sell Everything Before The Crash?I want your attention focused on the (3).
On the chart, left side, (1) and (2) is a sequence of low and lower low. (3) is a higher low.
On the right side of the chart, (1) and (2) is a sequence of low and lower low. (3) is a higher low.
On the left , after (3) there was a massive bullish wave.
On the right, (3) will lead to a very strong bullish cycle and phase. The strongest growth period since the 2021 bull market.
Should I sell everything before the crash?
Panic buy. Buy like it is the end of the world.
Buy more, buy and hold while focusing on the long-term.
Never use a stop-loss. Remove any stop-loss orders now and if prices drop, make sure to buy as much as you can because Dogecoin is about to grow really strong in the coming days.
Retraces are an opportunity to buy-up and reload. If you can't buy more, just hold.
No selling at this point. Only sell when prices are hitting new highs. This is the perfect time to buy and hold!
Namaste.
