DOGEUSDT at a Make-or-Break Level: Bounce or a Breakdown?📉 Overview:
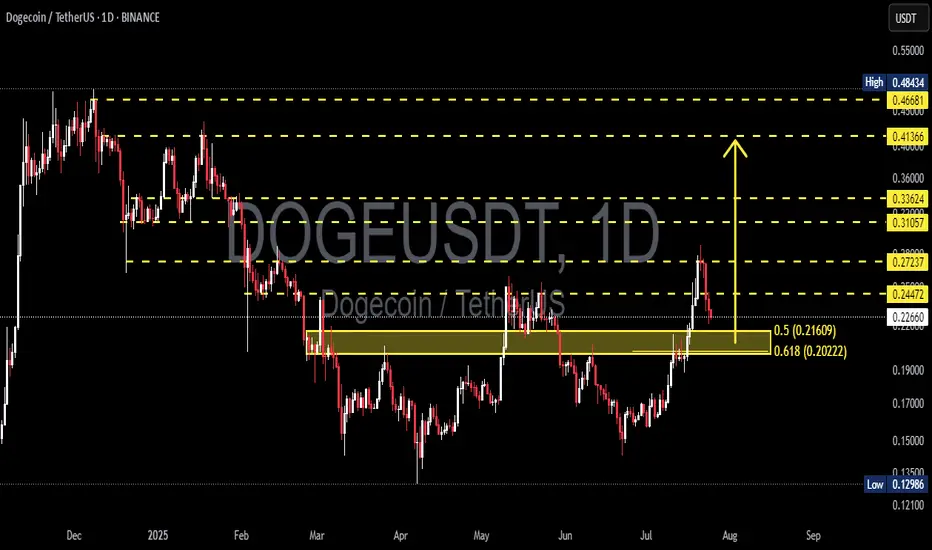
After a strong rally from the $0.13 zone to a recent local high of $0.272, DOGE is now undergoing a healthy correction. The price has retraced to a critical Fibonacci Golden Pocket zone (0.5–0.618) between $0.21609 and $0.20222 — historically one of the most powerful zones for market reactions.
This area also aligns with a previous resistance zone that is now being retested as support — a classic SR Flip (Support/Resistance Flip).
---
📌 Key Technical Structure:
🔸 Support & Demand Zone (Golden Pocket):
$0.21609 (Fib 0.5) and $0.20222 (Fib 0.618) – key retracement levels of the recent bullish swing.
Acts as a confluence zone with horizontal support from prior consolidation.
🔸 Major Resistance Levels:
$0.24472 – immediate resistance to reclaim.
$0.27237 – recent high and a major supply zone.
$0.31057, $0.33624 – historical distribution zones.
$0.41366 – breakout confirmation zone for a full trend reversal.
---
🧠 Market Psychology & Patterns:
Breakout & Retest: DOGE recently broke out from a long-term range and is now retesting the breakout zone.
Potential Bull Flag or Descending Channel: Current pullback resembles a flag or bull pennant — both continuation patterns if confirmed with volume.
---
✅ Bullish Scenario (Bounce):
If DOGE holds the Golden Pocket ($0.216–$0.202) and prints a strong bullish reversal candle:
A bounce may push price back to $0.244, and if reclaimed, back to $0.272.
A confirmed breakout above $0.272 with volume could lead to:
Mid-term targets: $0.310 → $0.336 → $0.413 → $0.466.
📈 Confirmation: Daily candle close above $0.244 with rising volume.
---
❌ Bearish Scenario (Breakdown):
If price fails to hold above $0.202 and breaks below with daily close:
It signals invalidation of the bullish structure and possible reversal.
Downside targets:
$0.186 – short-term support.
$0.150 – psychological support.
$0.129 – Year-to-date low (YTD Low).
This would also form a Lower High – Lower Low structure indicating a shift to a bearish trend.
---
🔍 Volume & Momentum Clues:
Watch for volume spikes near $0.202–$0.216.
Strong green candle + volume = likely reversal.
Weak reaction or breakdown on low volume = potential continuation downward.
---
🎯 Trader Playbook:
Signal Action Target
Bounce from $0.216–$0.202 Long Entry $0.244 – $0.272
Daily close below $0.202 Short / Avoid Longs $0.186 → $0.150
Breakout above $0.272 w/ volume Breakout Entry $0.31 → $0.336 → $0.41+
---
🏁 Conclusion:
DOGE is currently at a critical inflection point. The Golden Pocket zone will likely determine whether bulls are accumulating for another leg up or bears are about to reclaim control.
💡 This is a time for strategy, not prediction. Wait for confirmation before committing to either direction. The market is speaking — all we have to do is listen.
---
📊 Chart Summary:
Timeframe: Daily (1D)
Pattern: Breakout Retest + Fibonacci Retracement + Bull Flag
Structure: Higher High – looking for Higher Low confirmation
#DOGEUSDT #Dogecoin #CryptoTA #GoldenPocket #AltcoinAnalysis #FibonacciTrading #BreakoutSetup #BullishContinuation #BearishReversal
Dogeusdtidea
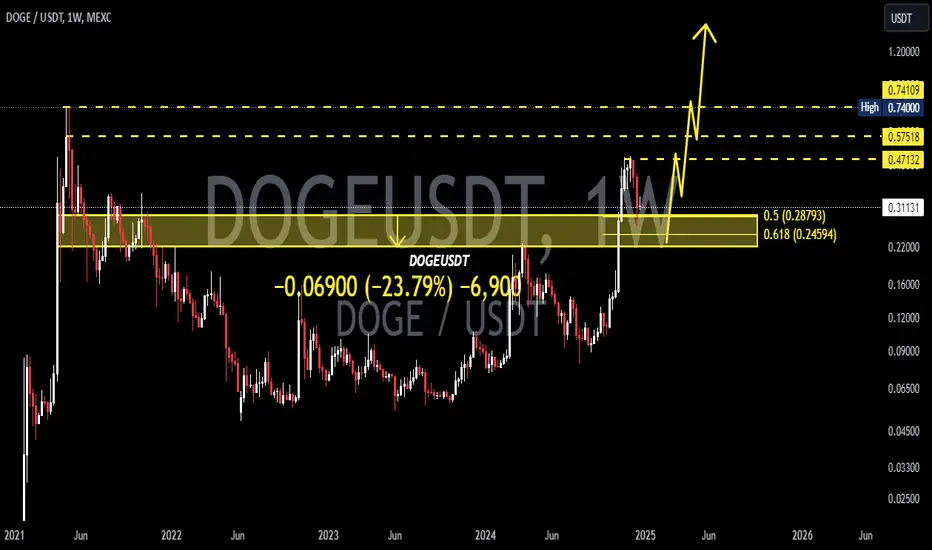
#DOGEUSDT: Swing Move In Making! Get ReadyThe cryptocurrency market is currently experiencing a rally due to the bullish trend of the underlying assets. The price has experienced a period of accumulation, followed by a distribution process. We have established a swing target based on the potential for the price to reach the previous record high. Technical indicators support our analysis, but we acknowledge the need for strong fundamental support to achieve this level.
We wish you the best of luck in your trading endeavours and encourage you to share our insights by liking and commenting on this post.
Sincerely,
Team Setupsfx_

DOGE/USDT Rebound from Key Demand Zone! Bullish Rally Incoming?
🔍 Technical Analysis Overview:
1. Strong Demand Zone (Support Area):
DOGE has just bounced off a strong demand zone around $0.15000 – $0.16318, which previously acted as a significant accumulation area (highlighted in yellow). This signals a potential trend reversal from bearish to bullish.
2. Bullish Bounce Confirmation:
Price action is forming a potential "higher low" in this support area, indicating the early signs of a bullish structure.
3. Key Resistance/Target Levels: If momentum continues, DOGE could target the following resistance zones:
📍 $0.19637 – Initial minor resistance.
📍 $0.21000 – Previous consolidation area.
📍 $0.24911 – $0.31170 – Mid-term targets.
📍 $0.41583 – $0.48432 – Major resistance zone for long-term rally.
4. Short to Mid-Term Outlook:
The price is showing signs of a potential "V-shaped recovery." The yellow arrow suggests possible minor pullbacks before a continued bullish move toward higher resistance zones.
💡 Potential Strategy:
Entry: Look for re-entry opportunities on a retest of the $0.16 – $0.18 zone with bullish candle confirmation.
Stop Loss: Below $0.15000 (key invalidation level).
Take Profits: $0.196 – $0.249 – $0.311 – $0.415 (ladder out positions).
🚀 Conclusion:
DOGE is currently in an exciting technical setup, rebounding from a major demand zone with a strong potential for a bullish trend reversal. If volume supports and broader crypto sentiment improves, a strong upside rally could be in play in the coming weeks.
#DOGE #Dogecoin #DOGEUSDT #CryptoAnalysis #TechnicalAnalysis #Altcoins #CryptoTrading #Breakout #SupportAndResistance #BullishReversal

DOGEUSDT 1D AnalysisDOGE ~ 1D Analysis
#DOGE Buy back gradually from here with a short term target of at least 15%+, Long term target $0.5

#DOGEUSDT: Swing Buy Coming Up, Get Ready Dear Traders,
Price of Dogecoin has dropped similarly to the other crypto pairs, price is on the way to fill the void area and then we can see price reversal. Wait for price to drop a bit more than you can enter a buy entry, taking price to a new level.

#DOGEUSDT: Another Big Time Buying Chance! BINANCE:DOGEUSDT
Price has fallen to previous lowest low, indicating another reversal from the same area, however, please wait to witness some bullish behaviour to occur. After that, we can have a buy entry and target the previous Higher High. Our final target is 0.22.
Good Luck

#DOGEUSDT: Targeting $2 By End Of The Year| Comment Your Views|DOGEUSDT stands as one of the most significant cryptocurrency pairs, yet its price has experienced substantial consolidation within a defined range, presenting challenges for trading and investment. However, we posit that the current price juncture holds the potential for a reversal, and we anticipate that by the end of the year, DOGEUSDT will reach approximately $2. In the interim, we recommend targeting smaller price ranges rather than aiming for $2, which may require months or even years to attain.
We extend our best wishes for your trading endeavours. It is imperative that you conduct your own analysis prior to making any investment decisions, as this does not guarantee any potential price movement.
If you’re feeling inspired by our content, we’d love to hear from you! Just give it a like, comment, or share your thoughts. It means the world to us!
Cheers,
Team Setupsfx_

DOGEUSDT to drop to 4h support before bounceHere is analysis of DOGEUSDT support and resistances.
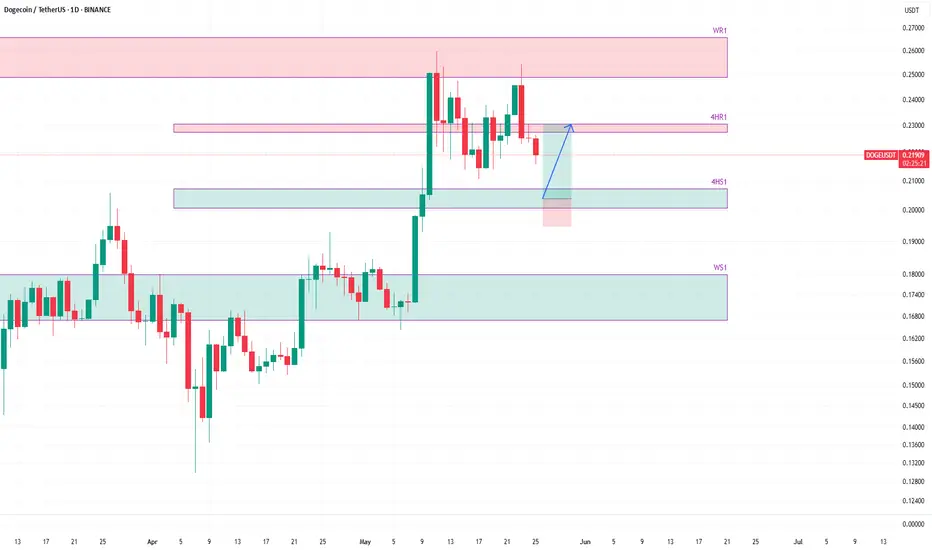
The price was rejected from weekly resistance zone WR1 two time. The price is currently on downward move. An next support on the way is 4h support 4HS1 and the next one is weekly support WS1.
The price is likely to bounce from 4h support 4HS1. This will provide a long opportunity from 4HS1 towards the 4h resistance 4HR1.
The possibility that the price may touch WS1 again on this current downward move, beyond some bounces which we are planning to exploit for long setups, is real.
Lets wait and watch while we take the given trade and review the price reaction on touching 4HR1 on the expected bounce from 4HS1.
DOGE/USD "DogeCoin vs U.S Dollar" Crypto Heist Plan (Day/Swing)🌟Hi! Hola! Ola! Bonjour! Hallo! Marhaba!🌟
Dear Money Makers & Robbers, 🤑 💰💸✈️
Based on 🔥Thief Trading style technical and fundamental analysis🔥, here is our master plan to heist the DOGE/USD "DogeCoin vs U.S Dollar" Crypto Market. Please adhere to the strategy I've outlined in the chart, which emphasizes long entry. Our aim is to escape near the high-risk ATR Line Zone. Risky level, overbought market, consolidation, trend reversal, trap at the level where traders and bearish robbers are stronger. 🏆💸"Take profit and treat yourself, traders. You deserve it!💪🏆🎉
Entry 📈 : "The heist is on! Wait for the MA breakout (0.19000) then make your move - Bullish profits await!"
however I advise to Place Buy stop orders above the Moving average (or) Place buy limit orders within a 15 or 30 minute timeframe most recent or swing, low or high level for Pullback entries.
📌I strongly advise you to set an "alert (Alarm)" on your chart so you can see when the breakout entry occurs.
Stop Loss 🛑: "🔊 Yo, listen up! 🗣️ If you're lookin' to get in on a buy stop order, don't even think about settin' that stop loss till after the breakout 🚀. You feel me? Now, if you're smart, you'll place that stop loss where I told you to 📍, but if you're a rebel, you can put it wherever you like 🤪 - just don't say I didn't warn you ⚠️. You're playin' with fire 🔥, and it's your risk, not mine 👊."
📍 Thief SL placed at the nearest/swing low level Using the 1H timeframe (0.16800) Day / Swing trade basis.
📍 SL is based on your risk of the trade, lot size and how many multiple orders you have to take.
🏴☠️Target 🎯: 0.21100 (or) Escape Before the Target
🧲Scalpers, take note 👀 : only scalp on the Long side. If you have a lot of money, you can go straight away; if not, you can join swing traders and carry out the robbery plan. Use trailing SL to safeguard your money 💰.
💰💵💸DOGE/USD "DogeCoin vs U.S Dollar" Crypto Market Heist Plan (Scalping/Day) is currently experiencing a bullishness,., driven by several key factors. .☝☝☝
📰🗞️Get & Read the Fundamental, Macro, COT Report, On Chain Analysis, Sentimental Outlook, Intermarket Analysis, Future trend targets... go ahead to check 👉👉👉🔗🔗🔗
⚠️Trading Alert : News Releases and Position Management 📰🗞️🚫🚏
As a reminder, news releases can have a significant impact on market prices and volatility. To minimize potential losses and protect your running positions,
we recommend the following:
Avoid taking new trades during news releases
Use trailing stop-loss orders to protect your running positions and lock in profits
💖Supporting our robbery plan 💥Hit the Boost Button💥 will enable us to effortlessly make and steal money 💰💵. Boost the strength of our robbery team. Every day in this market make money with ease by using the Thief Trading Style.🏆💪🤝❤️🎉🚀
I'll see you soon with another heist plan, so stay tuned 🤑🐱👤🤗🤩

"DogeCoin" Crypto Heist - Bullish Breakout Plan!🌍 DOGEUSDT Crypto Heist Plan: Unleash the Thief Trading Style! 🤑💸🚀
Dear Market Mavericks & Crypto Bandits, 🏴☠️
Get ready to pull off the ultimate DOGEUSDT market heist with our Thief Trading Style, blending razor-sharp technical analysis and cunning fundamental insights! 📊🔥 Our mission? Storm the market, grab those bullish profits, and escape before the Dangerous Red Zone traps us in overbought chaos, consolidation, or a bearish reversal. 💥 Let’s outsmart the market and cash out like legends! 🏆🎉
📈 The Heist Blueprint: Long Entry Strategy
Entry Point 🚪:
The breakout is your signal! Wait for DOGEUSDT to smash through the Moving Average (MA) at 0.28000—that’s your green light for bullish glory! 🌟
Pro Tip:
Set Buy Stop Orders just above the MA for breakout confirmation.
OR place Buy Limit Orders at the most recent 15M/30M swing low/high for pullback entries.
Set an ALERT on your chart to catch the breakout in action! 🔔
Stop Loss (SL) 🛑:
Breakout traders: Hold off on setting your SL until the breakout confirms. Place it at the recent 1D swing low (0.2000) for swing/day trades.
Risk Management: Adjust SL based on your lot size, risk tolerance, and multiple orders. Play it smart—this is your safety net! ⚠️
Rebels beware: If you stray from the plan, you’re dancing with fire. Own the risk! 🔥
Take Profit (TP) 🎯:
Aim for 0.42000 — our golden exit.
Escape Plan: If the market screams overbought or shows reversal signs, get out early! Don’t get caught in the Red Zone trap. 🚨
🧲 Scalpers’ Corner 👀
Scalp LONG only—ride the bullish waves! 🌊
Got big capital? Dive in now. Smaller stack? Join the swing traders for the full heist.
Use Trailing Stop-Loss to lock in gains and protect your loot. 💰
📡 Market Pulse: Why DOGEUSDT?
The DOGEUSDT market is in a neutral trend with a high probability of bullish momentum. Here’s the intel driving our heist:
Fundamentals: Dive into macroeconomic data, COT reports, geopolitical events, and news sentiment.
Intermarket Analysis: Watch correlated assets for clues.
Seasonal & Positioning Trends: Align with the market’s rhythm.
Future Targets: Check the Overall Score for a full breakdown! 👉🌏🔗
⚠️ Trading Alert: News & Risk Management 📰
News releases can flip the market like a switch! Protect your positions:
Avoid new trades during high-impact news.
Use Trailing SL to secure profits and minimize losses.
Stay sharp—volatility is our friend, but only if we’re prepared!
💪 Join the Heist & Boost the Plan!
Hit the Boost Button to supercharge our Thief Trading Style and make this heist legendary! 🚀 Every boost strengthens our crew, helping us plunder profits daily with ease. 💥 Let’s dominate the DOGEUSDT market together! 🤝
Stay tuned for the next heist plan! 🐱👤 Keep your charts locked, your alerts set, and your trading spirit wild. See you in the profits, bandits! 🤑🎉
#ThiefTrading #DOGEUSD #CryptoHeist #TradingView #MakeMoney

DOGEUSDT 1D AnalysisDOGE ~ 1D Analysis
#DOGE Buy gradually when re -testing this support with a short -term target of at least 10%+.

DOGE/USD "DogeCoin vs US Dollar" Crypto Heist (Scalping / Day)🌟Hi! Hola! Ola! Bonjour! Hallo! Marhaba!🌟
Dear Money Makers & Robbers, 🤑 💰💸✈️
Based on 🔥Thief Trading style technical and fundamental analysis🔥, here is our master plan to heist the DOGE/USD "DogeCoin vs US Dollar" Crypto Market. Please adhere to the strategy I've outlined in the chart, which emphasizes long entry. Our aim is to escape near the high-risk MA Zone. Risky level, overbought market, consolidation, trend reversal, trap at the level where traders and bearish robbers are stronger. 🏆💸"Take profit and treat yourself, traders. You deserve it!💪🏆🎉
Entry 📈 : "The heist is on! Wait for the MA breakout (0.17000) then make your move - Bullish profits await!"
however I advise to Place Buy stop orders above the Moving average (or) Place buy limit orders within a 15 or 30 minute timeframe most recent or swing, low or high level for pullback entries.
📌I strongly advise you to set an "alert (Alarm)" on your chart so you can see when the breakout entry occurs.
Stop Loss 🛑: "🔊 Yo, listen up! 🗣️ If you're lookin' to get in on a buy stop order, don't even think about settin' that stop loss till after the breakout 🚀. You feel me? Now, if you're smart, you'll place that stop loss where I told you to 📍, but if you're a rebel, you can put it wherever you like 🤪 - just don't say I didn't warn you ⚠️. You're playin' with fire 🔥, and it's your risk, not mine 👊."
📍 Thief SL placed at the recent/swing low level Using the 4H timeframe (0.15000) Scalping/Day trade basis.
📍 SL is based on your risk of the trade, lot size and how many multiple orders you have to take.
🏴☠️Target 🎯: 0.20000 (or) Escape Before the Target
💰💵💸DOGE/USD "DogeCoin vs US Dollar" Crypto Market Heist Plan (Day / Scalping Trade) is currently experiencing a bullishness,., driven by several key factors.👇👇👇
📰🗞️Get & Read the Fundamental, Macro, COT Report, On Chain Analysis, Sentimental Outlook, Intermarket Analysis, Future trend targets.. go ahead to check 👉👉👉🔗
⚠️Trading Alert : News Releases and Position Management 📰 🗞️ 🚫🚏
As a reminder, news releases can have a significant impact on market prices and volatility. To minimize potential losses and protect your running positions,
we recommend the following:
Avoid taking new trades during news releases
Use trailing stop-loss orders to protect your running positions and lock in profits
💖Supporting our robbery plan 💥Hit the Boost Button💥 will enable us to effortlessly make and steal money 💰💵. Boost the strength of our robbery team. Every day in this market make money with ease by using the Thief Trading Style.🏆💪🤝❤️🎉🚀
I'll see you soon with another heist plan, so stay tuned 🤑🐱👤🤗🤩


DOGE Holding Trendline Support – Another Rally Incoming?$DOGE/USDT is currently holding support at the rising trendline, which has historically led to strong upward moves. Every time the Stochastic RSI formed a bullish crossover near this trendline, the price experienced a significant bullish rally.
The Stoch RSI is currently in the oversold zone, similar to previous points where major uptrends started. If history repeats, DOGE could be gearing up for another strong move.
DYOR, NFA

DOGEUSDT 4DDOGE ~ 4D Analysis
#DOGE Time frime 4D forms a bullish flag pattern. Buy gradually from this support block with a minimum target of 20%+.

DOGEUSDT 1DDOGE ~ 1D
#DOGE Buy gradually inside this bullish pattern,. it is only a matter of time that this resistance line is successfully broken. minimum target 15%++

DOGEUSDT 1WDOGE Update ~ 1W
#DOGE So far it still maintains its Bullish structure,. This is wave 2 of the Eliot Wave pattern. Buy gradually within this support block with a minimum target of 20+
DOGE risks falling below $0.20: analysisDogecoin (DOGE) price has dropped over 30% from its yearly high of $0.48 earlier this month. This decline is linked to multiple bearish signals, increasing the likelihood of further price decreases.
As the year draws to a close and bearish pressure mounts, technical indicators point to a further decline in DOGE’s price, possibly slipping below $0.20. Here is why.
A “Death Cross” pattern has been formed on the DOGE/USD one-day chart. This is a bearish pattern that is formed when an asset’s short-term moving average (often the 50-day moving average) crosses below its long-term moving average (commonly the 200-day moving average), suggesting a shift in market sentiment from positive to negative.
Readings from the DOGE/USD chart showed that DOGE’s 50-day MA crossed below its 200-day MA on December 18, and the meme coin’s price has since plummeted by 20%. This crossover is a bearish signal, suggesting a weakening trend, with recent price declines outweighing long-term price gains.
Currently, DOGE is trading below the resistance at $0.33. Persistent spikes in selling pressure at this level could drive its price down to the support at $0.28.
Should this support fail, DOGE’s next key level lies at $0.23. If bulls cannot defend this level, the meme coin could slip below the $0.20 zone, potentially reaching $0.17.
On the other hand, a successful breach of the $0.33 resistance level could propel DOGE towards its yearly peak of $0.48.

DOGEUSDT shortWe have a nice rejection down breakout out from a nice support , giving us a nice fvg on the m30 , i will potentialy look for a sell to 0.1000 😁

DOGEUSDT UpdateDOGE ~ Update
#DOGE Our purchase was fulfilled, We will continue to make purchases in this demand zone 💰

DOGEUSDT 3DDOGE ~ 3D
#DOGE Resistance that continues to be retested will get weaker.
We will start buying gradually inside this pattern.

DOGEUSDT 1WDOGE ~ 1W
#DOGE If the price revisits this support Block. buy it, this is not a bad price to start accumulation.

DOGEUSDT 5DDOGE ~ 5D
#DOGE It looks like CRYPTOCAP:DOGE has finished its decline.
Start accumulating on this support block with small purchases. short term target of at least 10%+
