#DOGS/USDT#DOGS
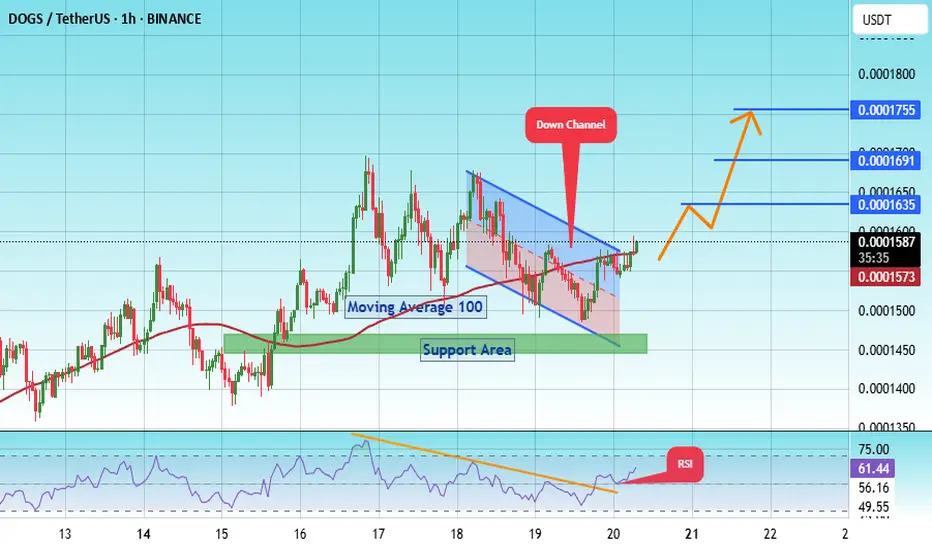
The price is moving within a descending channel on the 1-hour frame, adhering well to it, and is poised to break it strongly upwards and retest it.
We have support from the lower boundary of the descending channel, at 0.0001485.
We have a downtrend on the RSI indicator that is about to break and retest, supporting the upward move.
There is a key support area in green at 0.0001450, which represents a strong basis for the upward move.
Don't forget one simple thing: ease and capital.
When you reach the first target, save some money and then change your stop-loss order to an entry order.
For inquiries, please leave a comment.
We have a trend of stability above the moving average of 100.
Entry price: 0.0001580
First target: 0.0001635
Second target: 0.0001690
Third target: 0.0001755
Don't forget one simple thing: ease and capital.
When you reach the first target, save some money and then change your stop-loss order to an entry order.
For inquiries, please leave a comment.
Thank you.
DOGSUSDT
#DOGS/USDT – Launchpad or Breakdown?#DOGS
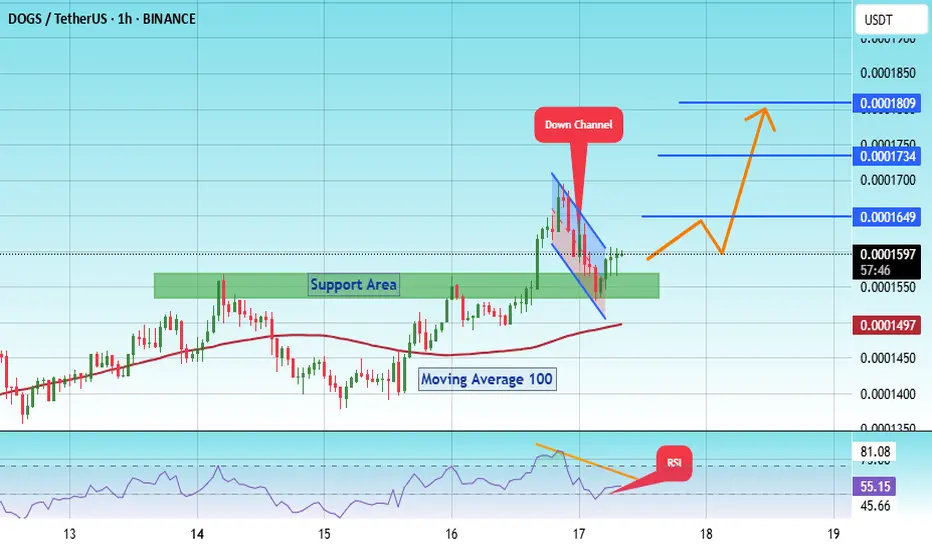
The price is moving within a descending channel on the 1-hour frame, adhering well to it, and is on its way to breaking it strongly upwards and retesting it.
We have a bounce from the lower boundary of the descending channel. This support is at 0.0001500.
We have a downtrend on the RSI indicator that is about to break and retest, supporting the upside.
There is a key support area in green at 0.0001544, which represents strong support as a basis for the upside.
Don't forget one simple thing: ease and capital.
When you reach the first target, save some money and then change your stop-loss order to an entry order.
For inquiries, please leave a comment.
We have a trend of stability above the moving average of 100.
Entry price: 0.0001600
First target: 0.0001650
Second target: 0.0001733
Third target: 0.0001800
Don't forget one simple thing: ease and capital.
When you reach the first target, save some money and then change your stop-loss order to an entry order.
For inquiries, please leave a comment.
Thank you.
#DOGS/USDT – Launchpad or Breakdown?#DOGS
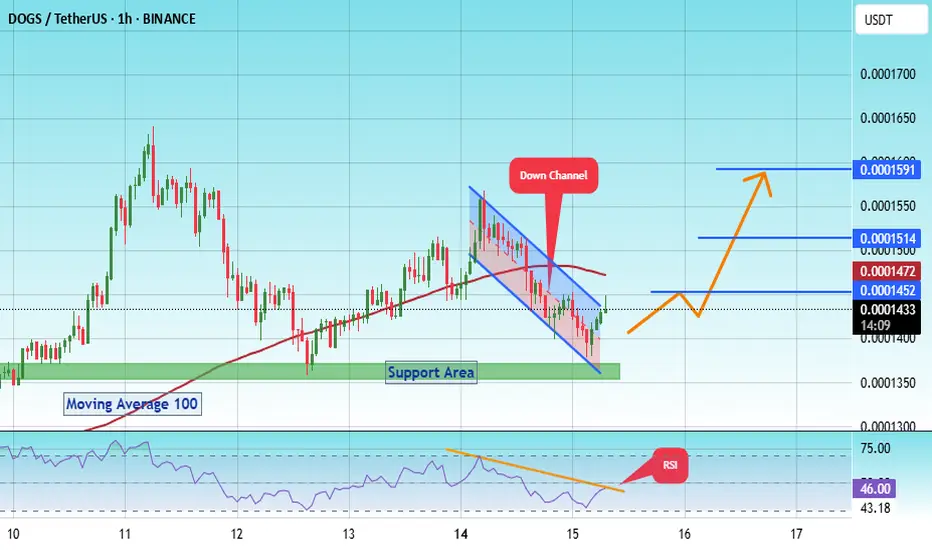
The price is moving within a descending channel on the 1-hour frame, adhering well to it, and is on its way to breaking it strongly upwards and retesting it.
We have a bounce from the lower boundary of the descending channel. This support is at 0.0001385.
We have a downtrend on the RSI indicator that is about to break and retest, supporting the upward trend.
There is a key support area in green at 0.0001362, which represents a strong basis for the upward trend.
Don't forget one simple thing: ease and capital.
When you reach the first target, save some money and then change your stop-loss order to an entry order.
For inquiries, please leave a comment.
We have a trend of stability above the Moving Average 100.
Entry price: 0.0001430
First target: 0.0001452
Second target: 0.0001514
Third target: 0.0001590
Don't forget one simple thing: ease and capital.
When you reach the first target, save some money and then change your stop-loss order to an entry order.
For inquiries, please leave a comment.
Thank you.
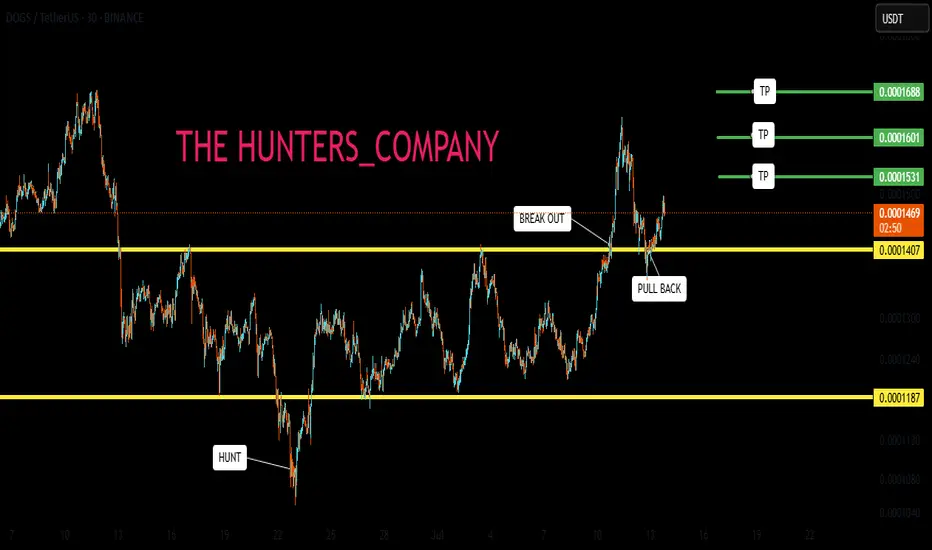
$DOGS/USDT – Triangle Breakout in Play | Trade Setup$DOGS/USDT has broken out of a well-formed symmetrical triangle on the 1H chart, indicating a potential bullish continuation, provided BTC remains steady.
Structure:
Pattern: Symmetrical triangle
Breakout Confirmed: Yes, above 0.0001300
Retest Expected: Likely between 0.0001240 and 0.0001271
Key Levels:
Immediate Resistance:
0.0001300 (Breakout level)
0.0001407 (First major resistance)
0.0001624
0.0001741
Support Zones:
0.0001240–0.0001271 (Retest & entry zone)
0.0001178 (Stop Loss level)
0.0001080 (Major swing support)
Trade Plan:
Entry:
Ideal zone: 0.0001240–0.0001271 (on successful retest)
Avoid entries far above the breakout zone without confirmation
Stop Loss:
Placed below previous swing support at 0.0001178
Targets:
T1: 0.0001407
T2: 0.0001624
T3: 0.0001741
Technical Indicators:
RSI: Trending near 63 (mildly overbought) — watch for divergence or continuation
Volume: Spike confirms breakout, but retest volume should ideally be lower for a healthy setup
Outlook:
If BTC continues holding key levels, DOGS looks ready for a potential move. The risk-reward ratio is favorable on a successful retest, with clear invalidation below 0.0001178.
DYOR | Not Financial Advice

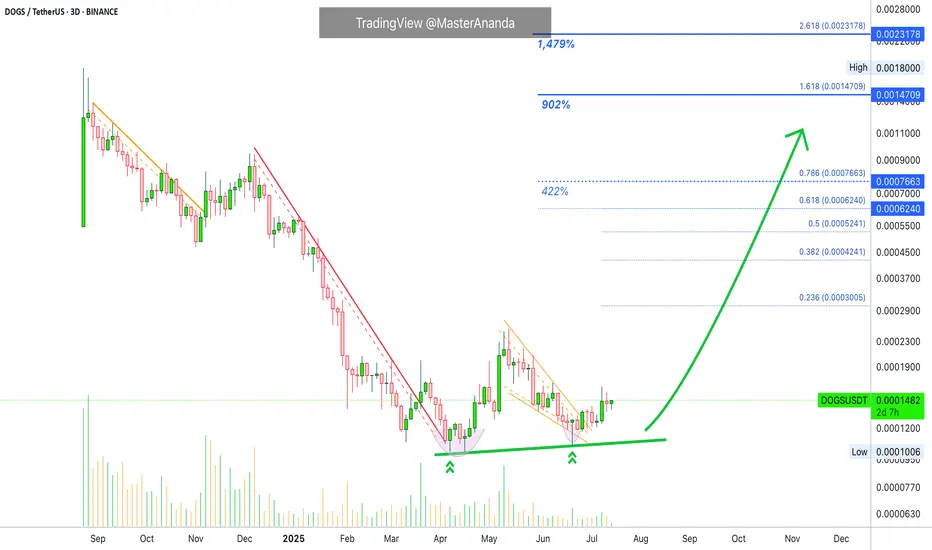
Dogs Update · 1,479% Easy Profits Potential TargetThe first target will be an easy target of 422%. We already talked about creating a position with leverage on this trade. This position is now live and secure, safe and effective, highly profitable with 8X.
Now we are looking at it again because there is still time to have a good entry before a major run. Time is running out though, we have only a few days left. After just a few days, prices will be 100% to 200% up, and then we will see more, more and more. Sustained long-term growth. Additional growth. Higher prices, higher highs, higher heights, forever more.
The bottom and reversal pattern here started in March and the bottom range was activated in February, which means the market is now 162 days sideways at bottom prices. This much consolidation at a market low will result in a massive wave of growth. This consolidation is already over, we just need to see the effect on the market, price and chart.
In a matter of days, one single candle with 3 digits green will change everything and this will happen to hundreds of pairs at the same time. Low prices will be gone but it will be the start of the market euphoria, major excitement and bullish growth.
This is a friendly reminder just to let you know that it isn't too late, but we are running out of time. You will do great. I promise. You have what it takes. It is simple when you know what to expect. Expect growth. Knowing this, you already won.
Namaste.
DOGS BUY !!!Hello friends🙌
📉Regarding the price drop, you can see that the price has been suffering for a while and even the resistance has broken, which is not a valid failure (80% of failures are fake in the range)
📈Now, with the successful failure we had and the moneyback that the price has made, we can expect the price to move to the specified targets. Note that for trading, be sure to observe capital management.
🔥Follow us for more signals🔥
*Trade safely with us*
Dogs:Where is the time and point of purchase?hello friends👋
We come to another analysis, this time a popular coin meme that you requested a lot🔥
Well, let me start with the pattern that we specified for you, which is a sign of a price drop, and you can see this happening...
Now, in the important support areas that we have specified for you, you can buy step by step, of course, with risk and capital management.💰
🔥Follow us for more signals🔥
*Trade safely with us*
#DOGS/USDT#DOGS
The price is moving within a descending channel on the 1-hour frame and is expected to break and continue upward.
We have a trend to stabilize above the 100 moving average once again.
We have a downtrend on the RSI indicator that supports the upward move with a breakout.
We have a support area at the lower boundary of the channel at 0.0001370, acting as strong support from which the price can rebound.
We have a major support area in green that pushed the price upward at 0.0001330.
Entry price: 0.0001380.
First target: 0.0001422.
Second target: 0.0001490.
Third target: 0.0001562.
To manage risk, don't forget stop loss and capital management.
When you reach the first target, save some profits and then change the stop order to an entry order.
For inquiries, please comment.
Thank you.

DOGS/USDT – Preparing to Break Out from Accumulation Zone!
DOGS/USDT is currently at a crucial technical point, offering an exciting setup for both short-term traders and long-term investors. After a prolonged downtrend since mid-2024, the price has now stabilized within a major demand zone, forming what appears to be a classic accumulation structure.
🔍 🔹 TECHNICAL STRUCTURE & PATTERN
Accumulation Zone (Base Area): Price has been consolidating between 0.00010 – 0.00018 USDT, retesting this range multiple times since February 2025.
Stable Volume During Sideways Movement: Indicates that selling pressure has weakened and smart money may be entering.
Bullish Impulse Arrow: Suggests potential for vertical breakout if resistance is broken with strong momentum.
Possible Double Bottom or Rounded Base Formation: Classic bullish reversal patterns indicating trend exhaustion.
✅ Bullish Scenario – Multi-X Potential on Breakout
If DOGS breaks and holds above 0.00023 USDT, this could mark the beginning of a major bullish reversal. Potential targets include:
1. 📍 0.00049155 USDT — Initial resistance, ideal for quick profit-taking.
2. 📍 0.00083986 USDT — Previous price floor turned into a new ceiling.
3. 📍 0.00116782 USDT — A key psychological level that may trigger FOMO buying.
4. 📍 0.00238542 USDT — Mid-term bullish target if trend accelerates.
5. 🚀 0.00867539 USDT — Long-term potential if breakout gains serious momentum.
🧠 Market Psychology Note: Smart money tends to accumulate when retail is uncertain. A breakout from this range can cause a momentum rally as retail joins the move, driving prices up exponentially.
❌ Bearish Scenario – Breakdown Risks
If the price fails to hold above 0.00010 USDT, we may see:
A rejection of the current bullish structure.
A drop toward 0.00007 or even 0.000045 USDT for deeper liquidity grabs.
A prolonged accumulation phase before any potential trend reversal resumes.
📌 Key Takeaway
> DOGS/USDT is at a pivotal point — either poised for a powerful breakout with multi-fold returns or headed for a deeper dip if support is lost. All eyes should be on the 0.00023 USDT resistance as the breakout trigger. A confirmed breakout with volume could present a high-reward trading opportunity.
#DOGSUSDT #CryptoBreakout #AltcoinSetup #ReversalZone #TechnicalAnalysis #CryptoSignals #GateIO #BreakoutTrading #DOGS #BullishSetup

#DOGS/USDT Breakout in Play ?#DOGS
The price is moving within a descending channel on the 15-minute frame and is expected to break it and continue upward.
We have a trend to stabilize above the 100 moving average once again.
We have a downtrend on the RSI indicator that supports the upward move with a breakout.
We have a support area at the lower boundary of the channel at 0.0001527, acting as a strong support from which the price can rebound.
We have a major support area in green that pushed the price upward at 0.0001493.
Entry price: 0.0001570.
First target: 0.0001610.
Second target: 0.0001650.
Third target: 0.0001712.
To manage risk, don't forget stop loss and capital management.
When you reach the first target, save some profits and then change the stop order to an entry order.
For inquiries, please comment.
Thank you.

#DOGS/USDT Long ?#DOGS
The price is moving within a descending channel on the 1-hour frame, adhering well to it, and is on its way to breaking it strongly upwards and retesting it.
We have a bounce from the lower boundary of the descending channel. This support is at 0.0001192.
We have a downtrend on the RSI indicator that is about to be broken and retested, supporting the upward trend.
There is a key support area (in green) at 0.0001180, which represents a strong basis for the upward trend.
Don't forget one simple thing: ease and capital.
When you reach the first target, save some money and then change your stop-loss order to an entry order.
For inquiries, please leave a comment.
We have a trend of stability above the moving average of 100.
Entry price: 0.0001250
First target: 0.0001276
Second target: 0.0001314
Third target: 0.0001355
Don't forget one simple thing: ease and capital.
When you reach the first target, save some money and then change your stop-loss order to an entry order.
For inquiries, please leave a comment.
Thank you.

Dogs: Friendly Reminder, Bullish Wave in the Making (5-8X Lev.)We looked at Dogs rencelty, DOGSUSDT, and market conditions continue to improve. The higher low is confirmed and the action is turning bullish now with Bitcoin trading near a new all-time high. This is a friendly reminder.
This is the last chance to join the wave before a major advance. We are about to witness long-term growth and this chart setup can be approached with 5X, relatively low risk and up to 8X which is higher risk but also a higher potential for reward.
Make sure to do your planning as leveraged trading should be approached by experts only, not recommended for beginners.
How to trade
Very easy, buy and hold. Set up your position and then wait patiently. As soon as the trade reaches 200-300% profits, secure it. Once the profits reach 500-800%, you can close your position and go find a new chart setup, or you can continue to hold long-term as your trade is already secured from the first advance.
There are many more ways to approach this and other pairs, this is just one example.
Plan ahead of time. Aim high. Hold strong.
Wishing you great success and huge profits.
Thanks a lot for your continued support.
Namaste.

#DOGS/USDT#DOGS
The price is moving within a descending channel on the 1-hour frame and is expected to break and continue upward.
We have a trend to stabilize above the 100 moving average once again.
We have a downtrend on the RSI indicator that supports the upward move with a breakout.
We have a support area at the lower limit of the channel at 0.0001230, acting as strong support from which the price can rebound.
Entry price: 0.0001261
First target: 0.0001286
Second target: 0.0001314
Third target: 0.0001352

#DOGS/USDT#DOGS
The price is moving within a descending channel on the 1-hour frame, adhering well to it, and is on its way to breaking it strongly upwards and retesting it.
We have a bounce from the lower boundary of the descending channel. This support is at 0.0001188.
We have a downtrend on the RSI indicator that is about to break and retest, supporting the upward trend.
There is a key support area in green at 0.0001176, which represents a strong basis for the upward trend.
Don't forget one simple thing: ease and capital.
When you reach the first target, save some money and then change your stop-loss order to an entry order.
For inquiries, please leave a comment.
We have a trend of stability above the Moving Average 100.
Entry price: 0.0001235
First target: 0.0001268
Second target: 0.0001300
Third target: 0.0001344
Don't forget one simple thing: ease and capital.
When you reach the first target, save some money and then change your stop-loss order to an entry order.
For inquiries, please leave a comment.
Thank you.

Dogs Can Yield 8,288% with 8X Leverage (Great Timing!)You are going to love me for giving you this... Why? Because you can make easily 1,000% profits. Perfect entry, perfect price, perfect timing. Easy win.
The market moves based on cycles and within these cycles we have waves... Good afternoon my fellow Cryptocurrency trader, how are you feeling today?
Feeling that feeling you get when you know you are getting close to something great.
Technical analysis
Let's focus on the chart. DOGSUSDT is now starting to recover from a higher low. Let's keep it very simple. Look at the chart and go back to 17-April. See? From this date prices start to grow until resistance is hit. It is the same. Starting 22-June the market starts growing slowly, building up speed; bullish momentum grows. Then resistance will be found at a strong higher high.
The main target for this chart setup and trade is 0.0007663. With 8X leverage this target, from current price, has a profits potential beyond 3,000%. There are even higher targets on the chart.
That's why I mention 1,000% at the start. It is very easy to collect 1,000% on this pair if you are smart. Not that smart just patient and wise... Well, you can do it if you truly want. I'll see you at the top.
Opportunities are endless.
This is just one and many more will be coming your way.
Put some time and effort into your trading, your buying and selling, and watch your capital grow. Together we can win.
Thanks a lot for your continued support.
Namaste.

Dogs, A New Round Of Growth, Easy 385% Target (1,045% Strong)Good afternoon my fellow Cryptocurrency trader, how are you feeling today?
Dogs has been bearish for more than a month after producing a nice ~150% jump after the market bottom. Would you say, 150% is big or small? Is this good or not good enough?
I say it all depends on how you approach the market. This type of move is awesome for short-term traders as well as leveraged traders, good profits can be made.
Long-term traders, well, they trade long-term so short-term moves make no sense. They don't make any difference.
Profits potential
The good news for long-term traders is that the "strong target" for DOGSUSDT is also an easy target and goes beyond 11X, 1,045% profits potential (PP).
The easy target is 385% and for a leveraged trader, with as little as 5X this can translate into 1,925%, but the risk is higher. Higher rewards potential but also higher risk. How you choose to trade depends on your risk tolerance, your capital, your goals.
I think this is a good chart setup, timing is great.
Market conditions and sentiment
Notice something, the market is quiet.
Notice something, there is no hype and no major event. People are not rushing to buy either. This means we are witnessing a market low. This is the exact-perfect time to buy and hold. When people are not watching or distracted doing other things, that's when the market grows. When the market has been growing for a long time, watch out because a correction tends to follow.
Now DOGSUSDT, and many other projects, have been bearish, or sideways, for more than a month. You see? After a month of rising prices you get a correction; April-May. After a month of bearish action you will get a bullish wave; May-June. The proof will come based on the results.
Timing is right, it should only take a few days. And the price is awesome. The downside is very limited almost fully exhausted.
Risk tolerance and trading approach
With all that said, be careful how you enter and how you trade. The market is tricky and tends to shake you out even if you hold a strong hand. Your position might not be at risk but with a sudden move, if you are unprepared, you can become anxious and fold at a loss. That is why planning is of the utmost importance. Just answer the question, how long am I willing to wait holding this pair? If it moves down, will I hold long-term or should I set a stop-loss?
Some people give up after 20%, that's ok. Because if you cap all your loses at 20%, then you cap your wins at 100% and 200%. You can end up winning long-term if you pick more winners than losers and that's easy with spot trading and the charts that I share daily.
Thank you for reading.
Namaste.

#DOGS/USDT#DOGS
The price is moving within a descending channel on the 1-hour frame, adhering well to it, and is on its way to breaking it strongly upwards and retesting it.
We are seeing a bounce from the lower boundary of the descending channel. This support is at 0.0001311.
We have a downtrend on the RSI indicator that is about to break and retest, which supports the upward trend.
We are looking for stability above the 100 moving average.
Entry price: 0.0001337
First target: 0.0001367
Second target: 0.0001395
Third target: 0.0001432

#DOGS/USDT#DOGS
The price is moving within a descending channel on the 1-hour frame, adhering well to it, and is heading toward a strong breakout and retest.
We are experiencing a rebound from the lower boundary of the descending channel. This support is at 0.0001608.
We are experiencing a downtrend on the RSI indicator, which is about to break and retest, supporting the upward trend.
We are heading toward stability above the 100 moving average.
Entry price: 0.0001676
First target: 0.0001700
Second target: 0.0001732
Third target: 0.0001745

#DOGS/USDT#DOGS
The price is moving within a descending channel on the 1-hour frame, adhering well to it, and is heading for a strong breakout and retest.
We are experiencing a rebound from the lower boundary of the descending channel. This support is at 0.0001575.
We are experiencing a downtrend on the RSI indicator that is about to be broken and retested, supporting the upward trend.
We are in a trend of consolidation above the 100 moving average.
Entry price: 0.0001604
First target: 0.0001656
Second target: 0.0001656
Third target: 0.0001680

#DOGS/USDT#DOGS
The price is moving within a descending channel on the 1-hour frame and is expected to break and continue upward.
We have a trend to stabilize above the 100 moving average once again.
We have a downtrend on the RSI indicator that supports the upward move with a breakout.
We have a support area at the lower boundary of the channel at 0.0001400, acting as strong support from which the price can rebound.
Entry price: 0.0001412
First target: 0.0001465
Second target: 0.0001511
Third target: 0.0001570

Dogs 4X Lev. Full PREMIUM Trade-Numbers (PP: 1608%)Dogs bottom is now confirmed and this is a chart setup with low risk vs a high potential for reward.
The bottom signal comes from a pattern, the breakdown of the downtrend, high volume after the first main low and current price action as well as marketwide action and Bitcoin being strong. These are just a few of the signals that support additional growth.
I get a sense that this pair will be bought heavily during the bullish phase. The same goes for Notcoin and Toncoin, these projects have very strong support and should be considered seriously by smart, profitable and successful Cryptocurrency traders.
I am sharing a set of numbers here for reference only, what you do is up to you.
This is not financial advice.
–––––
LONG DOGSUSDT
Leverage: 4X
Entry levels:
1) 0.0001600
2) 0.0001450
3) 0.0001300
Targets:
1) 0.0001786
2) 0.0001999
3) 0.0002300
4) 0.0002600
5) 0.0003000
6) 0.0003600
7) 0.0004241
8) 0.0005241
9) 0.0006240
10) 0.0007663
Stop-loss:
Close weekly below 0.0001240
Potential profits: 1608%
Capital allocation: 4%
–––––
If you enjoy the content, you can consider a follow to show your support and get more. It is 100% FREE forever. It is truly my pleasure to write for you.
Thanks a lot for reading.
You can ask any questions in the comments section below.
Namaste.

#DOGS/USDT#DOGS
The price is moving within a descending channel on the 1-hour frame and is expected to break and continue upward.
We have a trend to stabilize above the 100 moving average once again.
We have a downtrend on the RSI indicator that supports the upward move with a breakout.
We have a support area at the lower limit of the channel at 0.0001922, acting as strong support from which the price can rebound.
Entry price: 0.0001994
First target: 0.0002055
Second target: 0.0002147
Third target: 0.0002255

DOGS : be carefulHello friends
As you can see, after the price growth we had, the price has fallen. Given the severity of the fall, we recommend that you buy in stages, manage your risk and capital, and move with it to the specified goals.
*Trade safely with us*
