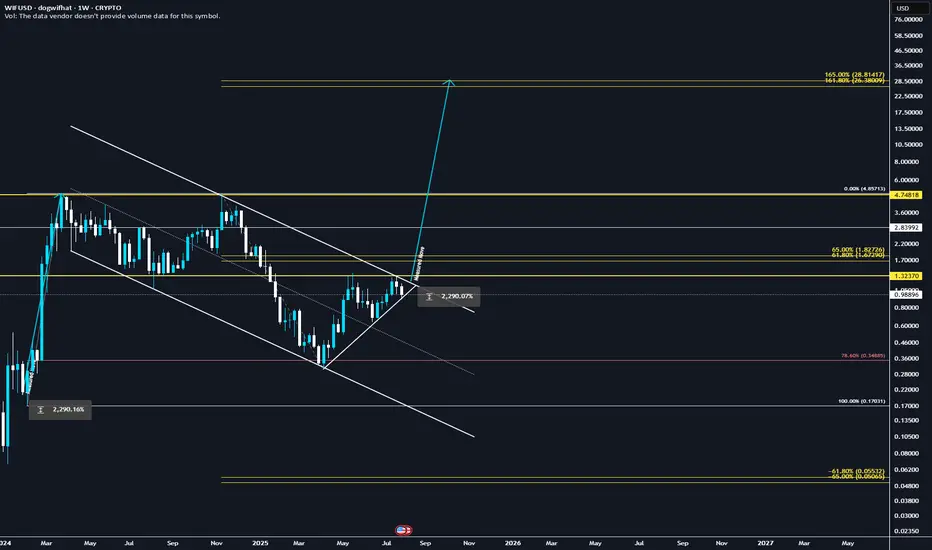
They're lying! WIF will explode to 28.8$ ✅ Golden Pocket Extension: $28.80 aligns with the 1.618–1.65 fib extension (golden pocket zone) from the last major impulse.
✅ Measured Move: Breakout from the prior downward consolidation projects to ~$28.80 when using the height of the range added to the breakout point.
✅ Confluence = High Probability: Both fib extension and measured move target the same zone, increasing confidence.
✅ Momentum + Meme Rotation: If broader meme coin rotation continues, WIF has narrative + volatility fuel.
Dogwifhat
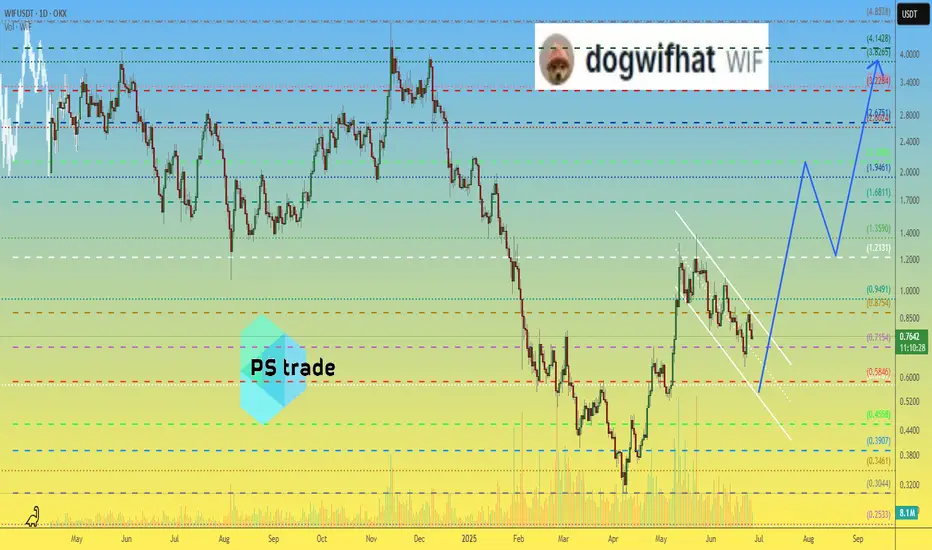
WIFUSD - dogwifhat Crypto Analysis$WIF.X $1.18 PT over the course of the next month if we can break that higher level of resistance. Entry at $0.93 with a $0.85 Stop Loss on the 3:1 RRR. IF we hold that long at least... Will position a shorter stop to be conservative so If we lose momentum, we would look for re-entry at the smaller compression zone which also rest at the $0.85 Price Levels. #WIF #MyMIWallet #TradeAnalysis

WIF back to $3Complete look at Dog WIF Hat
We had some pretty nice technical setups on this meme.
#HVF
#DoubleTop
#InverseHeadandShoulders
#BullFlag
Currently it has two active patterns ...

dogwifhat WIF price analysis🤪 "They" are trying to breathe "new life" into #WIF . And if they manage to keep the price of OKX:WIFUSDT above $0.55, this plan will have a chance of success.
So what do we have:
◆ #WIF holders need to keep their fingers crossed that everything will work out and there will soon be growth, and with it a chance to get out of a prolonged "draw fall"
◆ Traders need to wait for confirmation that the price of #WIFUSD is holding steady above $0,55.
And no large trading leverage, because this is a fairly volatile meme coin, even x5 leverage, which allows for a -19% error, or x3, which forgives a “miss” of -32% from the entry point, can liquidate your deposit when trading volatile assets.
⁉️ Do you believe that the price of #dogwifhat can still return to the $4 range with a corresponding project capitalization of $4 billion?
_____________________
Did you like our analysis? Leave a comment, like, and follow to get more
Breaking: Dogwifhat Tanks 13% TodayBuilt on the solana ecosystem, a token embroidering the dog with a hat narrative saw its price tank 13% today amidst general crypto dip.
With the RSI at 39 could more dip be looming ahead. For now the asset is in a steep falling wedge pattern so a reversal could be feasible. Given that SEED_WANDERIN_JIMZIP900:WIF once had an All-time-high of $4.85 rising from an all time low of $0.00002344 representing a whooping +2452405.65% gains, SEED_WANDERIN_JIMZIP900:WIF could pull out such fit again with a market cap of $564.14M this adds more credence to the bullish comeback of $WIF.
dogwifhat Price Live Data
The live dogwifhat price today is $0.574867 USD with a 24-hour trading volume of $627,598,272 USD. We update our WIF to USD price in real-time. dogwifhat is down 12.29% in the last 24 hours. The current CoinMarketCap ranking is #98, with a live market cap of $574,200,548 USD. It has a circulating supply of 998,841,059 WIF coins and the max. supply is not available.

Bullish Shark On $WIF's Monthly ChartI haven't really posted much on Carney's Harmonic Patterns, but as I was working on some material for The Litepaper, I glanced at dogwifhat's monthly chart and noticed it looked very much like shark pattern - but I wasn't even 80% sure. Had to pull out my notes.
Turns out, dogwifhat's monthly candlestick chart is a perfect Bullish Shark Pattern
AB = 0.982 of XA → Nearly a 1.0 retracement, which fits within the Shark's extended AB range (0.886 – 1.13 XA).
BC = 0.992 of AB → Deep retracement, typical of Shark formations where BC is 0.50 – 1.00 of AB.
CD = 1.147 of BC → Falls within the expected 1.13 – 1.618 BC extension for a Shark.
XD = 1.125 of XA → Bulls-eye confirmation—Shark patterns complete at 1.13 – 1.618 XA extension, and your 1.125 is right in that range.
Given Carney's rules, the targets are the 50%, 61.8% and full reversal of CD:
$2.67
$3.04
$4.83
Will be fun to see how it plays out.
If there's a dip below $0.40, then it's invalidated.

WIF Is Going To Come Down Hard Be CarefulWIF is way overextended and overvalued. There is bearish divergence on many indicators on almost all higher timeframes. I think WIF comes down to tap the trendline at $1.40 and a small bounce then it falls swiftly into the wedge again. Where is goes from there I dont know but I will update the chart at that time.
This is not finainclal advice this is just my opinion.
LIKE, AND FOLLOW ME + THIS IDEA FOR CONSTANT UPDATES. THANK YOU

Dogwifhat Coin (WIF): Possible Double Top Pattern / FallingDogwifhat coin seems desperate, where price is looking like it is about to fall hard.
We noticed on bigger timeframes the formation of a "double top" pattern, which upon breaking the neckline zone would result in a possible 60% downfall so keep attention at that neckline zone for now!
Swallow Team

WIF long term 300%+Now or never region for WIF around 0,9-1,3 usd. Very nice R:R. There is potential to see new ATH this year as volume is in place and smart money as well. Buy and hold.
THIS IS NOT A FINANCIAL ADVICE
MANAGE YOUR RISK AND ALWAYS USE STOPLOSS

WIF Can Hit $2—But It Depends on U.S. Inflation DataDogwifhat (WIF) surged 16% after the Fed rate decision, fueled by Jerome Powell’s comments that rate cuts could happen even if inflation remains above 2%. This statement lifted Bitcoin to $105K, sparking rallies across altcoins and memecoins, including WIF.
However, can WIF sustain this momentum and reclaim $2?
On the daily chart, WIF’s On-Balance Volume (OBV) spiked, indicating strong trading activity, with $326M in daily volume recorded on February 29—far exceeding March 2024 bid volumes. Despite this, OBV has yet to make a higher high, meaning further traction isn’t confirmed. Meanwhile, the RSI has only partially recovered from oversold levels, remaining below neutral—suggesting weak buying pressure.
Coinalyze data shows that WIF’s rally was fueled by both the Spot and Futures markets, with Open Interest (OI) jumping over 40% during the pump. However, OI has since declined, while Cumulative Volume Delta (CVD) on the Spot market remains steady, signaling continued demand.
For WIF to push past $2, upcoming U.S. inflation data (PCE index) needs to favor risk assets. If inflation data comes in weak, rate-cut expectations could drive another memecoin rally. But if inflation stays high, bearish sentiment could drag WIF below $1 again.
WIF traders should watch macroeconomic updates closely—this could be the key to the next big move! 🚀

WIFUSDT(dogwifhat) Updated till 30-01-25WIFUSDT(dogwifhat) Daily timeframe range. this thing is on local low. if it can defend 1.058 you got yourself a very good risk and reward setup. thats a fact. but 1.058 need to be protected or stay above. resistance to look at 1.492.

WIFUSD targeting $3.00 on this Channel Down bottom signal.Dogwifhat (WIFUSD) has been trading within a Channel Down pattern on the 1W time-frame, which on the greater scale looks like a giant Bull Flag. Regardless of that, the price almost hit the pattern's bottom (Lower Low trend-line) and with the 1W RSI stabilizing like on the August 05 2024 Low, we should now see that start of its technical Bullish Leg.
The previous Bullish Leg reached marginally above the 0.786 Fibonacci retracement level, so our current Target is $3.000.
-------------------------------------------------------------------------------
** Please LIKE 👍, FOLLOW ✅, SHARE 🙌 and COMMENT ✍ if you enjoy this idea! Also share your ideas and charts in the comments section below! This is best way to keep it relevant, support us, keep the content here free and allow the idea to reach as many people as possible. **
-------------------------------------------------------------------------------
💸💸💸💸💸💸
👇 👇 👇 👇 👇 👇

WIF dogwifhat EW Count looks clearHey hey
EW count looks pretty clear for me here
Expect one more wave down and global reversal
Do not forget to follow me on X

dogwifhat (WIF)Technical Analysis of WIF Coin 🟢
Key Zones and Market Structure:
Main Support (Green Zone):
The long-term market floor lies within the range of 1.393 – 1.482, a zone where buyers have previously entered with strong momentum.
Main Resistance (Red Zone):
The range of 4.015 – 4.346 serves as a significant ceiling, acting as a major barrier to new highs.
Current Price Analysis: The price is currently trading at 2.061 and is attempting to break through the intermediate resistance at 2.178 – 2.268 with sufficient buying volume. The price's reaction to this level will determine its short-term direction.
Bullish Scenario:
✅ First Target (TP1):
If the current resistance is broken and the price moves past the 2.178 – 2.268 range, the next likely move will be toward the 2.821 – 2.989 area.
✅ Second Target (TP2):
Should the price continue with high volume and break through TP1, the final target will be in the range of 4.015 – 4.346, which represents the ideal exit point.
Key Point: Trading volume must increase during key level breaks; otherwise, the risk of a false breakout (fakeout) rises.
Bearish Scenario:
❌ Stage 1:
If the current resistance holds, the price may decline to the support range of 1.741 – 1.828.
❌ Stage 2:
If the gray support level is breached, the next support target will be at 1.393 – 1.482.
Key Point: A decrease in trading volume near key support levels could signal a deeper price drop.
Volume Analysis:
Volume increase near key zones (resistances and supports) is essential.
A decrease in volume when attempting to break resistance increases the likelihood of a fakeout.
RSI and Momentum Analysis:
📉 RSI Trendline:
Breaking the descending RSI trendline, along with crossing the 50 level, could confirm the beginning of a bullish wave.
📈 Overbought Zone:
If RSI enters the 76.86 – 80.48 range, the price may face corrective pressure in the upper resistance zones.
Suggested Strategy for Professional Traders:
Enter the market only after a confirmed breakout of resistance with high volume.
Use a scaling-in strategy to minimize risk.
Set stop-loss orders below key support zones to protect capital.
Final Summary:
This analysis identifies the key levels and possible scenarios for WIF Coin. Price action around critical support and resistance zones, combined with trading volume, will determine the future trend. For market entry, wait for confirmation of breaks or reactions at the specified levels.

WIFUSD There is no better time to buy it than now.DOGWIFHAT / WIFUSD is trading inside a Channel Up everu since the August 5th bottom.
The price is right now around the 1day MA50 and above the 1day MA100, just at the bottom of the Channel Up.
The 1day MA100 formed the previous Higher Low of November 4th, which was marginally under the Channel.
Technically this is the best level to enter a buy, seeing also the 1day CCI oversold, which was a strong buy signal twice inside this pattern.
Buy and target 4.700 (+80.92% rise).
Follow us, like the idea and leave a comment below!!

Just in: Robinhood Listed Solana Memecoin Dogwifhat ($WIF)Dogwifhat ( CRYPTOCAP:WIF ), the Solana-based memecoin, has taken the spotlight after being listed on Robinhood on November 25, 2024. This milestone marks a pivotal moment, propelling CRYPTOCAP:WIF into mainstream visibility and sparking excitement within the crypto community.
Fundamental Analysis
Dogwifhat’s listing on Robinhood, one of the top US centralized exchanges (CEX), underscores growing institutional interest in memecoins, particularly those on the Solana network. This listing has led to a 7% price surge, with CRYPTOCAP:WIF trading around $4. Analysts anticipate further upward momentum, with targets set at $10 ahead of Thanksgiving.
Trading volume has also skyrocketed, with CRYPTOCAP:WIF registering a 24-hour volume of over $1.4 billion—an increase of 23.9%. This surge reflects heightened market activity and investor confidence. Additionally, the current market cap stands at $3.36 billion, ranking it #47 on CoinGecko, a remarkable feat for a meme token.
Technical Outlook
From a technical standpoint, CRYPTOCAP:WIF is displaying strong bullish signals. The Relative Strength Index (RSI) is currently at 56, indicating room for further growth before entering overbought territory. Notably, CRYPTOCAP:WIF recently emerged from a falling wedge pattern—a bullish reversal indicator. This breakout could propel the price past $4, with $5 as the next key resistance level and $10 within reach.
Adding to the optimism, CRYPTOCAP:WIF has formed a golden cross pattern over the past two weeks, where the short-term moving average crosses above the long-term moving average. This pattern historically signifies the start of a major uptrend. Furthermore, support from prominent figures like Arthur Hayes and the growing DEGEN CULT community provides additional bullish sentiment, reinforcing the expectation of CRYPTOCAP:WIF shaking up the memecoin market.
The Road Ahead
With its Robinhood listing and favorable technical indicators, CRYPTOCAP:WIF is well-positioned to capitalize on the growing interest in Solana-based memecoins. As market conditions align and momentum builds, all signs point toward CRYPTOCAP:WIF breaking new highs, potentially setting the stage for a transformative rally in the memecoin sector.
Investors and traders are watching closely—this might just be the beginning of Dogwifhat’s rise to the top of the memecoin economy. 🚀

DogWiFHat: A smart hat for your wallet!Memesession season continues! Dog in the hat, target on the schedule. Technically you will see the final 5 wave, which will end in the area at the 2 fibonacci level. Believe in something!
Horban Brothers.

dogwifhat WIF price is preparing to pleasantly surpriseYesterday, when the crypto market was falling, CRYPTOCAP:WIF price held up quite well. This may mean that the growth target has not yet been reached.
In continuation of our global idea from 07.05.24, where we wrote that buying OKX:WIFUSDT at $1.35 is not a bad idea!)
Now we can assume that #dogwifhat buyers are preparing to exit the protracted upward correction channel.
As long as the price of #WIFUSD is in the range of $2-2.25 and above, the upward trend remains.
TP1 - $3.50
TP2 (medium term) - $4.80
_____________________
Did you like our analysis? Leave a comment, like, and follow to get more

Phemex Analysis #29: RSI Divergence Raises Concerns for WIFPHEMEX:WIFUSDT.P has experienced a remarkable 93% surge over the past month, indicating a significant increase in market confidence. However, recent price action has shown signs of weakness, raising questions about the sustainability of this bullish momentum. A 1D RSI divergence observed on October 14th further complicates the picture, as the price is rising while the RSI is declining.
Analyzing the RSI Divergence
A 1D RSI divergence occurs when the price creates a higher high, but the RSI forms a lower high. This divergence often signals a potential reversal or a pause in the uptrend. In the case of WIF, the divergence suggests that the buying momentum may be waning, and a correction or consolidation phase could be imminent.
Overall Bullish Sentiment
Despite the recent divergence, the overall bullish sentiment surrounding WIF remains strong. The 93% surge over the past month is a clear indication of growing investor interest and confidence in the project. This positive sentiment could continue to drive the price higher, especially if there are further developments or announcements that support the bullish narrative.
Potential Scenarios
1. Continuation of Upward Trend: If WIF can overcome the RSI divergence and sustain its upward momentum, the price could continue to rise. Positive news, increased adoption, or favorable market conditions could fuel further gains.
2. Temporary Correction: A correction or consolidation phase may be necessary to digest the recent gains and allow for a more sustainable uptrend. If the price retraces but remains above key support levels, it could be seen as a healthy buying opportunity.
3. Reversal: In the worst-case scenario, the RSI divergence could signal a reversal of the uptrend. However, this would require a significant breakdown below key support levels and a change in market sentiment.
Potential Trading Strategy
Given the current market conditions, a cautious approach may be prudent. Traders could consider the following strategies:
I. Partial Profit Taking: For those who have already realized substantial gains, taking profits on a portion of their position could help protect against potential losses.
II. Tight Stop-Loss Orders: Placing tight stop-loss orders below key support levels can help limit losses in case of a sudden price decline.
III. Wait for Confirmation: Traders could wait for a clear breakout above the resistance level or a confirmation of a bullish reversal pattern before entering new positions.
Conclusion
While WIF's recent surge is a positive sign, the RSI divergence suggests that a period of consolidation or correction may be necessary. Traders should be mindful of the potential risks and carefully evaluate the market conditions before making investment decisions. If WIF can successfully overcome the current challenges, it has the potential to continue its upward trajectory.
Tips:
Trade Smarter, Not Harder with Phemex. Benefit from cutting-edge features like multiple watchlists, basket orders, and real-time strategy adjustments. Our unique scaled order system and iceberg order functionality give you a competitive edge.
Disclaimer: This is NOT financial or investment advice. Please conduct your own research (DYOR). Phemex is not responsible, directly or indirectly, for any damage or loss incurred or claimed to be caused by or in association with the use of or reliance on any content, goods, or services mentioned in this article.

WIFUSD is breaking above its 6-month Channel Down and targets 75Dogwifhat (WIFUSD) closed last week above the 1D MA200 (orange trend-line) for the first time since the week of July 22 and hit the top of its 6-month Channel Down. On the long-term cyclical outlook, this Channel Down can technically turn out to be nothing but a Bull Flag in the continuation scale of the Bull Cycle.
If this week's 1W candle manages to close above the Channel Down/ Bull Flag, we expect at least another +6842% rise, similar to its first one, and target $75.000.
The 1W RSI and MACD both support this bullish scenario as the first already broke above its MA line on September 16, while the 1W MACD just completed a Bullish Cross, its first ever.
-------------------------------------------------------------------------------
** Please LIKE 👍, FOLLOW ✅, SHARE 🙌 and COMMENT ✍ if you enjoy this idea! Also share your ideas and charts in the comments section below! This is best way to keep it relevant, support us, keep the content here free and allow the idea to reach as many people as possible. **
-------------------------------------------------------------------------------
💸💸💸💸💸💸
👇 👇 👇 👇 👇 👇

dogwifhat (WIF) targets $2.70: analysisDogwifhat (WIF) stands as the largest meme coin on Solana, though it still lags behind DOGE, SHIB, and PEPE. Recently, WIF price saw an 11% increase in value within 24 hours, yet its social dominance remains relatively low.
The EMA lines for WIF’s price indicate a steady upward trend, suggesting a positive outlook. This trend suggests that meme coin could surpass the $2.7 level again soon.
Meanwhile, WIF’s current ADX reading of 33, combined with its bullish trend, indicates a moderately strong upward momentum in the market. This suggests that WIF is experiencing sustained buying pressure, and the upward price movement has solid backing, potentially leading to further gains if the trend continues.
The 4-hour price chart for WIF shows a bullish configuration. All the Exponential Moving Average (EMA) lines are positioned below the current price. The short-term EMA lines are above the long-term EMA lines, with a noticeable gap between them.
This setup is generally viewed as a positive sign for investors.
The sensitivity of EMAs to recent price movements helps traders identify the direction of the trend more quickly and accurately. Overall, the WIF 4-hour price chart displays encouraging signals that could be of interest to investors.
Given this positive momentum, WIF could potentially target a price of $2.70 if the current trends persist. However, it’s important to exercise caution, as a potential downward trend could see WIF’s price fall to $1.44.
This highlights the need for investors to closely monitor market signals and be prepared to adjust their strategies accordingly. While the current scenario appears favorable for WIF, competition is heating up, with BONK and POPCAT potentially attracting money that could go into WIF.

How Spotting Liquidity Can Help Your Trading StrategyUnderstanding where liquidity exists in the market can help enhance your trading success in a few ways:
1. It can help you understand where potential blocks of liquidation could occur. The market is often attracted to these block and will liquidate there.
2. It can help you confirm patterns that exist on you charts
3. It can help you spot new patterns which you may not have spotted previously.
Let's take a quick look at the "Liquidity Swings" indicator by LuxAlgo in this video.

WIF TO $9.7!!!!WIF is currently in the wave 4 triangle formation, consolidating as it tests the critical phase before a potential breakout. If we successfully rally into wave 5, there's a strong potential for up to 7x returns.
