📖 Japanese candlestick charts. Part 2Hello, we continue to study candlesticks.
⚡️ Maximal/minimal
🔶 For this it is desirable for reversal candlestick to have its own high/low. In addition to the convenience of placing stop-loss on them, its own minimum/maximum also increases the chances for a long term trend after such reversal. The reason for this is in the market reflectivity, all the patterns don’t just work on their own, but they also contain market’s psychology and the methodology of huge amounts of smart money. When there is a decrease in demand and supply, smart money form the least resistant trend, and they trade!
🔶 You have probably noticed a few times that the figure’s/pattern’s price could move into the opposite direction that you expected. There are reasons for that, patterns have the necessary to complete conditions, simply of which not many know about. Even if all the necessary conditions are complete while forming a pattern, there is always a chance that the price will go opposite direction due to a number of reasons, of which we are going to talk about later. Now, you should note that its important to analyse candlesticks, as they help you to minimize risk while trading patterns.
🔶 Even though candlesticks look simple, they are a solid foundation for successful trading. They help you to find the optimal points to enter and exit trading in any patterns or whether you are trading using levels, or even if you are witnessing “third Elliott wave”... This is just a small bit of information about such a simple tool called Japanese candlesticks.
📌 Hint: if a trend is moving into a higher timeframe, you should also move to the same timeframe and start searching for reversal candlestick models at a long distance. This gives you the opportunity to trade for the entire trend duration.
⚡️ Harami
🔶 "Uptake", "Hammer" and "Cloud Silver Lining" models are common reversal patterns. There are many more forms in candlestick analysis that indicate an forthcoming reversal. One of them is the "Harami" pattern: the first candlestick is large, and the second one is small, it may be a "Spinning Top" or a "Doji", but in any case, the figure of the second candlestick is inside the first one's figure. They appear both at the top of the market and at the bottom.
🔶 The peculiarity of the "Harami" model is the uncertainty of the market at the time of its appearance. Therefore, it is recommended to wait for confirmation.
📌 The following candlestick of the corresponding color can act as confirmation: green for a bullish reversal, and red for a bearish one.
Doji

Facebook may fall here to provide us a new entry.Company is very well run, I think it may rise higher, but I will be looking to long after it tags the 20dma and keeps bullish momentum, or if it tags the bottom of the wedge with a nice reversal in price action.
What we see here is a bearish doji in my opinion right after it tagged a lower high...

Harami followed by dojiHarami p-attern noticed followed by doji, indicating uncertainty in bulls.
It might touch 430ish.
Setup -
Short @495-490
Stoploss @512
Target @437
For educational purpose only, trade at your own risk.

Long or Short?This candle should be decision for long or short. I’ll short it if this candle end with a doji.


DE30 Index Trade Idea DE30 Trade Idea.
Currently price is bullish. Price has broken above the resistance level which now may slowly turn into a support level. Waiting for a possible retest of this level and a further confirmation before placing a buy trade.
However, price has also met the daily high level and we could see a possible trend reversal should price fail to continue its bullish run. Should such happen I will wait for a retest of the level as resistance as well as a confirmation and place a sell.
I also speculate a possible doji candlestick forming hence the trend reversal.
Minimum R/R - 1:1

Amara Raja Batteries from 4 July 2020April-May has shown considerable Upside movement
June - July month is showing consolidation period ...
prices has touched the red zone thrice ==> also showing breakout ( very high volume )
Daily chart is showing evening doji pattern ....
Future price movement can be expected in two ways ..
1. legitimate breakout ... new consolidation zone around 740
... at-max this month 20-25% growth can be their ... 1 July opening 650 --> max 780 - 812 very tough
2. cup and handle formation then after good investor build up takeoff to 740 zone
---> if prices come down ... then expecting the end of handle to be around 660-666 then shoot to 740 zone
trade strategy ...
1 safe one ---> sell 640 PE --> sell at 665 zone
2. somewhat risky --- > sell 640 PE ( at price level of 665) + sell 800 CE right now --> heart of steel require


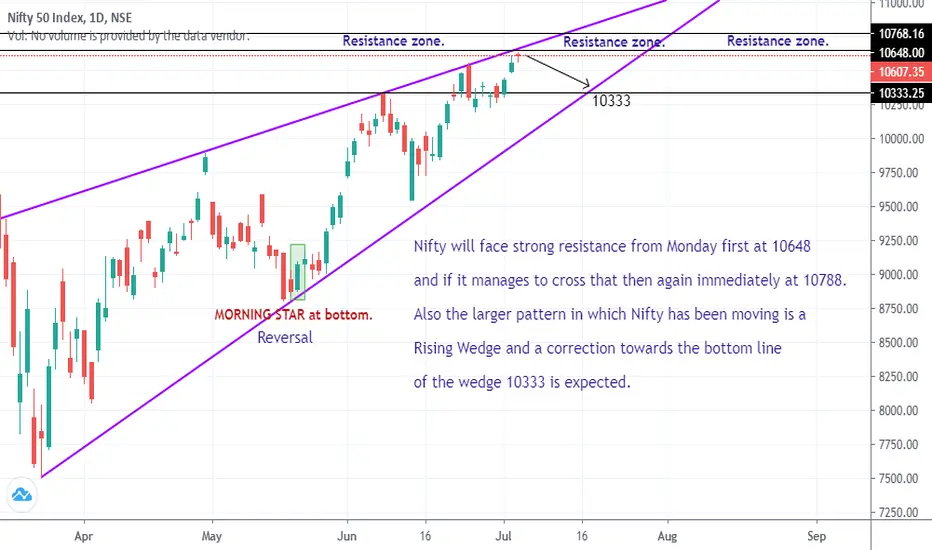
NIFTY - Correction expected from next week.Nifty will face strong resistance from Monday first at 10648 and if it manages to cross that then again immediately at 10788.
Also the larger pattern in which it has been moving is a Rising Wedge and a correction towards the bottom line of the wedge 10333 is expected.
First Sign of Exhaustion in HDFCBANK ChartsToday in a very strong market, HDFCBANK opened with GAP UP but could not show much strength as it has been showing for a few days. On Hourly charts two Doji has been formed with long up wicks that indicates exhaustion. Tomorrow if price of HDFCBANK opens with GAP DOWN, this may create an island reversal (Speculative only and it depends upon Tomorrow's opening and high).
If it opens with a gap down, then, there may be an exit or a short opportunity in HDFC Bank.
Tomorrow if market opens strong but HDFCBANK opens weak, then, its time to exit long trades but, ideally, we should wait for the market to turn weak before shorting in this stock.

Doji Kicker Signal - Price Needs To Stay Above 8EMADoji, Morning Star on the lower trendline for the trend channel, Kicker Signal - Price Needs To Stay Above 8EMA

NASDAQ NQ1! 5 day close on DragonFly Doji Nasdaq maintains support previous 5day candle body and closes with Dragonfly Doji. One would think this run is getting long in the tooth. Charts are starting to look like they say otherwise with close back above 2018 trendline. Bottom trend line in chart is best take on trend from 2008. Daily Stochastic is still showing strong cross gaining buying momentum. What is your guess on new high?

Break Out After Doji - Price is staying above 8 EMABreak Out After Doji (Morning Star) - Price is staying above 8 EMA, Clorox is working 24 hours a day to meet the supply-demand to fight coronavirus.

AUDUSD - LONGThis Spinning top doji could imply that we are going into a range market or a move back up to retest previous highs

PLAN Potential BatPLAN setting up very nicely for a bat pattern. Breaking over (B) now where I added more Nov calls from (C) entry. I entered long on the C due to a nice retrace level + a reversal pattern (doji) there on the C. Looking to take 1/2 off into (D) where I expect a possible .382 retrace to trendline, or a retrace to previous market structure at the .50 where I will add the 1/2 size back, and a trend continuation to 2.618 extension. I want to see nice reversal patterns on these levels due to having plenty of time on the calls.

EUR/GBP High Probability Short Trade with Risk and Reward 1:4.6Market Structure: Bearish (Failed to make higher high)
Momentum: Strong Bearish momentum
Chart pattern: Perfect Head and Shoulders
Candlesticks confirmations: Bearish engulfing and doji on H1 timeframe
RR: 1:4.65

EEX BULL/BEAR- FORMED DAY DOJIEEX has formed a day doji which could mean that it is confirming its continuation of upward bull trend or it could be mean its preparing for a reversal. I think it is confirm continuation. Wanted to share it because there is some risk but great reward if traded properly.

EUR/JPY POTENTIALL SMALL PULLBACKWEEKLY DESCENDING TRENDLINE BROKEN
DAILY NICE DOJI CANDLE FORMED ON THE 124 MONTHLY KEY LEVEL
4H/1H PRICE CONSOLIDATING
WAITING FOR A SHORT OPPORTUNITY ON THIS PAIR UPON BREAKOUT
TARGETIN ONCE OR TWICE THE BOX SIZE
STOP LOSS ABOVE RESISTANCE LEVEL & BOX CEILING
#tradesafe #theforexdaddy #tfd

This Dragongfly Doji may predicts the next day at least 1 % BTCUThis Dragongfly Doji may predicts the next day at least 1 % BTCUD price

AUDUSD Possible Bullish ContinuationPotential to trade the bullish AUDUSD major pair should price break the indecision doji candle positioned on the 50% Fibonacci area of value following a recent period of retracement. Possible 1:3 risk to reward ratio should price reach the 100% Fibonacci extension level.

Dabur Doji Formed In Dabur Daily Doji has been formed with more than average volume present . if tomorrow it downtrend begins than can take short position depending upon trader mindset ( risk taker or averse ) . Dabur has too many level for support and resistance get in fast and get out faster ... big target may be difficult or may test the traders patience.

XBTUSD possible shortGood morning, well I mean... Anyways, as you can see on the graph, last month we saw a doji candle ( two in fact), approving of a trend reversal which it obviosly did, causing XBTUSD to go further down. As you can see on the right-hand side of the graph, we can see that a similair looking pattern is emerging, which could just about hit the resistance line, provided it shows a doji candle, or any other trend reversal pattern, we could see another short.
Remember do not use this as final advice to invest your money, but as a guide. This is just an idea.
