USDJPY Breakout and Potential RetraceHey Traders, in today's trading session we are monitoring USDJPY for a buying opportunity around 146.300 zone, USDJPY was trading in a downtrend and successfully managed to break it out. Currently is in a correction phase in which it is approaching the retrace area at 146.300 support and resistance area.
Trade safe, Joe.
Dollar

DXY: USD Flexes Muscle - Pairs SlideFriday, July 25, 2025
The foreign exchange markets are experiencing a pronounced USD bullish session this morning, with the US Dollar Index (DXY) showing robust gains of +0.35% while simultaneously pressuring all major currency pairs into negative territory. The Japanese Yen (JPY) is bearing the brunt of this dollar strength, currently registering losses between -0.4% to -0.66% across JPY pairs. This market behavior suggests traders should pay particularly close attention to DXY dynamics, as its movements will likely dictate price action across all major currency pairs in today's session.
Technical Perspective: DXY at Critical Inflection Point
A detailed examination of the Dollar Index reveals several compelling technical factors that market participants should consider:
1. Weekly Demand Zone Reaction
- The DXY has demonstrated a strong rejection from a significant weekly demand area
- The subsequent bullish spike indicates potential continuation of upward momentum
- This price action suggests institutional buyers are defending this key level
2. Commitment of Traders (COT) Report Insights
Non-commercial traders (typically hedge funds and speculators) have increased their positions from a bottom level not seen since June 2021 meanwhile the Commercial traders (often corporations hedging FX exposure) show opposing extreme positioning. This stark divergence between trader categories often precedes significant market moves
3. Seasonal Patterns Favor USD Strength
- Historical seasonal analysis indicates the current period typically supports dollar appreciation
- The combination of technical and seasonal factors creates a potentially powerful bullish setup
✅ Please share your thoughts about DXY in the comments section below and HIT LIKE if you appreciate my analysis. Don't forget to FOLLOW ME; you will help us a lot with this small contribution.

Is the DOLLAR bullish? Look at the weekly support zone levelsI am trying to figure out what the recent bullish days mean within the overall range.
Please let me know what you think 🙏🏾

Fundamental Market Analysis for July 24, 2025 USDJPYThe Japanese yen (JPY) strengthened against its US counterpart for the fourth consecutive day and reached a nearly three-week high during Asian trading on Thursday. The recently announced trade deal between Japan and the US reduces economic uncertainty and increases the likelihood that the Bank of Japan (BoJ) will resume its tightening cycle at the end of this year, which in turn is seen as a key factor continuing to support the JPY. The US dollar (USD), on the other hand, is languishing near two-and-a-half-week lows and is putting additional pressure on the USD/JPY pair.
However, domestic political uncertainty and disappointing data on Japan's manufacturing PMI may keep yen bulls from aggressive bets. Moreover, the optimistic market sentiment should help limit the safe-haven yen's gains and further losses for the USD/JPY pair. Traders are now eagerly awaiting the release of US flash PMI indices to take advantage of short-term opportunities later in the North American session. However, the mixed fundamental backdrop calls for caution before making aggressive directional bets.
Trade recommendation: SELL 146.00, SL 147.10, TP 145.00

Altcoin Season Has Started. And A Quick Look At The Stock MarketHey Traders,
Time for me to catch you up on the latest price action in both the stock market and crypto as well as touch upon a few changes on my platform and subscription services and what I plan for the future.
Timestamps:
00:00 | Housekeeping - site changes, etc
04:35 | BTC Dominance
06:45 | DXY Dollar Chart
10:00 | SPY
14:25 | BTC Bitcoin Chart
15:45 | Bitcoin Liquidity Heatmap
17:30 | Solana
19:05 | Ethereum
20:20 | Crypto & Stock Trackers
24:25 | My Indicator
26:10 | Where I Went Wrong & How I Plan To Course Correct
✌️ Stew

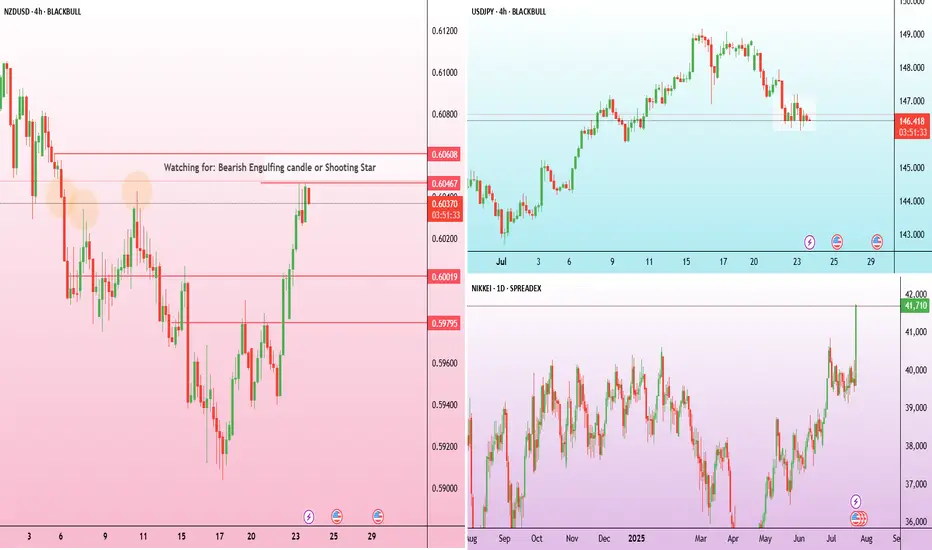
Kiwi climbs on risk-on flow – chart says more to come? The New Zealand dollar strengthened to around 0.6045, its highest level in over a week, supported by improved global risk sentiment following a breakthrough U.S.–Japan trade agreement.
The agreement, which lowers tariffs and boosts bilateral investment, triggered a surge in Japanese markets. Japan’s Nikkei 225 index jumped more than 3%, hitting a one-year high.
The breakout in NZDUSD was accompanied by a series of bullish candles with little to no upper wicks, evidence of minimal rejection from sellers. The most recent candles are consolidating just below the 0.6055 zone, which aligns with minor resistance from July 4.
Rejection from this area—especially if it prints a bearish engulfing or shooting star pattern—could signal a short-term pullback. On the downside, immediate support is now at 0.6000. If broken, the next support potentially lies around 0.5980, which was the last major swing low before the breakout.
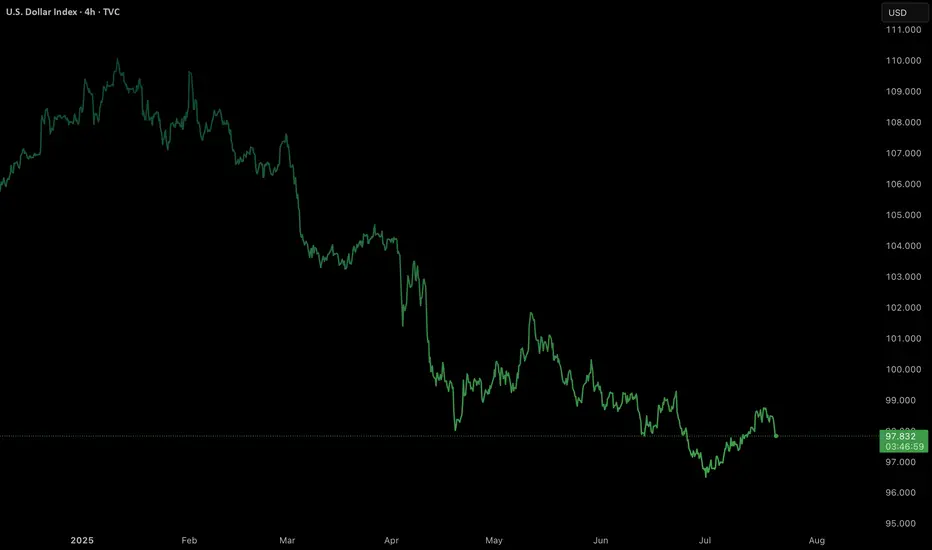
Trump did it again!Donald Trump did exactly what he did in his previous term: Dollar Devaluation .
Reason? Strengthening the US exports.
Will it work? We'll see.
What's your thoughts?
#dollar #forex #euro #devaluation #trump #exports #trading #algo

Dollar Index (DXY): Time to Recover
It looks like Dollar Index is going to recover after a yesterday's
rapid fall.
The market reached a key support and formed a cup & handle pattern on that.
We can expect a pullback at least to 98.09 level.
❤️Please, support my work with like, thank you!❤️

USD/JPY Possible Bear Scenario🔍 Analysis Summary:
USDJPY has failed to close above 146.1 on the weekly for the past 13 candles, showing clear signs of price exhaustion at this level. Price has also tapped into a marked 8HR bearish order block and printed a Daily Pin Bar — a strong reversal signal indicating potential downside.
📍Key Technicals:
• Resistance Holding: 146.1–146.6 zone
• Bearish Rejection: Pin Bar off resistance + order block
• Risk Area (Stop Zone): Above 147.16
• Target Zones: 144.2 (interim) → 142.4 (swing level)
🛠 Confluence:
• Order block rejection
• Multi-week resistance
• Clean structure with defined R:R
• Bearish candlestick confirmation
📊 Timeframe: 8HR
📉 Bias: Short
🔐 Risk Management: Proper stop loss in place above structure. Use personal risk limits.
⸻
⚠️ Disclaimer:
This setup is for educational and informational purposes only. It is not financial advice or a recommendation to trade. Always conduct your own analysis and use risk management based on your personal trading plan.

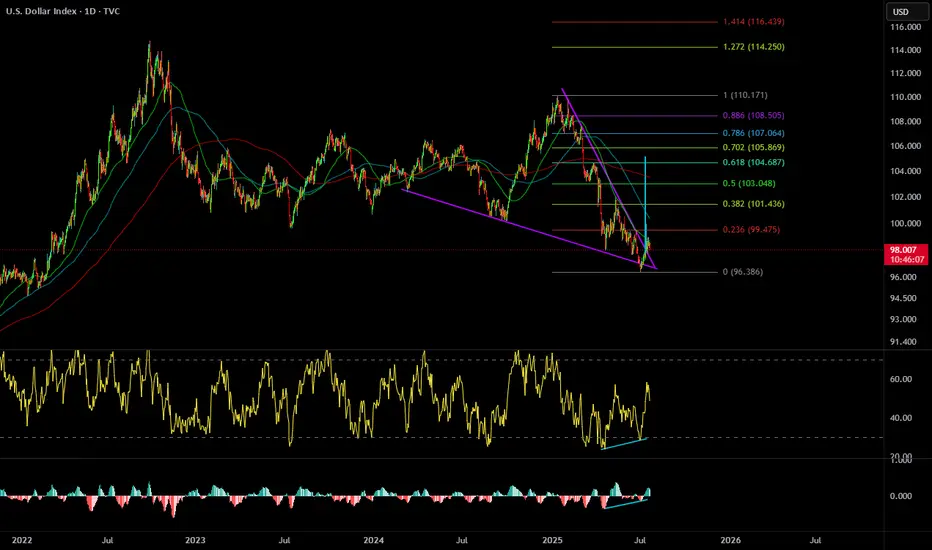
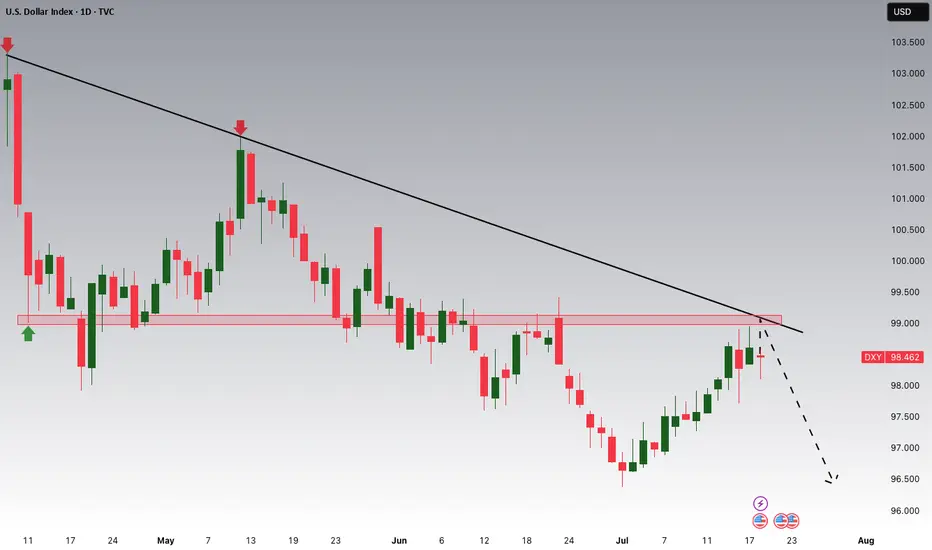
U.S. Dollar (DXY) bearish?Will dollar continue its bearish momentum or will it reverse?
Technical Summary
DXY remains in a firm bearish trend, having dropped around 11% this year. The setup is formed by a chain of lower highs and lower lows, confirming an unrelenting downtrend.
Support Level: ~97.70
Resistance Zone: 98.55–98.80
Long-Term Outlook: Bearish, unless a clear break and close over the resistance zone on the daily or weekly timeframe.
Technically, the momentum indicators remain weak, and the failure to sustain rallies above the 99.00 level also contributes to downward pressure further. The market is now consolidating within a narrow range after steep selling, which suggests probable continuation if macro catalysts are favourable.
Fundamental and Sentiment Drivers
Several macroeconomic and geopolitical drivers are underpinning the weakening of the U.S. dollar:
Federal Reserve Uncertainty:
Speculation over the ultimate fate of Federal Reserve Chairman Jerome Powell under political pressure from the executive branch has severely undermined investor confidence in the central bank’s independence. This has been manifested in increased volatility and bearish pressure on the dollar.
Trade Policy and Tariff Risks:
Ongoing trade tensions, including the possibility of sweeping tariffs (15–20%) on Chinese and European Union goods, have created a risk premium on valuations of the U.S. dollar. Market players still fear retaliation and its effects on trade stability in the world.
Fiscal Position and Credit Ratings:
The US fiscal deficit, which is approaching 7% of GDP, and recent credit rating downgrades to its outlook, have set alarms ringing regarding the structure. These fiscal developments have eroded the popularity of the US dollar as a safe-haven asset, particularly with foreign investors.
Global Monetary Landscape:
With European Central Bank and Bank of Japan maintaining policy guidance tight, and Federal Reserve already indicating that direction for a rate cut in Q4 2025 is being eyed, the falling rate differentials still maintain pressure on the dollar.
Market Outlook: Week of July 21–25, 2025
Major Geopolitical and Economic Events:
DATE : Ongoing
EVENT : U.S.- EU & U.S. — China Trade Negotiations.
MARKET RELEVANCE : High
Resolution or escalation will directly impact USD demand.
DATE : Mid-week
EVENT : Federal Reserve Speeches (including Powell)
MARKET RELEVANCE : High
Monetary policy guidance and institutional stability.
DATE : July 24–25
EVENT : Jobless Claims, Flash PMIs, New Home Sales, Durable Goods Orders
MARKET RELEVANCE : Medium–High
Labour market data, housing data, and production activity have the potential to shift rate expectations and dollar sentiment ahead of the FOMC and PCE releases.
Strategic Implications
Outlook: DXY remains structurally bearish in the short to medium term. Additional weakness below 98.80 and sustained closes below 97.70 would reassert downward momentum, risking a further retracement to the 96.00-95.50 region.
Possible Bullish Reversal Triggers:
A conclusive resolution to U.S. trade negotiations.
Unexpectedly solid economic data (particularly core inflation or employment).
Hawkish Fed commentary supporting policy tightening expectations.
Last thoughts
The U.S. Dollar Index is currently at structurally weak technical and fundamental foundations. Absent a sudden reversal of the monetary policy message or geopolitical resolution, the path of least resistance appears to remain to the lower side. Market participants need to pay special attention to upcoming economic data releases, central bank rhetoric, and trading news because any one of them could be a pivotal driver of near-term dollar behavior.
Dollar $DXY Bullish WedgePretty clean falling wedge with divergence. Aligns with a pullback to come on BTC and Stocks.
A move back to 104 area would do some damage to risk on assets.
Follow for updates.
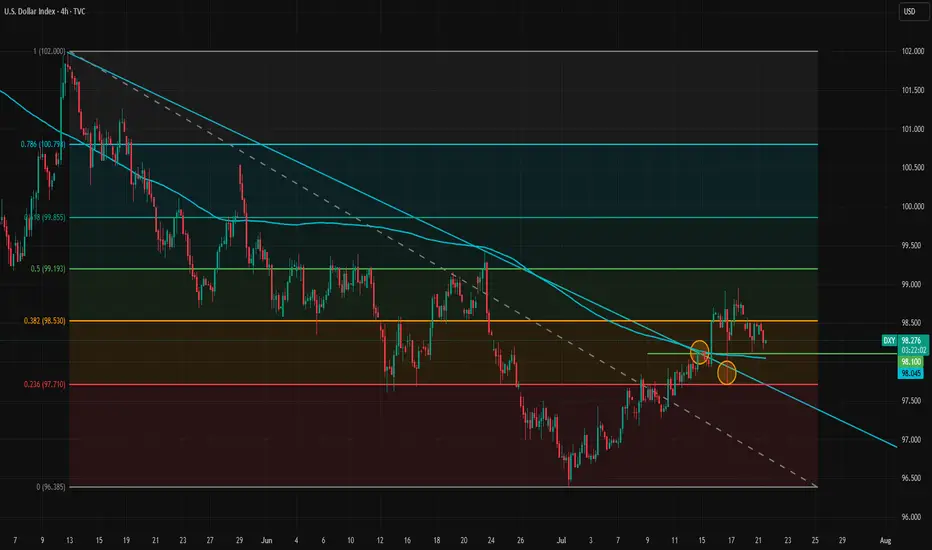
Fundamentals Support Dollar’s Potential Trend ReversalThe dollar appears to be reversing its direction on the 4-hour timeframe. The trendline has been broken and retested twice, but the dollar has held above it, signaling a potential shift in momentum.
Despite intense pressure from the White House on the Federal Reserve, the data is likely to prevent the Fed from cutting rates at the upcoming meeting and possibly at the one after that. A potential rate cut in September will largely depend on incoming inflation and labor market data.
The inflation impact of tariffs became more visible in the latest CPI report, but the effect is still relatively modest. This aligns with our theory that tariff-driven inflation will build gradually and persist over a longer period, rather than cause an immediate spike.
Meanwhile, the labor market has not shown clear signs of rapid weakening, so there is no strong case for a rate cut from that side either. The Financial Conditions Index also indicates that monetary policy remains on the accommodative side. Bloomberg financial conditions index is at highest level since March.
As markets increasingly recognize that no rate cuts are likely in the near term, and with the August 1 tariff deadline approaching amid potential rising risks of trade tensions between the U.S. and the EU, the dollar may gain further support. The U.S.–EU bond market spread also does not favor a stronger euro at the moment, adding to the dollar's upside potential.
In the short term, 98.10 and 98.53 are immediate support and resistance levels. If the dollar breaks above 98.53 again, upward momentum may strengthen and open the path toward the 100 level.
GBPUSD: Bearish > Bullish Order FlowAlright, we are approaching some Higher Timeframe Points of Interests. We got a Potential Bullish Bat Pattern Pattern this align with this Bullish H4 Order Block, that's right in the middle of an whole number 1.34. We could expect some spikes around the area, some complex pullbacks, but we must remain steady.

Gold will make a Low for the Week before Pushing BullishOn my previous Update I mention that we should have support off this H4 Gap. My problem with it s it immediately reacted to it when the market opened back up. well before the killzone. So I feel like this is a fake out to go short for now. they will make a low for the week then we will see it set up for the bullish move.

Looking Over Gold Expectations for the coming Week!Last week had a solid play of moves. Ultimately closing out around 50% of its overall movement. Looking for price to continue with more bullish activity as we come into a new week. Keeping in tune to find areas I can take advantage and get active.

DXY Potential DownsidesHey Traders, in the coming week we are monitoring DXY for a selling opportunity around 99.000 zone, DXY is trading in a downtrend and currently is in a correction phase in which it is approaching the trend at 99.000 support and resistance area.
Trade safe, Joe.
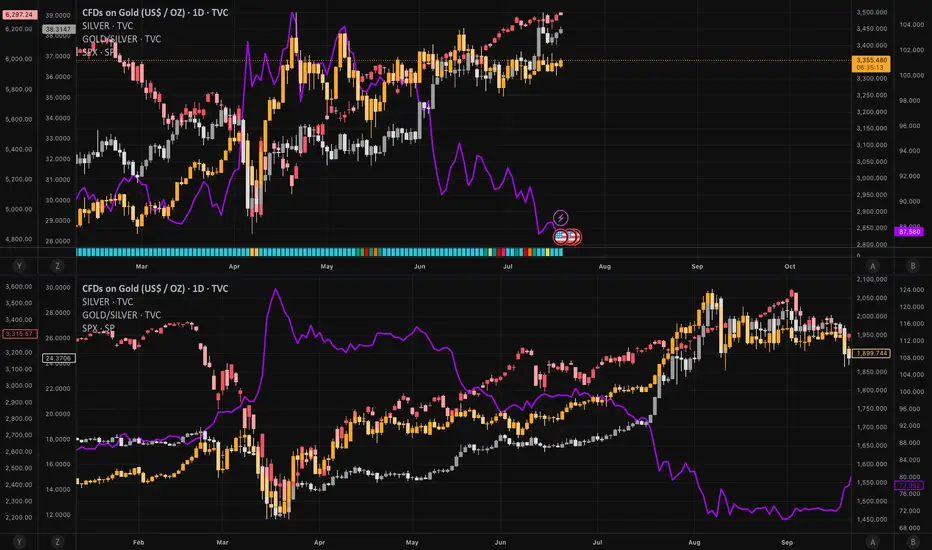
Bear-Trap armed: Gold ticks 4 / 5 boxes - waiting for the spark1️⃣ Why the 2020 déjà-vu is EVEN louder
2025 (now) 2020 (pre-rally)
TradingView ideas still bearish 💬
> 70 % 60 % bearish
Managed-money net-longs ≈ 115 k
-35 % from Apr. –25 % from peak
+ $741 m PM-ETF inflow Record IN-flows
G/S ratio 87 (< 90) Fell to 95
S&P keeps making highs Ditto
2️⃣ What’s still different
Real 10-y TIPS yield +0.7 % vs -1 % in 2020 → smaller monetary tail-wind.
Gold is already at an infl-adj. record – expect a short & sharp squeeze, not a fresh multi-year super-cycle (yet).
3️⃣ Checklist – updated
Signal Status 18 Jul Comment
———————————————————
Gold DAILY close ≥ $3 200–3 250 YES – $3 354 ✔
G/S ratio < 90 YES – 87 ✔
CFTC net-longs < 150 k YES – ~115 k ✔
ETF flows turn positive. YES – $741 m ✔
Equity stress (VIX > 25 or SPX −5 %) NOT YET – VIX 16.5 ✖
4 / 5 boxes = 99 % primed. One spark missing.
4️⃣ What could light the fuse
Date Potential trigger Why it matters
22 Jul Mega-tech Q2 earnings (NVDA/AMD) Any guidance miss → SPX wobble
30 Jul FOMC Fed holds but sounds dovish USD dump + yield spike risk
1 Aug Trump s “reciprocal” duties Imported-inflation scare → VIX pop
Early Aug. DXY crashes < 96 in < 5 days. Disorderly USD slide = funding stress
Hit ≥ 2 of: DXY < 96, VIX > 25, SPX -5 % or HY-spread +75 bp → final ✔.
Bottom line
The bear-trap thesis aged well: sentiment, positioning, ETFs, and G/S ratio have already clicked bullish.
Only equity-market stress is missing. A fast USD slide or a tariff shock right after a neutral Fed is the most likely detonator.
Stay nimble: Collect premium inside $3 250-3 400 while volatility sleeps – but keep alarms on VIX 25 and DXY 96. One red headline could still launch the squeeze.
Disclaimer: Educational opinion, not investment advice. Futures & CFD trading is risky – do your own research and consult a professional.
1 minute ago
EURUSD Buy Trade Idea: Reversal Rocket Ready to Launch!Hey Fellow Traders! 👋
The EURUSD (EU) is setting up for a massive reversal that’s got me hyped! 🚀 After nailing the lows of that descending channel like a pro, price has retraced to our expected zone and is now bouncing hard. It’s time to gear up for a potential buy trade targeting the Buyside Liquidity! Let’s break down this fire setup and get ready to ride the wave! 🌊
📈 The Setup: Reversal in the Making!
EU hit the descending channel lows as predicted, and now it’s showing some serious bullish vibes with a strong bounce off a key weekly trendline support. This isn’t just a random move—price is reacting to a weekly demand zone and a trendline that’s holding like a fortress. 🏰 I’m expecting a reversal to kick in, aiming for that juicy Buyside Liquidity up top. But hold up—don’t just dive in blindly! Let’s talk strategy. 😎
🎯 Trade Details: How to Play It Smart
Entry Zone: Look for a calculated entry in this bounce area. Key setups to watch for:
FVG (Fair Value Gap) or IFVG (Imbalance Fair Value Gap) for precision entries.
Order Blocks (OB) for high-probability setups.
Trendlines/Support Zones: Use these for confluence, as EU is respecting that weekly trendline support.
Target: We’re gunning for the Buyside Liquidity—a high-probability target where price loves to gravitate.
Stop Loss: Place your stops below the recent lows or your chosen setup (FVG/OB) to keep risk tight.
👀 Keep an Eye on DXY for Confluence
The Dollar Index (DXY) is a key player here. A weakening DXY could supercharge this EU reversal, so monitor it closely for extra confirmation. If DXY starts to roll over, it’s like pouring rocket fuel on this trade! 🚀
🧠 Why This Reversal Makes Sense
Weekly Trendline Support: Price kissed this level and is bouncing like it means business.
Weekly Demand Zone: This area has historical strength, making it a prime reversal spot.
Channel Lows Conquered: EU smashed through the descending channel lows and is now retracing for the next leg up.
⚠️ Risk Management Reminder
Don’t YOLO this one! Use proper risk management—calculate your position size, set tight stops, and only enter when your setup aligns. Whether you’re using FVGs, OBs, trendlines, or classic support/resistance, make sure your entry is calculated to avoid getting caught in a fakeout. 💪
💬 Let’s Talk Trades!
What’s your take on this EU reversal? Are you jumping in with an FVG, OB, or something else? Drop your thoughts, setups, or questions in the comments below! 👇 If this idea gets you pumped, smash that LIKE button ❤️, follow for more banger trade ideas, and share your charts with the community! Let’s keep the vibes high and the profits higher! 💰
#EURUSD #ForexTrading #BuyTrade #Reversal #TradingView

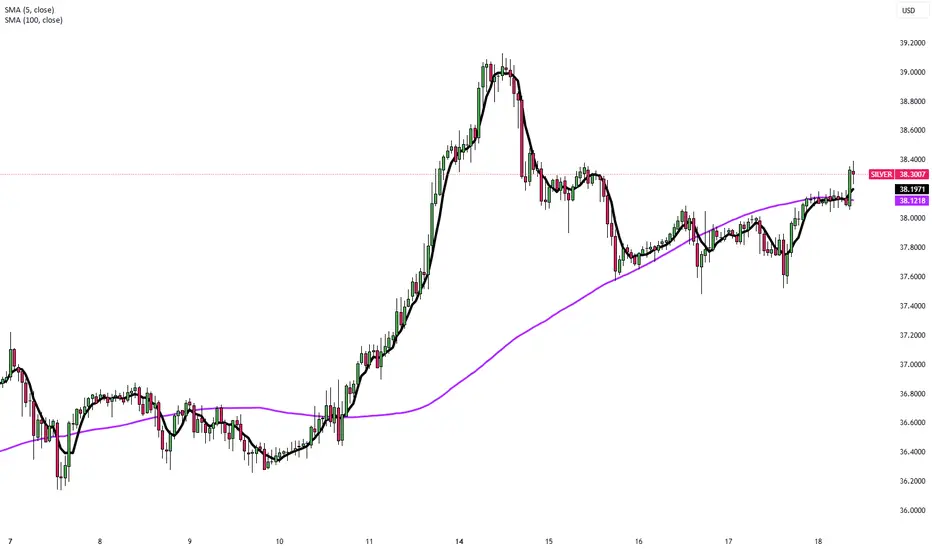
Silver Rebounds Toward $38 as Dollar EasesSilver rebounded toward $38 per ounce on Friday, recovering from a two-day decline as the U.S. dollar and Treasury yields eased. The move reflected shifting sentiment on Fed policy and trade conditions after earlier losses sparked by inflation data that reduced hopes for near-term rate cuts.
U.S. stock futures edged higher following record closes for the S&P 500 and Nasdaq, driven by strong retail sales, lower jobless claims, and optimism in AI-related tech stocks after Taiwan Semiconductor’s positive forecast. On monetary policy, Fed officials remain divided: Mary Daly expects two rate cuts this year, while Adriana Kugler urges caution due to tariff-driven inflation. President Trump reinforced trade tensions by sending letters to over 20 partners setting new tariffs between 20% and 40%.
In corporate updates, United Airlines expects stronger earnings in the second half of 2025, and Chevron signaled higher future cash flow as production in its top U.S. oil field nears a plateau.
Resistance is at 38.50, while support holds at 37.20.
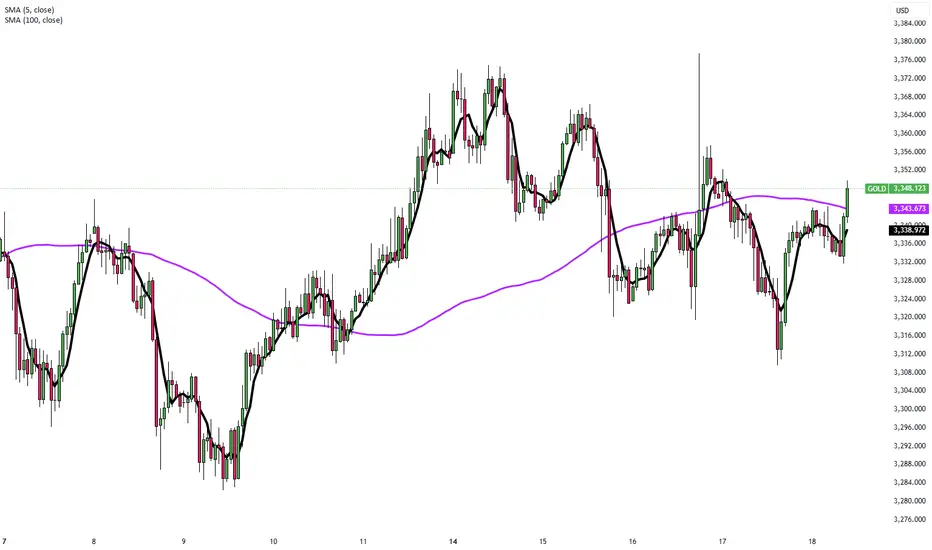
Stronger U.S. Data Pressures Gold PricesGold remained below $3,340 per ounce on Friday and was on track for its first weekly decline in three weeks. The metal faced pressure after stronger U.S. data, including a rebound in retail sales and a sharp drop in jobless claims, reduced the immediate need for Federal Reserve rate cuts. Fed Governor Adriana Kugler backed keeping rates steady for now, pointing to economic resilience, while San Francisco Fed President Mary Daly maintained her outlook for two cuts in 2025.
Resistance is at $3,370, while support holds at $3,320.
Pound Pressured by Firm Dollar and UK Data ReviewThe British pound held near $1.339 on Friday, its lowest level in eight weeks, as the U.S. dollar strengthened. The dollar reached a three-week high after President Trump confirmed he would not remove Fed Chair Jerome Powell, despite continued criticism of the Fed’s careful stance on rate cuts. In the UK, markets are closely reviewing recent employment and inflation data. While the labor market shows signs of weakness, updated tax records suggest the slowdown may not be as severe as previously thought.
Resistance is at 1.3535, while support holds at 1.3380.

Sweep On levels and Confirmation of Bullish pressure! Now that we have a sweep on levels we are looking for bullish pressure to continue. They have closed the 4Hr bullish. Being that it is Friday keeping expectation low cause price can break out and push hard or it can end up being Rotational. I feel there is a move here. We just have to wait for it to line up inside of the killzone. NOFOMO Mayn!

SHORT ON USD/JPYNice CHOC (Change of Character) on USD/JPY
Followed by a retest to the supply area/zone with massive wick rejection.
I will be selling USD/JPY looking to catch over 200 pips to the next level of support/demand.
