Twitter Speculation sent Gold FLIP Floppin!So yesterday there was a few Tweets that caused chaos in the market. Fed Rumors about Powell getting fired. Im still looking for my long. Waiting for a sweep on levels before getting active.
Dollar

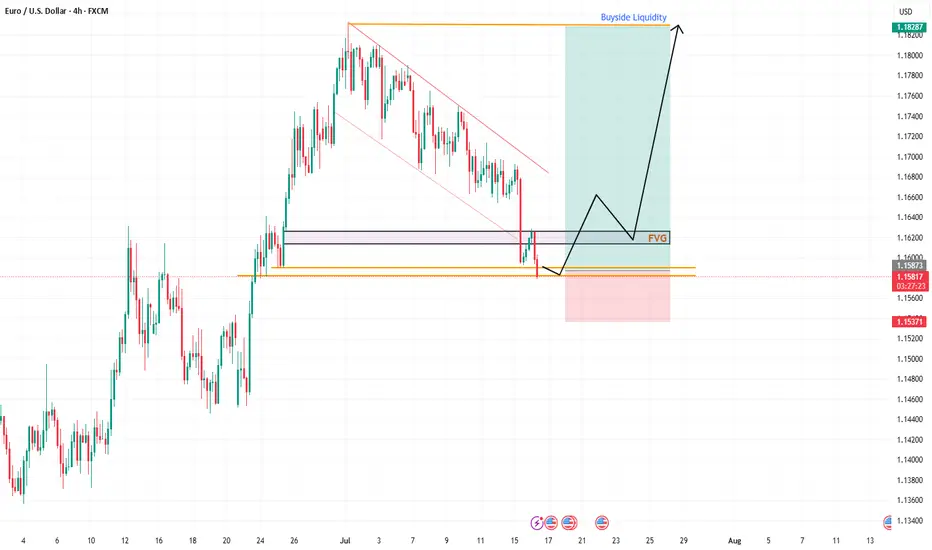
EU's Wild Drop: A Sneaky Trap or Reversal Time?Hey Fellow Traders! 😎
What a ride yesterday, right? The EUR/USD took a massive plunge, smashing through the descending channel like a wrecking ball and sweeping up all that liquidity. 💥 But hold up—was that just a clever market manipulation to shake out the bulls? I think so! 🧠
Right now, the price is chilling in a Daily Fair Value Gap (FVG), and I’m expecting some serious action here. This could be the perfect setup for a reversal! The market makers pulled a fast one—tricking bullish traders into flipping bearish after that dramatic drop. But guess what? That’s the trap! 🕸️ Don’t fall for it.
I’m eyeing a long entry right at this level. Here’s the plan:
Entry: Right now—let’s catch this wave! 🌊
Stop Loss: Set it tight around 1.15360 to keep risk in check.
Take Profit: Aiming for those juicy highs (check the chart I shared in my last post for the exact levels). 📈
This setup is screaming opportunity, so let’s talk about it! 💬 What’s your take—are we reversing or is the market still playing games? Drop your thoughts below, smash that Like button if you’re with me, and Follow for more trade ideas! 🚀 Let’s keep the community buzzing. 🐝
#Trading #EURUSD #MarketAnalysis #ReversalSetup
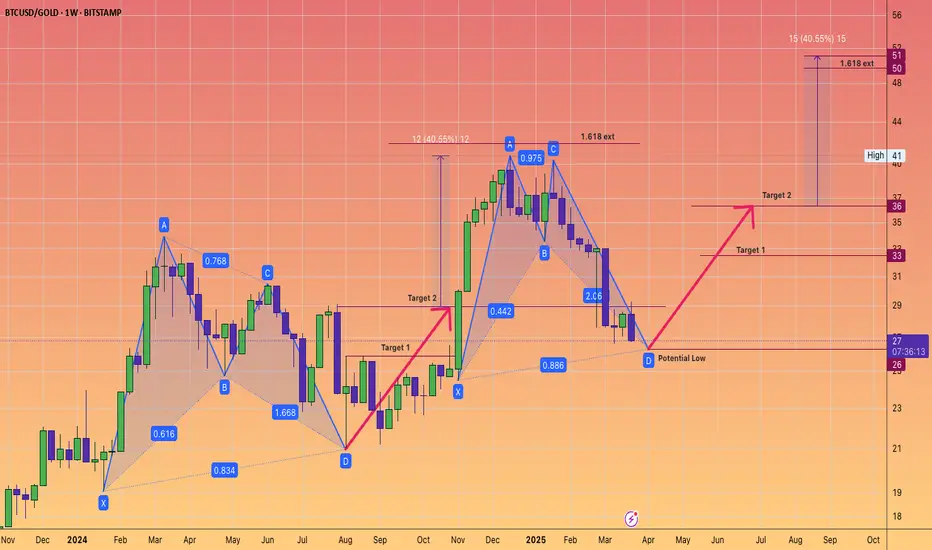
Bitcoin harmonic pattern. Back to back Gartley. BTCGOLD ratio.The BTC/GOLD ratio has experienced a significant correction, currently standing at 27 gold ounces per 1 Bitcoin, down from a peak of 41, representing a decline of 34%.
Gold, priced at $3,114 in US Federal Reserve notes, is in a sustained bull market.
It is reasonable to anticipate that the digital equivalent of gold will gain traction once gold stabilizes at a higher price point.
The Gartley pattern is recognized as the most prevalent harmonic chart pattern.
Harmonic patterns are based on the idea that Fibonacci sequences can be utilized to create geometric formations, which include price breakouts and retracements.
The Gartley pattern illustrated indicates an upward movement from point X to point A, followed by a price reversal at point A. According to Fibonacci ratios, the retracement from point X to point B is expected to be 61.8%.
At point B, the price reverses again towards point C, which should reflect a retracement of either 38.2% or 88.6% from point A.
From point C, the price then reverses to point D. At point D, the pattern is considered complete, generating buy signals with an upside target that aligns with points C and A, as well as a final price target of a 161.8% increase from point A.
Often, point 0 serves as a stop-loss level for the entire trade. While these Fibonacci levels do not have to be precise, greater proximity enhances the reliability of the pattern.
Will these consecutive Gartley patterns succeed in bolstering Bitcoin's strength? We will soon discover the answer.
USDZAR Bullish ideaAs we can see this is our USDZAR quarterly shift idea were we are anticipating price to rally to the upside toward our draw on liquidity objectives. We had a weekly volume imbalance and monthly mean threshold order block show us support after we took out major liquidity points. We also showed more support on our daily FVG and a market shift taking place after a displacement. We are anticipating a rally for USDZAR and will be looking to see how price plays out.
USDZAR is an exotic pair that is part of the emerging markets and emerging markets/exotic pairs can usually lead ahead of major forex pair or lag between major forex pairs so this can also help us with our intermarket analysis of forex pairs when determining our dollar strength against other basket currencies.

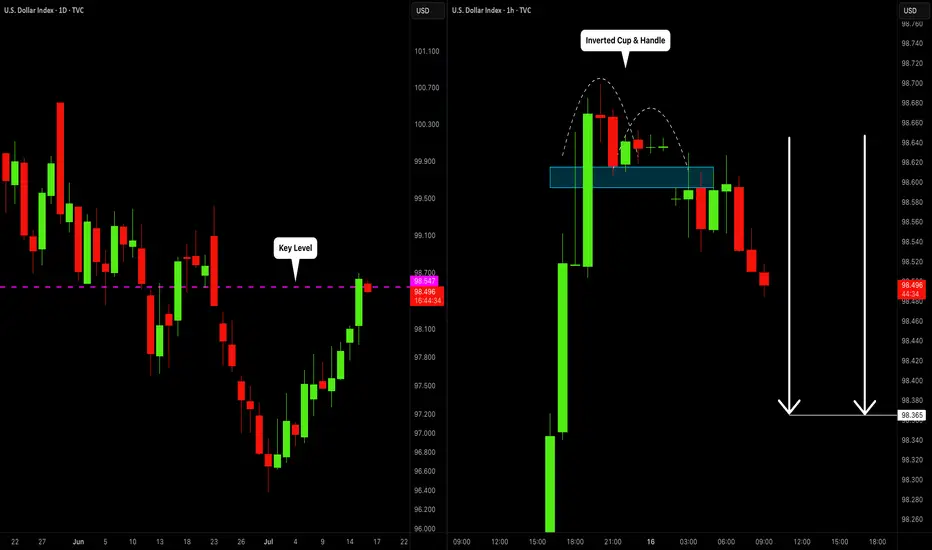
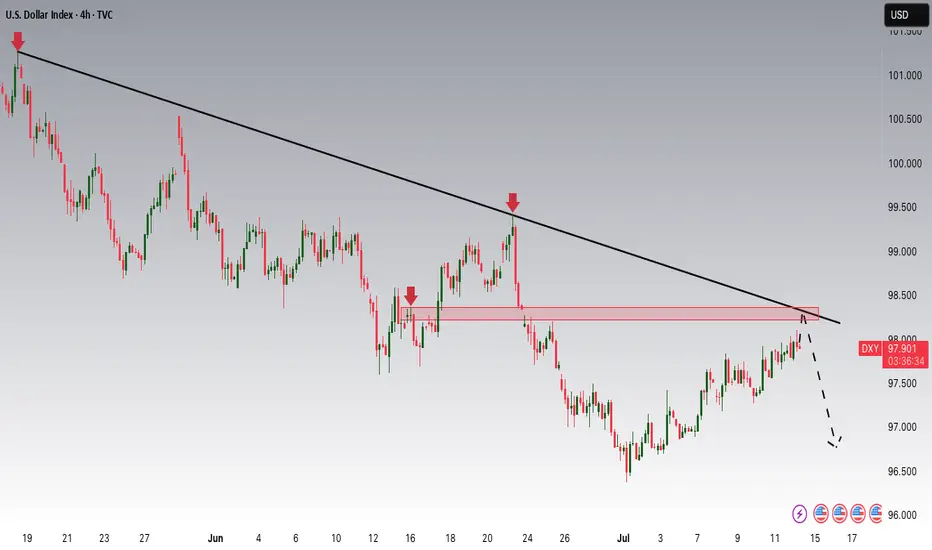
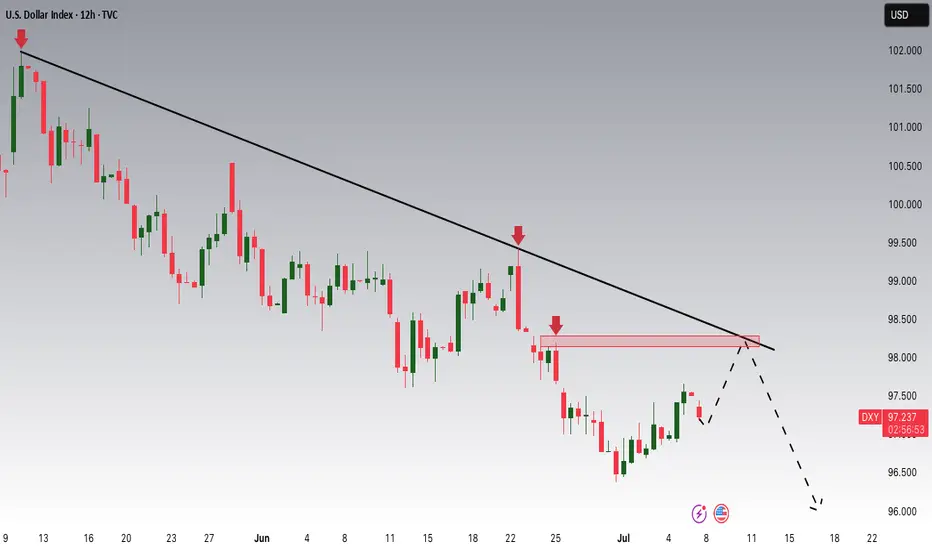
DOLLAR INDEX (DXY): Bearish Move From Key Level
I think that Dollar Index may drop from a key daily horizontal resistance level.
As a confirmation, I spotted an inverted cup & handle pattern on an hourly time frame
and a bearish violation of its neckline.
The market will most likely continue falling at least to 98.36
❤️Please, support my work with like, thank you!❤️
Dollar MoonHey,
Been a while that I shared a chart here, sorry for that.
I love the place where the dollar is at the moment.
The easiest plays are from these long-term value areas, and this one is also stacked with a trendline making it a bit more obvious for everyone.
The daily trend is broken since yesterday, shifting bullish long-term. I think a daily pullback is likely, perhaps even back to daily lows to fill up demand.
But long-term, I am super bullish for the dollar.
The $ has been bullish since 2008, we all see it.
Time for the next leg up.
Let's go!
Kind regards,
@ mnieveld

Gold is Setting up for another moveLooking for price to make some impulsive moves before we get active. Looking like they are trying to establish a low for the week before they go full on bullish. waiting for them to find that bottom.

DXY: potentially aiming for January 2025 highsAlthough we do not Trade the dollar specifically, it is a good barometer the feel out other assets.
It seems like DXY reached a MONTHLY LEVEL. I expect price to form a FVG within this rectangle on the daily level. Which will eventually create a GAP on one of the currencies. Will follow up when this happens.
IMO reversed and is going to reach the daily level quick. This will mean, POUND, EURO DOWN.

Dollar Index Bullish OverviewThe Dollar moving Bullish as we expect it to within the Gold Fund! As soon as we saw a '5 Bearish Wave Completion' on the DXY, straight away buyers entered the market & start pushing price back up.
My Gold Fund investors & Gold Vault Academy students know from our 'Q3 Market Breakdown Report' what we're expecting for the Dollar in the next 3 months.

Triangle Formation (Rising wedge STF) I believe we can see some downside here. Price has bounced of the 61.8 fib level and looks to have created a triangle pattern. I’m not currently in any positions, I will wait for a breakout of the rising wedge for a short position.

Dollar holds steady uptrend despite Trump’s tariff threats.
President Trump announced a 30% tariff on imports from both the EU and Mexico, a hike from the 20% previously imposed on the EU in April. He also warned that if no agreement is reached on the Ukraine war within 50 days, countries trading with Russia could face a 100% tariff.
Meanwhile, market volatility is being amplified by speculation over Fed Chair Powell’s potential dismissal, as attacks against him intensify from Trump and his allies. Deutsche Bank warned that Powell’s removal could trigger sharp swings in both the dollar and bond markets.
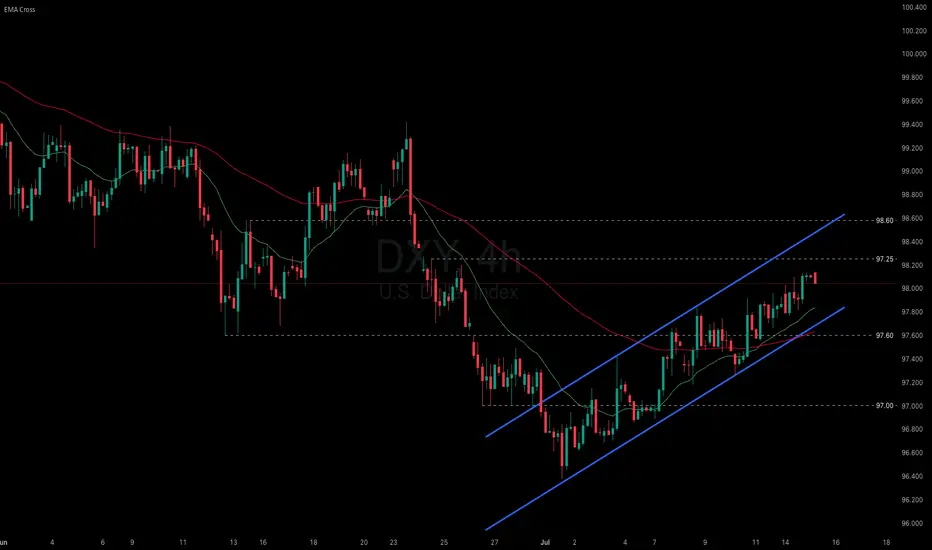
DXY has extended its two-week rally after testing the recent low, approaching the 98.00 threshold. The index remains within the ascending channel, indicating the potential continuation of bullish momentum. If DXY breaches above the resistance at 98.25, the index could gain upward momentum toward 98.60. Conversely, if DXY breaks below the support at 97.60, the index may retreat to 97.00.
DOLLAR PUSHING HIGHERPrevious week high has taken by a bullish move. Market printed a nice 4H imbalance which shows the potential of the market to go further higher.

The Gold Retrace for Ultimate Entry!looking for price to continue with its pullback to find where exactly support is. Once we see price establish support we should get some type of signal for entry and price can continue with this bullish price action to make new highs. If we get a full 71.8% pullback that should make for a nice bull run. Just need to wait for the confirmations first before reacting cause we might get a lot of chop until then.

DXY Potential DownsidesHey Traders, in today's trading session we are monitoring DXY for a selling opportunity around 98.300 zone, DXY is trading in a downtrend and currently is in a correction phase in which it is approaching the trend at 98.300 support and resistance area.
Trade safe, Joe.
New Week on Gold! Will the Bullishness continue?I was bullish on gold and price ended up doing as expected last week and looking for it to continue this week. But i have to sit on hands for now to see how they want to play Monday. Will they move to create a Low for the week first? or will they break out to start early on new highs? I have to see some type of confirmation first. Then we can get active.

Dollar Index Seems BullishFrom the previous week candle we see that Dollar Index has closed bullish. And in this scenario we can expect Dxy to go further higher. It has hit the previous week high and touched supply zone residing above. The two possibilities have shown in the chart are
1: After touching supply zone we expect to have deeper pullback.
2: It will have short retracement and then continues hgiher.

DXY strengthens but can it break THIS key level?The US dollar has gained ground this week, with the Dollar Index rising to retest the previously broken April low near the 97.92 level—an important technical zone. The short-term bias would flip to being bullish if this area breaks.
The greenback’s strength has been underpinned in part by unexpectedly strong economic data. For instance, Thursday’s weekly jobless claims came in at 227,000, below the forecast of 235,000. This marks the fourth consecutive weekly decline and the lowest reading in seven weeks, reinforcing the view that the US labour market remains tighter than anticipated.
Adding to this backdrop are President Trump’s threats of higher tariffs and expansive fiscal plans—described as “big, beautiful” spending and tax initiatives. These factors increase the risk of more persistent inflation.
While the Federal Reserve is still widely expected to initiate rate cuts in September, the rising inflationary pressures could slow the pace of easing thereafter. This shift would likely provide support for the dollar so long as investors don't lose trust in US monetary policy.
By Fawad Razaqzada, market analyst with FOREX.com

Opportunities Arise from Dollar WeaknessSince the dollar peaked in 2022, it has declined by 24%.
Such a decline may not seem significant for a stock, it’s a different story when it comes to currencies, especially a reserve currency for USD. US purchasing power has dropped by a quarter, meaning they will now have to pay 24% more for imports from EU.
However, the decline in the USD also presents opportunities in other markets.
Mirco EUR/USD Futures
Ticker: M6E
Minimum fluctuation:
0.0001 per euro = $1.25
Disclaimer:
• What presented here is not a recommendation, please consult your licensed broker.
• Our mission is to create lateral thinking skills for every investor and trader, knowing when to take a calculated risk with market uncertainty and a bolder risk when opportunity arises.
CME Real-time Market Data help identify trading set-ups in real-time and express my market views. If you have futures in your trading portfolio, you can check out on CME Group data plans available that suit your trading needs www.tradingview.com

"DXY Bullish Setup – High Probability Trade!"🚨 "DXY DOLLAR BANK HEIST" – THIEF TRADING STYLE MASTER PLAN (HIGH-IMPACT TRADE ALERT!)
🔥 "Steal the Market Like a Pro – This DXY Heist Could Print Serious Cash!" 🔥
🌍 Greetings, Market Pirates & Profit Raiders! 🌍
🤑 "Money isn’t made… it’s TAKEN!" 💰💸
Based on the 🔥 Thief Trading Style 🔥 (a lethal mix of technical + fundamental + psychological warfare), we're executing a DXY Dollar Index Bank Heist—a high-stakes robbery where YOU get to keep the loot!
📜 THE HEIST BLUEPRINT (TRADE PLAN)
🎯 ENTRY ZONE – "BREAK THE VAULT DOOR!"
📍Key Trigger: Wait for price to SMASH through the Moving Average Wall (97.700) – then STRIKE!
🔪 Thief’s Entry Trick:
Buy Stop Orders above MA (aggressive)
Buy Limit Orders near recent swing low (smart pullback play)
DCA/Layering Strategy for max profit extraction (real robbers scale in!)
🚨 ALERT SETUP: "Don’t miss the breakout – set an ALARM!" ⏰
🛑 STOP LOSS – "DON’T GET CAUGHT!"
"Yo, rookie! If you’re entering on a breakout, WAIT for confirmation before placing SL!"
📍Thief’s SL Zone: 97.400 (30min swing low – adjust based on your risk appetite!)
⚠️ WARNING: "Place it wrong, and the cops (market) will lock YOU up!" 🚔
🎯 TARGET – "ESCAPE WITH THE LOOT!"
🏆 Primary Target: 98.350 (Take profits before the resistance police show up!)
🔄 Scalper’s Bonus: "Trail your SL, squeeze every pip!"
💡 Pro Tip: "If you’re underfunded, ride with the swing traders – teamwork makes the dream work!"
💣 WHY THIS HEIST WILL WORK (MARKET DYNAMICS)
✅ Bullish Momentum Building (DXY showing strength!)
✅ Overbought? Maybe… but thieves don’t wait for permission!
✅ Trend Reversal Potential (Big money shifting!)
✅ Police (Resistance) Trap Ahead (Escape before they catch you!)
📡 NEWS & RISK MANAGEMENT (DON’T GET BUSTED!)
🚨 High-Impact News? AVOID new trades! (Use trailing stops to lock profits!)
📊 Check COT Reports, Macro Data, Geopolitics (Smart thieves do their homework!)
💥 BOOST THIS HEIST – LET’S GET RICH TOGETHER!
👊 "Hit the LIKE & BOOST button to fuel our next heist!"
💖 "More boosts = More robberies = More FREE money for YOU!" 🚀
⚠️ DISCLAIMER (LEGAL SPEAK)
"This ain’t financial advice – just a damn good robbery plan. Trade at your own risk, and don’t cry if you ignore the SL!" 😎
🔔 Stay tuned for the next heist… The market’s our playground! 🏴☠️💰
🚀 "See you at the next breakout, thief!" 🚀
🔥 #DXY #Forex #Trading #BankHeist #ThiefTrading #ProfitPirates #MakeMoney #TradingView #SmartMoney 🔥

Early impulsive action got me active! This was a move I was looking to happen yesterday but got slapped trying. It just rocks out like that some time and you have to wait for the next opportunity. In this move early and looking for it to continue if it can hold well above yesterdays high. Trailing stop with every 50 ticks cause anything can happen turning price around and I dont want to give to much back.

DXY Potential DownsidesHey Traders, in today's trading session we are monitoring DXY for a selling opportunity around 98 zone, DXY is trading in a downtrend and currently is in a correction phase in which it is approaching the trend at 98 support and resistance area.
Trade safe, Joe.
AUDUSD 4H: Sell Zone Confirmed📉 AUDUSD Analysis – Current Trend & Trade Opportunity
Hello Traders,
I’ve prepared an updated analysis for the AUDUSD pair.
At the moment, AUDUSD has shifted out of its previous bullish structure and has now entered a bearish trend. Based on this shift, I’m planning to enter a limit sell trade at the level shared below:
🔹 Limit Sell Entry: 0.65232
🔹 Stop Loss: 0.65576
🔹 Targets:
• TP1: 0.64591
• TP2: 0.64591
• TP3: 0.63738
🔸 Risk/Reward Ratio: 4.27
Considering the trend reversal, I’m looking to open a position from these levels.
I meticulously prepare these analyses for you, and I sincerely appreciate your support through likes. Every like from you is my biggest motivation to continue sharing my analyses.
I’m truly grateful for each of you—love to all my followers💙💙💙

USD/CAD ( Triangle Formation)I think USD/CAD is playing out a triangle formation. We saw 4 touches a breakout & what seems to be a retest. Just waiting to see what happens now.
