Gold Rebounds: Geopolitical Tensions and a Weaker Dollar Drive tGold Rebounds: Geopolitical Tensions and a Weaker Dollar Drive the Recovery
Gold prices have rebounded after a recent dip, which followed reports of a ceasefire agreement between Israel and Hezbollah. Despite this temporary pullback, the broader dynamics supporting gold remain intact, driven by geopolitical uncertainty, inflation concerns, and central bank policies.
Geopolitical Tensions Support Gold
One of the primary factors behind gold’s continued strength is the persistence of geopolitical risks. The ongoing conflict in Ukraine keeps investors seeking safe-haven assets, with gold standing out as a key hedge against global instability. Even with temporary easing of tensions in the Middle East, the broader geopolitical landscape remains a strong support for gold prices.
US Dollar Weakness Boosts Gold
US economic data presented a mixed picture, which weakened the dollar and provided a boost to gold prices:
- **US GDP QoQ (2nd Estimate):** 2.8%, in line with forecasts, indicating steady economic growth.
- **US Initial Jobless Claims:** Reported at 213K, slightly better than the forecast of 215K, showcasing a stable labor market.
- **US Durable Goods Orders:** Increased by 0.2%, below expectations of 0.5%, signaling a softer investment demand.
- **US PCE Price Index YoY:** Rose to 2.3%, matching forecasts but higher than the previous 2.1%.
- **US Core PCE Price Index YoY:** Climbed to 2.8%, in line with expectations but up from the prior 2.7%.
These figures weakened the US dollar, which typically moves inversely to gold, making the precious metal more attractive to global investors.
Inflation Concerns and Central Bank Activity
Inflation remains a key driver for gold. Planned tariffs on imported goods, proposed by future President Donald Trump, could exacerbate inflationary pressures in the US, further boosting gold’s appeal as an inflation hedge.
Moreover, gold continues to benefit from a global environment of falling interest rates. Lower rates reduce the opportunity cost of holding non-yielding assets like gold, while central bank purchases add strong, consistent demand to the market.
Emerging Market Demand Strengthens Gold
Emerging economies, such as China and India, play a critical role in gold’s price trajectory. In these regions, gold holds significant cultural and investment value, and rising wealth levels contribute to increasing demand. This structural support further solidifies gold’s position as a long-term investment choice.
What’s Next for Gold?
Gold’s rebound highlights its resilience amid shifting global dynamics. While geopolitical developments like the ceasefire in the Middle East can trigger short-term volatility, the broader drivers—geopolitical tensions, inflation fears, and central bank policies—remain firmly in place.
As the dollar shows signs of softening, gold is likely to maintain its upward momentum in the long term. Is this the beginning of a renewed rally for gold, or will further global developments bring new challenges? Share your insights in the comments!
Dollar

Dollar Index (DXY) Analysis - A Deeper Correction Approaching?Dollar Index (DXY) Analysis - Is a Deeper Correction Approaching?
Since September 2024, the Dollar Index (DXY) has risen significantly, gaining 8.2%, marking its highest appreciation in months. This upward momentum has been fueled by positive economic indicators, increasing demand for dollars. Recently, the DXY reached the 107.00 mark, its highest resistance level since 2022. However, after hitting this point, the DXY exhibited a false breakout, suggesting potential buyer fatigue.
Currently, the price has dipped slightly to 105.93, with the possibility of further retracement towards the 38.2% Fibonacci level at 104.92 before continuing its upward trend.
Buying Potential
If the price returns to the range between 104.92 (38.2% Fibonacci) and 103.96 (50% Fibonacci) and shows a bullish reversal, it could indicate a continuation of the upward movement, presenting a buying opportunity. Key confluence points for the DXY include:
Horizontal support around 104.92, aligning with the Fibonacci retracement.
The overall upward trend since September.
The 50-period moving average on the daily chart, which may coincide with this support.
These factors suggest that if the price reaches the support zone, buyers could re-enter, pushing the price back towards recent highs around 106.97, potentially targeting 108.00.
Potential Targets
First Target: Retest the high at 107.00.
Secondary Target: Extend to 109.30, contingent on a confirmed breakout.
Alternative Bearish Scenario
If the price fails to hold at 104.92 and drops below the 50% retracement at 103.96, the index may decline further. In this scenario, the next significant support is at 102.99, aligning with the 61.8% Fibonacci retracement. This decline would indicate a deeper correction while still within a generally bullish framework.
However, breaching this level could negate the short-term bullish outlook and push the index down to 100.00, a key psychological support level.
Warning Signs for a Possible Sell Opportunity
A daily close below 103.96, suggesting weakening buyer support.
A sustained drop below 102.99, indicating a shift in the prevailing trend.
Summary
The DXY currently exhibits a predominantly bullish structure but is undergoing a natural correction after hitting a crucial resistance level. The area between 104.92 and 103.96 presents a potential buying opportunity, provided there are clear signs of a price reversal. Monitoring the specified support levels is crucial, as significant breaches could undermine the bullish scenario and lead to deeper declines.
Disclaimer
74% of retail investor accounts lose money when trading CFDs with this provider. Consider whether you understand how CFDs work and if you can afford the high risk of losing your money. Past performance is not indicative of future results. Investment values may fluctuate, and you may not recover your initial investment. This content is not intended for residents of the UK.

Dollar Index (DXY): Time to Fill the Gap?!
I guess you saw this gap down that was formed this night on Dollar Index.
Analysing a price action today, it looks like the market is preparing to fill it.
I see a nice bearish trap and inducement followed by a bullish imbalance
on an hourly.
I think that the index will go up to the gap opening level soon.
Goal - 106.11
❤️Please, support my work with like, thank you!❤️

DXY Potential UpsidesHey Traders, in today's trading session we are monitoring DXY for a buying opportunity around 105.500 zone, DXY is trading in an uptrend and currently is in a correction phase in which it is approaching the trend at 105.500 support and resistance area.
Trade safe, Joe.

Ethereum: Momentum Fueled by Growth and AdoptionEthereum: Momentum Fueled by Growth and Adoption
Ethereum (ETH) continued its upward trend over the past week, closely following
Bitcoin’s rally. The second-largest cryptocurrency by market capitalization is benefiting from a range of factors that reinforce its position as a leader in the blockchain space. With strong fundamentals, expanding use cases, and favorable seasonal trends, ETH’s price growth appears poised to continue.
Adoption and Network Usage
The growing adoption of Ethereum for a wide range of applications—ranging from decentralized finance (DeFi) to enterprise solutions—is a key driver of its rising value. Ethereum’s robust and versatile network continues to attract developers, businesses, and users, solidifying its role as the backbone of the blockchain ecosystem.
The Rise of DeFi and NFTs
The expansion of decentralized finance (DeFi) platforms, which leverage Ethereum’s smart contract capabilities, has created new opportunities for decentralized lending, borrowing, and trading. Simultaneously, the ongoing popularity of non-fungible tokens (NFTs) keeps Ethereum at the forefront of digital ownership and creative innovation.
Network Upgrades and Transaction Fee Burning
Technological improvements, such as Ethereum’s transition to proof-of-stake through the Merge, enhance network efficiency and sustainability. Additionally, the implementation of EIP-1559 introduced the burning of transaction fees, effectively reducing the supply of ETH and creating deflationary pressure, which can drive long-term price appreciation.
Institutional Investment and Ethereum ETFs
Institutional investors are increasingly entering the Ethereum market, driven by its utility and growth potential. One of the major catalysts has been the launch and increasing inflows into Ethereum-based ETFs, which provide a regulated and convenient way for institutional and retail investors to gain exposure to ETH. These inflows not only validate Ethereum’s role as a leading crypto asset but also contribute directly to its demand and price growth.
Seasonality and Market Momentum
Historically, the second half of December has often been a favorable period for cryptocurrency markets, including Ethereum. Factors such as increased trading activity, end-of-year portfolio adjustments, and overall market sentiment have historically supported upward trends during this time. Ethereum seems well-positioned to benefit from this seasonal tailwind, potentially pushing its price toward new highs.
Competition and Ecosystem Growth
Ethereum faces competition from other blockchain platforms, but its first-mover advantage, coupled with continuous innovation, helps it maintain a dominant position. The ecosystem of ERC-20 tokens—built on the Ethereum network—further strengthens its utility and value proposition.
Market Sentiment and Macroeconomic Factors
Positive market sentiment and media coverage contribute to Ethereum’s momentum. Broader macroeconomic factors, such as inflation and economic uncertainty, are also driving investors to explore alternatives like Ethereum as a hedge and growth asset.
Infrastructure and Partnerships
The continued development of infrastructure, including wallets, exchanges, and DeFi tools, makes Ethereum more accessible to users and investors. Strategic partnerships and collaborations within the blockchain space are also expanding Ethereum’s reach and utility.
Conclusion
Ethereum’s price growth is underpinned by a combination of strong network fundamentals, expanding use cases, increasing ETF inflows, and favorable seasonality. From DeFi and NFTs to network upgrades and institutional interest, Ethereum is positioned to continue its upward trajectory as we move into the traditionally bullish second half of December.
Will Ethereum leverage these advantages to reach new price milestones? Share your views and insights in the comments!

Nasdaq Modest Gains Amid Mixed Data and Rising OptimismNasdaq Modest Gains Amid Mixed Data and Rising Optimism
The Nasdaq index bounced back with a 0.37% gain today, recovering some ground after yesterday’s 0.5% decline. The market’s performance reflects ongoing digestion of mixed US economic data, supportive seasonality, and cautious optimism among investors.
US Economic Data Highlights
Recent economic data provided a mixed picture of the US economy, driving market fluctuations:
- **EIA Crude Oil Inventories:** Fell by -1.844M barrels, exceeding the forecast of -1M, signaling tighter supply conditions.
- **US GDP Growth (Q3, Second Estimate):** Remained steady at 2.8%, unchanged from the previous estimate, highlighting consistent economic expansion.
- **Personal Consumption and Spending:** October’s real personal consumption rose by just 0.1% (forecast: 0.2%), while consumer spending grew by 0.4%, meeting expectations but slowing from revised data of 0.6%.
- **Durable Goods Orders:** Increased by 0.2%, falling short of the 0.5% forecast, reflecting weaker demand for long-term goods.
- **PCE Price Index (YoY):** Increased to 2.3%, matching expectations but higher than the prior 2.1%, underscoring persistent inflationary pressures.
Market Sentiment and Seasonality
Seasonality continues to work in favor of the Nasdaq, as historical trends during this time of year often support equities. The **Fear & Greed Index**, currently at **64 points**, indicates moderate optimism and a "Greed" sentiment, encouraging risk-on behavior among investors.
Rate Cut Expectations
Markets are closely watching the Federal Reserve’s upcoming meeting on **December 18th**, with a **70% probability** currently priced in for a **25 basis-point rate cut**. If realized, this could provide additional support for equities by easing financial conditions, though its long-term effects remain uncertain.
Geopolitical Risks
Despite today’s recovery, geopolitical risks linger in the background. The ongoing war in Ukraine remains a significant concern, with potential implications for global energy prices, supply chains, and economic stability.
Long-Term Trend Intact, but Volatility May Persist
The Nasdaq’s long-term upward trend remains intact, supported by strong fundamentals, favorable seasonality, and investor optimism. However, the current environment of mixed economic data and rising policy uncertainty suggests that short-term volatility may persist.
Broader Context
Recent data highlights a steady but moderating US economy, while forward-looking risks remain:
- **Global Economic Outlook:** The S&P Global forecast projects global GDP growth of approximately 3% by 2025, with US growth slowing to below 2% next year and China toward 4%.
- **US Policy Risks:** Potential policy changes under the new administration could elevate inflation pressures and tighten financial conditions, introducing further uncertainty for equity markets.
Implications for Nasdaq
Today’s modest gain shows resilience in the Nasdaq as it rebounds from yesterday’s decline. Supportive seasonality and the potential for a December rate cut may provide short-term stability. However, investors should remain cautious as geopolitical risks and economic uncertainties could lead to continued market volatility.
What’s your outlook for the Nasdaq after today’s recovery? Can the index build on these gains, or will headwinds from economic data and global risks limit its upside? Share your thoughts in the comments!*

S&P 500: A +0.2% Gain Following a Day of DeclineS&P 500: A +0.2% Gain Following a Day of Decline
The S&P 500 rebounded with a modest 0.2% gain today, recovering some ground after yesterday’s 0.5% decline. The market’s move reflects ongoing digestion of mixed US economic data, supportive seasonality, and cautious optimism among investors.
US Economic Data Highlights
Yesterday’s data provided a mixed snapshot of the US economy, contributing to the market’s recent fluctuations:
- **EIA Crude Oil Inventories:** Fell by -1.844M barrels, exceeding the forecast of -1M, signaling tighter supply conditions.
- **US GDP Growth (Q3, Second Estimate):** Steady at 2.8%, unchanged from the previous estimate, highlighting consistent economic expansion.
- **Personal Consumption and Spending:** October’s real personal consumption rose by just 0.1% (forecast: 0.2%), while consumer spending grew by 0.4%, meeting expectations but showing a slowdown from revised data of 0.6%.
- **Durable Goods Orders:** Increased by 0.2%, falling short of the 0.5% forecast, reflecting weaker demand for long-term goods.
- **PCE Price Index (YoY):** Increased to 2.3%, matching expectations but higher than the prior 2.1%, indicating persistent inflationary pressures.
Market Sentiment and Seasonality
Seasonality continues to work in favor of the S&P 500, as historical trends during this period often support equities. The **Fear & Greed Index**, currently at **64 points**, reflects moderate optimism and a "Greed" sentiment, which typically aligns with risk-on behavior in the markets.
Rate Cut Expectations
Markets remain focused on the Federal Reserve’s upcoming meeting on **December 18th**, with a **66,3%% probability** currently priced in for a **25 basis-point rate cut**. Such a move could provide additional support for equities by easing financial conditions, though its long-term impact remains uncertain.
Geopolitical Risks
While market sentiment has improved slightly, risks remain in the background. The ongoing war in Ukraine continues to pose threats to global stability, with potential knock-on effects on energy prices, supply chains, and economic performance.
Long-Term Trend Intact, but Volatility Likely
The S&P 500’s long-term upward trend remains intact, bolstered by supportive seasonality, stable GDP growth, and investor optimism. However, the current environment of mixed economic data and rising policy uncertainty suggests that market volatility could persist in the short term.
Broader Context
Yesterday’s data underscored a steady but moderating US economy, while forward-looking risks remain:
- **Global Economic Outlook:** The S&P Global forecast anticipates global GDP growth of approximately 3% by 2025, with US growth slowing to below 2% next year and China toward 4%.
- **US Policy Risks:** Potential policy shifts under the new administration could elevate inflation pressures and tighten financial conditions, introducing further uncertainty for equity markets.
Implications for S&P 500
Today’s modest gain shows resilience in the face of mixed signals from economic data and global risks. With supportive seasonality and a strong likelihood of a December rate cut, the S&P 500 may find short-term support. However, investors should remain vigilant, as volatility is likely to persist amid policy uncertainties and geopolitical risks.
What’s your outlook for the S&P 500 after today’s rebound? Can the market sustain its gains, or will headwinds from mixed data and global risks take over? Share your thoughts in the comments!

Gold Rebounds: Geopolitical Tensions and a Weaker Dollar Drive tGold Rebounds: Geopolitical Tensions and a Weaker Dollar Drive the Recovery
Gold prices have rebounded after a recent dip, which followed reports of a ceasefire agreement between Israel and Hezbollah. Despite this temporary pullback, the broader dynamics supporting gold remain intact, driven by geopolitical uncertainty, inflation concerns, and central bank policies.
Geopolitical Tensions Support Gold
One of the primary factors behind gold’s continued strength is the persistence of geopolitical risks. The ongoing conflict in Ukraine keeps investors seeking safe-haven assets, with gold standing out as a key hedge against global instability. Even with temporary easing of tensions in the Middle East, the broader geopolitical landscape remains a strong support for gold prices.
US Dollar Weakness Boosts Gold
US economic data presented a mixed picture, which weakened the dollar and provided a boost to gold prices:
- **US GDP QoQ (2nd Estimate):** 2.8%, in line with forecasts, indicating steady economic growth.
- **US Initial Jobless Claims:** Reported at 213K, slightly better than the forecast of 215K, showcasing a stable labor market.
- **US Durable Goods Orders:** Increased by 0.2%, below expectations of 0.5%, signaling a softer investment demand.
- **US PCE Price Index YoY:** Rose to 2.3%, matching forecasts but higher than the previous 2.1%.
- **US Core PCE Price Index YoY:** Climbed to 2.8%, in line with expectations but up from the prior 2.7%.
These figures weakened the US dollar, which typically moves inversely to gold, making the precious metal more attractive to global investors.
Inflation Concerns and Central Bank Activity
Inflation remains a key driver for gold. Planned tariffs on imported goods, proposed by future President Donald Trump, could exacerbate inflationary pressures in the US, further boosting gold’s appeal as an inflation hedge.
Moreover, gold continues to benefit from a global environment of falling interest rates. Lower rates reduce the opportunity cost of holding non-yielding assets like gold, while central bank purchases add strong, consistent demand to the market.
Emerging Market Demand Strengthens Gold
Emerging economies, such as China and India, play a critical role in gold’s price trajectory. In these regions, gold holds significant cultural and investment value, and rising wealth levels contribute to increasing demand. This structural support further solidifies gold’s position as a long-term investment choice.
What’s Next for Gold?
Gold’s rebound highlights its resilience amid shifting global dynamics. While geopolitical developments like the ceasefire in the Middle East can trigger short-term volatility, the broader drivers—geopolitical tensions, inflation fears, and central bank policies—remain firmly in place.
As the dollar shows signs of softening, gold is likely to maintain its upward momentum in the long term. Is this the beginning of a renewed rally for gold, or will further global developments bring new challenges? Share your insights in the comments!

Ethereum: Momentum Fueled by Growth and AdoptionEthereum: Momentum Fueled by Growth and Adoption
Ethereum (ETH) continued its upward trend over the past week, closely following
Bitcoin’s rally. The second-largest cryptocurrency by market capitalization is benefiting from a range of factors that reinforce its position as a leader in the blockchain space. With strong fundamentals, expanding use cases, and favorable seasonal trends, ETH’s price growth appears poised to continue.
Adoption and Network Usage
The growing adoption of Ethereum for a wide range of applications—ranging from decentralized finance (DeFi) to enterprise solutions—is a key driver of its rising value. Ethereum’s robust and versatile network continues to attract developers, businesses, and users, solidifying its role as the backbone of the blockchain ecosystem.
The Rise of DeFi and NFTs
The expansion of decentralized finance (DeFi) platforms, which leverage Ethereum’s smart contract capabilities, has created new opportunities for decentralized lending, borrowing, and trading. Simultaneously, the ongoing popularity of non-fungible tokens (NFTs) keeps Ethereum at the forefront of digital ownership and creative innovation.
Network Upgrades and Transaction Fee Burning
Technological improvements, such as Ethereum’s transition to proof-of-stake through the Merge, enhance network efficiency and sustainability. Additionally, the implementation of EIP-1559 introduced the burning of transaction fees, effectively reducing the supply of ETH and creating deflationary pressure, which can drive long-term price appreciation.
Institutional Investment and Ethereum ETFs
Institutional investors are increasingly entering the Ethereum market, driven by its utility and growth potential. One of the major catalysts has been the launch and increasing inflows into Ethereum-based ETFs, which provide a regulated and convenient way for institutional and retail investors to gain exposure to ETH. These inflows not only validate Ethereum’s role as a leading crypto asset but also contribute directly to its demand and price growth.
Seasonality and Market Momentum
Historically, the second half of December has often been a favorable period for cryptocurrency markets, including Ethereum. Factors such as increased trading activity, end-of-year portfolio adjustments, and overall market sentiment have historically supported upward trends during this time. Ethereum seems well-positioned to benefit from this seasonal tailwind, potentially pushing its price toward new highs.
Competition and Ecosystem Growth
Ethereum faces competition from other blockchain platforms, but its first-mover advantage, coupled with continuous innovation, helps it maintain a dominant position. The ecosystem of ERC-20 tokens—built on the Ethereum network—further strengthens its utility and value proposition.
Market Sentiment and Macroeconomic Factors
Positive market sentiment and media coverage contribute to Ethereum’s momentum. Broader macroeconomic factors, such as inflation and economic uncertainty, are also driving investors to explore alternatives like Ethereum as a hedge and growth asset.
Infrastructure and Partnerships
The continued development of infrastructure, including wallets, exchanges, and DeFi tools, makes Ethereum more accessible to users and investors. Strategic partnerships and collaborations within the blockchain space are also expanding Ethereum’s reach and utility.
Conclusion
Ethereum’s price growth is underpinned by a combination of strong network fundamentals, expanding use cases, increasing ETF inflows, and favorable seasonality. From DeFi and NFTs to network upgrades and institutional interest, Ethereum is positioned to continue its upward trajectory as we move into the traditionally bullish second half of December.
Will Ethereum leverage these advantages to reach new price milestones? Share your views and insights in the comments!

Nasdaq: A -0.9% Decline Amid Mixed Economic DataNasdaq: A -0.9% Decline Amid Mixed Economic Data
The Nasdaq index experienced a slight decline of 0.9% today, reflecting a mix of economic signals, investor sentiment, and broader geopolitical concerns. Key data releases from the US provided a nuanced picture of economic performance, contributing to cautious market behavior.
US Economic Data Highlights
- **EIA Crude Oil Inventories:** Fell by -1.844M barrels, exceeding the forecast of -1M, reflecting tighter supply conditions.
- **US GDP Growth (Q3, Second Estimate):** Steady at 2.8%, unchanged from the previous estimate, highlighting consistent economic expansion.
- **Personal Consumption and Spending:** October’s real personal consumption rose by just 0.1% (forecast: 0.2%), while consumer spending grew by 0.4%, meeting expectations but signaling a slowdown compared to revised previous data of 0.6%.
- **Durable Goods Orders:** Increased marginally by 0.2%, falling short of the forecast of 0.5%, indicating weaker-than-expected demand for long-term goods.
- **PCE Price Index (YoY):** Rose to 2.3%, aligning with forecasts but higher than the previous 2.1%, underscoring mild inflationary pressures.
Market Sentiment and Seasonality
Despite today’s decline, seasonality is currently favorable for the Nasdaq, as historical trends often support equities during this time of year. Additionally, the **Fear & Greed Index** currently sits at **64 points**, indicating moderate optimism among investors and a "Greed" sentiment, which typically supports risk-on behavior in the markets.
Rate Cut Expectations
Market participants are closely monitoring monetary policy, with a **70% probability** currently priced in for a **25 basis-point rate cut** at the Federal Reserve’s next meeting on **December 18th**. Such a move could provide additional support for equities by easing financial conditions, though its long-term impact remains uncertain.
Geopolitical Risks
While the economic picture and market sentiment provide support, ongoing geopolitical risks continue to weigh on investor confidence. The war in Ukraine remains a significant factor in the global risk landscape, with potential implications for energy prices, supply chains, and broader economic stability.
Long-Term Trend Intact, but Correction Could Persist
The Nasdaq’s long-term upward trend remains intact for now, supported by strong economic fundamentals and favorable seasonality. However, the current correction may take some time to resolve as markets digest mixed data and geopolitical risks. Investors should be prepared for potential short-term volatility while keeping an eye on key macroeconomic developments.
Broader Context
Today’s data reinforced the view of a steady, albeit moderating, US economy. However, forward-looking risks are rising:
- **Global Economic Outlook:** The S&P Global forecast predicts global GDP growth of approximately 3% by 2025, with the US slowing to below 2% next year and China toward 4%.
- **US Policy Risks:** Anticipated policy changes under the new administration may elevate inflationary pressures and tighten financial conditions, introducing further uncertainty for equity markets.
Implications for Nasdaq
The Nasdaq’s modest decline today reflects investor caution as the market digests mixed signals from economic data and weighs the potential for policy shifts. However, supportive seasonality, a "Greed" sentiment on the Fear & Greed Index, and expectations of a December rate cut could help stabilize or even boost the index in the near term.
Looking ahead, the interplay between policy developments, global growth dynamics, geopolitical risks, and corporate earnings will remain crucial for the index's direction.
What’s your outlook for the Nasdaq? Will the anticipated rate cut and seasonal trends provide a boost, or will geopolitical and economic risks keep the market under pressure? Share your thoughts in the comments!

GOLD FURTHER SELL OFF?! (UPDATE)Gold has pushed up & playing within a range. It's moving perfectly within a range to create either a flat or complex correction pattern, either in a 3 or 5 Sub-Wave form.
Remember, Wave 2 & Wave 4 are always corrective moves so they move slow. Time to exercise patience🤞🏼

DXY - Correction in ProgressWe analysed DXY / Dollar few days back and it was highlighting a Bearish move. This move is in progress and so far we have a Correction Wave A & B completed. Correction Wave C might take dollar even lower depending on macro outlook i.e. ceasefire deal / Fed rate decision etc.
Best approach is to go from level to level rather than aiming for a swing move as sentiments can switch anytime.
For entries, please wait for at least two candle reversals at the specified level and apply appropriate risk management.
If you found this analysis helpful, please consider boosting and following for more updates.
Disclaimer: This content is for educational purposes only and should not be considered financial advice.

Will the Dollar Index Redefine Global Economic Equilibrium?In the intricate dance of international trade and geopolitical strategy, the Dollar Index emerges as a critical compass navigating the turbulent waters of economic uncertainty. The article illuminates how this financial barometer reflects the profound implications of proposed tariffs by the U.S. administration, revealing a complex interplay of currencies, trade relationships, and global market sentiments that extend far beyond mere numerical fluctuations.
The proposed tariffs targeting key trading partners like Canada, Mexico, and China represent more than economic policy—they are strategic maneuvers with potential seismic shifts in global trade dynamics. As the Dollar Index climbs, reflecting the U.S. dollar's strength, it simultaneously exposes the delicate balance of international economic relationships. The potential consequences ripple through supply chains, consumer markets, and diplomatic corridors, challenging the post-World War II trade paradigm and forcing nations to recalibrate their economic strategies in real time.
Beyond the immediate market reactions, these developments signal a broader philosophical question about economic sovereignty and interdependence. The tariff proposals challenge long-established multilateral agreements, potentially accelerating a transformation in how nations perceive economic collaboration. While the immediate impact is visible in currency fluctuations and market volatility, the long-term implications could reshape global economic architecture, prompting a reevaluation of the U.S. dollar's role as the predominant global reserve currency and testing the resilience of international trade networks.

USDCHF Short Trade.USDCHF breakout out from its uptrend on downside we might see consolidation to downtrend in USDCHF

GOLD is getting ready to break out!I think we should get a move to break out to the upside and start making new highs on Gold. US will have a Holiday this week so that will leave the dollar struggling on momentum. Trying to catch a piece of the move up.

GBPUSD SHORT TO $1.24300 (UPDATE)Once again overnight (Asia session) GU shot back up again towards our Wave 5 entry zone, rejected it again & is running 70 PIPS in profit so far.
Me & my Gold Vault Academy students understand that Wave 5 being the FINAL IMPULSE WAVE, means that wave will move slowly & trap in a lot of early buyers before it reaches its target. As an Elliott Wave trader, you need to learn to be generous with your SL as we are long term traders trading the higher TF’s, not scalpers👌

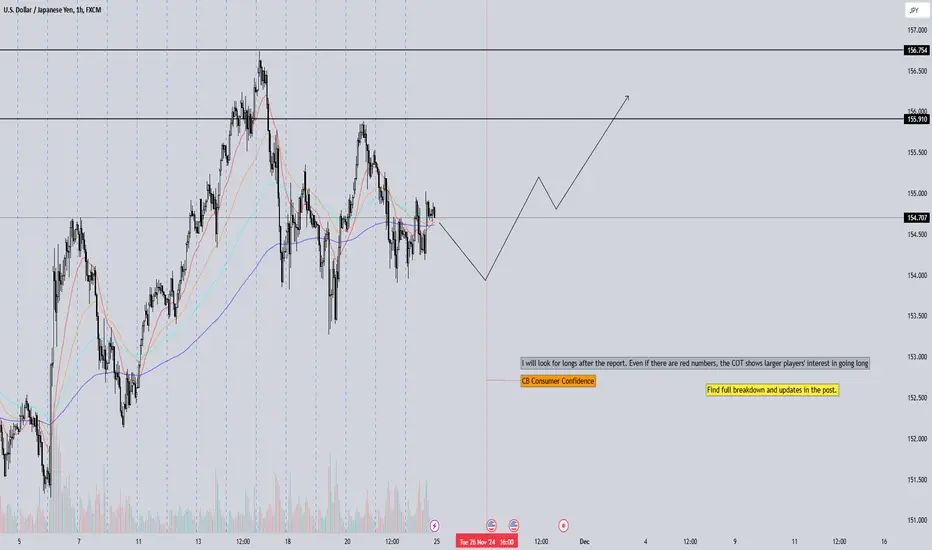
USDJPY GAME PLAN WEEK 48After analyzing the forex market's COT report released last Friday, I have aligned my bias with the macroeconomic reports scheduled for this week. There are fewer key events compared to last week, but I am confident that the ones we do have are worth paying attention to.
Now, let me explain why I consider USD/JPY to be a good long trade. First of all, the COT data revealed increased interest in a stronger dollar, further strengthening the already solid bullish sentiment. At the same time, all other currencies either showed increased long interest or reduced short interest—except for JPY.
I avoid trading pairs that are on the same side of the market, as I aim to find as much friction as possible to create the volatility that we, as traders, thrive on. However, this alone is not enough. I will also follow the key reports and events this week, including:
CB Consumer Confidence
Preliminary GDP (q/q)
Unemployment Claims
Core PCE Price Index (m/m)
FOMC Meeting Minutes
Keep in mind that the U.S. market is closed on Thursday.
I won’t wait for every individual release before taking action but will trade accordingly as opportunities arise. For instance, I plan to go long after the CB Consumer Confidence report, but not blindly—I will still base my entries on technical levels. However, the actual numbers in the reports will matter less.
The reality is that sometimes a number that misleads the majority, combined with a strong underlying bias, can create a divergence with immense force behind it.
I will provide updates as the week progresses. Trades might be held for two days or even throughout the entire week, depending on market conditions.
GOLD FURTHER SELL OFF?! (UPDATE)After a strong 1,000+ PIPS sell off yesterday, bearish momentum is still holding strong on Gold & keeping prices down. Yesterday's sell off would be considered as Wave 1 of the Bearish correction, which means any minor wave 2 correction we see, this would be your chance to get into sell positions if you haven't already.
I will be looking to get into further sell positions for my Gold Fund investors if market structure offers the opportunity. I will NOT be sharing my additional entries on here for free.

EUR/USD Hits Critical Support: Will It Move Higher?EUR/USD has experienced a decline of over 5% in recent weeks, without any significant pullbacks, raising the likelihood of a potential upward movement in the coming days. This downward trend has brought the price to a key support level on the daily chart, near 1.0450, a region previously tested in December 2022. Following this, the price exhibited classic false breakout behaviour, briefly dipping below this support before quickly reversing upwards.
Understanding False Breakouts in the Forex Market
A false breakout occurs when the price temporarily breaches a significant support or resistance level but fails to maintain that movement, swiftly reversing direction. In the case of EUR/USD, the breakdown below 1.0450 was rejected by buyers, which resulted in an immediate upward rebound.
False breakouts are relatively common in the Forex market, where heightened volatility and manipulation by larger players can trigger fleeting movements that capture the stop-loss orders of conservatively positioned traders. Such scenarios often create opportunities to trade in the opposite direction of the initial breakout.
Potential Trigger: Break Above Previous Candle High
Today's candle has exceeded the high of the prior candle, signalling a possible shift in direction as buyers begin to regain momentum. This context indicates that the 1.0450 region could once again serve as a crucial defensive point for buyers.
Potential Upside in the Coming Days
The breakout above the previous candle's high is a positive indication for buyers. If EUR/USD can maintain its position above the 1.0520 level, it may signify the onset of buying strength, with the next upside targets being:
1.0670 - A zone where previous support may act as resistance, coinciding with the 38.2% Fibonacci retracement level of the recent decline.
1.0750 - A significant resistance level and prior consolidation zone on the daily chart, aligning with the 50% Fibonacci retracement of the recent downside.
To confirm this bullish scenario, the price will need to sustain upward momentum characterized by large-bodied daily candles and increasing buying volume.
Alternative Scenario: Bearish Resumption
Should the price fail to maintain the rally and break below the 1.0450 support level, the bearish scenario could resume, with subsequent targets including:
The next relevant support zone on the daily chart around 1.0250.
A final target near the 1.0100 region, which attracted attention in November 2022.
EUR/USD is currently at a critical juncture following a significant decline and a false breakout of daily support. The analysis suggests potential for upside as long as the price remains above 1.0450. However, the possibility of a bearish scenario cannot be dismissed, especially in the event of a negative reversal. This is a crucial period for monitoring price behaviour at key technical levels.
Disclaimer:
74% of retail investor accounts lose money when trading CFDs with this provider. You should consider whether you understand how CFDs work and whether you can afford to take the high risk of losing your money. Past performance is not necessarily indicative of future results. The value of investments may fall as well as rise and the investor may not get back the amount initially invested. This content is not intended for nor applicable to residents of the UK.

EURUSD - Finally we will see a bullish momentum?Price just closed the gap and in my opinion its the fuel it needs to go higher and start retracing in the higher timeframes.
Let's see what happens

GU giving a bullish play...Was looking for a area where price wants to turn around. It looks like it wants to do it here. Looking for price to push up some where above the Previous Daily Low. But cautious that it could reverse and continue bearish from that point.

Gold is giving Bullish Signsnow that we are in the London kill zone I am looking at price action and its looking like it wants to switch up bullish. Got In right at the open of Killzone. and price has now moved back above the daily level. Thinking it can hold from here and push up. if it breaks down then we will wait for a test of a lower level before getting in.

#2 Danger BTC is falling Bearish Outlook and Macro Perspective
As in my previous remarks, I signaled an unstable #100k level, which has developed into a failure even to touch this mark. This reflects a loosening in bullish momentum, as many holders and investors are now taking profits. It's important to remember that there are also long-term holders (over 5 years) who experienced losses of up to #77% since November 2021. These holders might now be exiting their positions, adding selling pressure to the market.
Moreover, with speculation surrounding Trump's actions post-20 January next year, it’s wise to approach the market cautiously and avoid wild bets. There are still lagging opportunities in other sectors. For example, Cardano (ADA) recently posted #38% gains in two weeks, highlighting alternative investments that are catching up to the current crypto bull run.
Bitcoin Analysis: Bearish Outlook and Short-Term Targets
Position Details:
Current Sell Entry: #97k
Target: #90k
Market Structure Overview:
The price action is respecting a rising wedge pattern, which is generally a bearish continuation pattern. The breakdown seen near the current price (~#94k) aligns with your bearish outlook.
Bearish Confirmation:
RSI: The RSI has fallen below neutral (currently #34.06), signaling weakening momentum.
MACD: The MACD histogram shows growing bearish momentum (red bars) alongside a bearish crossover.
Volume Flow Index (VFI):
The VFI at #20 suggests moderate capital flow into the market, but not sufficient to sustain bullish trends.
Short-Term Target: #90k
The primary target remains #90k, supported by:
The wedge breakdown projection aligning with this level.
Historical support zones evident on the chart.
December Scenario: Potential Retest or Breakout
Heading into December, two possible scenarios are likely:
Scenario A: Retest as a Double Top
A rebound could take the price back to #97k or higher, potentially forming a double top. Rejection here would confirm continued bearish pressure.
Scenario B: Breakout to #100k-#102k
If bullish momentum unexpectedly revives, a breakout to #100k-#102k could occur. However, this would likely represent a false breakout, followed by a deeper decline.
Technical Outlook:
Key Resistance Levels:
#96k (current zone of interest).
#100k-#102k (psychological resistance and possible retest zone).
Key Support Levels:
#90k (primary target).
#85k (potential deeper breakdown area).
Conclusion:
The current analysis reinforces a bearish short-term outlook, with a sell position targeting #90k. December may bring increased volatility with a possible retest at #97k or a breakout to #100k-#102k before the downward trend resumes. This cautious approach is underscored by macro factors such as profit-taking from long-term holders and alternative opportunities, like Cardano’s recent #38% gains, still lagging the broader crypto bull run. Stay vigilant with key levels and monitor confirmation signals from RSI and MACD.
