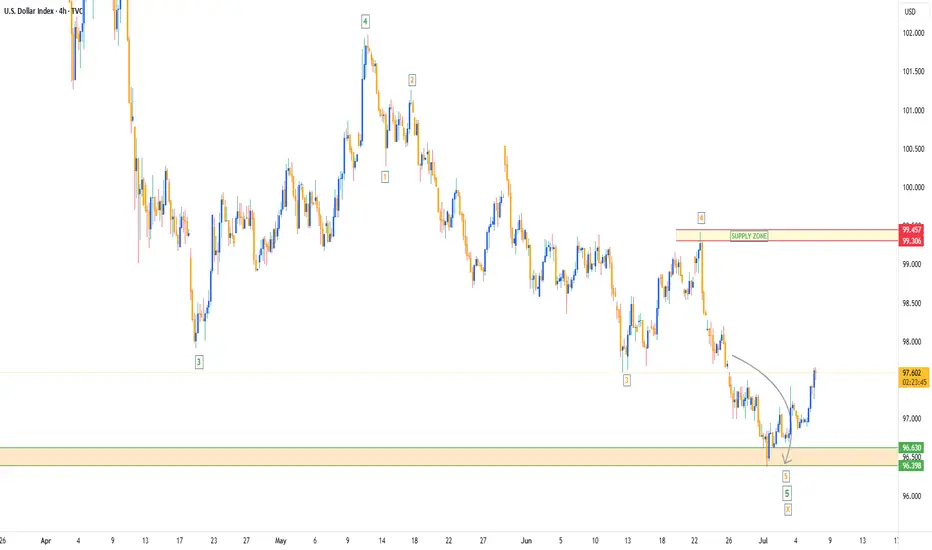
Running Flat FormationHere we have a Running Flat Formation. At point C it looks to me that price has broken the small upward trend it was in and has imprinted a H&S formation and broken to the downside. I'm waiting for a retest on the previous new structure low (NSL) before taking an entry.
Dollar

BIG BEAUTIFUL BILL - Markets are Ready to PUMP Again! At the 4th of July, the Independence Day, the "One Big Beautiful Bill Act" was signed into law by President Trump. In this idea I want to take a closer look at some points of this law and explain why I consider it VERY bullish for most of financial markets, and especially for crypto.
Here are some key points of the law:
Raises the U.S. debt ceiling by $5 trillion, the largest single increase in U.S. history
Makes many Trump-era 2017 tax cuts permanent: keeps lower individual tax rates, preserves expanded standard deduction, retains corporate tax rate at 21%
Introduces new tax breaks: increases Child Tax Credit, exempts tips, overtime, and Social Security from federal income tax (with limitations)
Adds ~$150 billion to defense and another $150 billion toward border enforcement, including massive ICE budget increase
Trims SNAP food aid by ~$186–200 billion, tightening eligibility (e.g. raising work‑requirement age)
What changes can happen in the economy? Big tax breaks combined with increased expenses cause the growth of financial deficit, the projected by CBO deficit can reach $3 trillion. In this situation the only solution is increasing the national debt which makes Interest Rates climb higher (Yale’s Budget Lab forecasts a 1.2 pp increase in the 10‑year yield).
Why do I think this is bullish for most of stocks and mainly for crypto?
The increase of debt ceiling has always had a positive impact on the crypto and namely on $BTC. The best example is Fiscal Responsibility Act that was signed back in June 5, 2023. This act increased the debt ceiling for +$4.7 billion, after that Bitcoin surged upwards from $25,000 to $75,000 in ~half a year. Similar outcome can be expected now too.
Market perceives U.S. fiscal loosening as inflationary and dollar-weakening, making Bitcoin (as a decentralized and limited-supply asset) more attractive. TVC:DXY has already shown signs of weakness.
Large deficits often force future monetary easing or Fed bond buying to absorb debt. Lower interest rates and more liquidity are historically bullish for risk assets, including crypto.
Rising yields and bond sell-offs spook traditional markets. In this situation, Bitcoin becomes an attractive uncorrelated hedge for portfolios amid volatility in traditional assets.
To sum up , I believe the Big Beautiful Law is, to put it mildly, not good for US economy. However, local effects on stock & crypto markets can be considered positive for investors & traders. With this said, I believe we can expect CRYPTOCAP:BTC to reach $150,000 goal this year and mark this milestone as an ATH for the current bull cycle.

Gold will continue with its bullish breakoutLooking for new highs to be made. Price has pushed bullish as trump started talking about the tariffs early today. Even though they are not supposed to discuss till the 9th. We can get a early move for the week. Monitoring the price action to see if I can get in where I fit in!

Dollar Index OverviewThe Dollar moving as we expect it to within the Gold Fund! As soon as we saw a '5 Bearish Wave Completion' on the DXY, straight away buyers entered the market & start pushing price back up.
My Gold Fund investors & Gold Vault Academy students know from our 'Q3 Market Breakdown Report' what we're expecting for the Dollar in the next 3 months.
DXY Bullish IdeaDXY has been printing Lows since past weeks and is currently testing a good long term support. A good bounce is expected in dollar.
Gold Weekly Recap – Week 27 (30 Jun – 04 Jul)🟡 XAUUSD | MJTrading
Overview
Gold (XAUUSD) staged a significant recovery this week after retesting a critical support zone. Price action reflected strong buying interest at lower levels, followed by consolidation near mid-range resistance.
🔹 Key Levels:
Strong Support Zone: 3,246 – 3,250
Weekly Low: 3,246.35 (30 June)
Weekly High: 3,365.77 (3 July)
Closing Price: ~3,343
🔹 Price Action Summary:
✅ Early Week Retest & Reversal
After the prior week’s decline, gold opened the week near the major support area around 3,246. This zone acted as a strong demand pocket, triggering a swift rejection and initiating a bullish reversal.
✅ Sustained Rally to Resistance
Price climbed steadily, riding the 15-period EMA to reach the weekly high of 3,365.77 on 3 July. This move represented a nearly 4% recovery off the lows, fueled by renewed safe-haven flows and short covering.
✅ Midweek Consolidation
Following the rally, gold entered a sideways consolidation phase between 3,340 and 3,365. EMA flattening reflected a pause in momentum as traders assessed the next directional catalyst.
✅ Late-Week Pullback
Toward the end of the week, price tested the 3,310–3,320 area before modestly bouncing into the Friday close. Overall, the market maintained a cautiously bullish tone while holding above the prior support.
🔹 Technical Perspective:
🔸 Bias: Cautiously Bullish
Price defended the strong support and printed a higher low structure.
Sustained closes above 3,300 maintain the bullish outlook.
🔸 Near-Term Resistance:
3,365–3,390 remains the immediate supply zone to monitor for breakout attempts.
🔸 Key Support:
The 3,246–3,250 area continues to be the primary downside line in the sand.
🔹 Special Note – 4th July US Bank Holiday
Trading volumes were notably lighter on Thursday, 4th July, due to the US Independence Day holiday. This contributed to reduced liquidity and muted volatility, with many traders and institutions off desks. The thinner market conditions likely influenced the late-week pullback and consolidation, as participation was limited heading into the weekend.
🔹 Sentiment & Outlook
The decisive rebound from support suggests that buyers are defending value zones aggressively. However, failure to close the week above 3,365 leaves gold vulnerable to another retest of mid-range levels if fresh catalysts don’t emerge.
Traders should watch for:
A clean breakout above 3,365 to confirm continuation higher.
Any sustained weakness below 3,300 as a signal of fading bullish momentum.
🧭 Next Week’s Focus:
Monitoring whether the consolidation evolves into accumulation or distribution.
Watching for a breakout or deeper pullback
Reactions to upcoming economic data
EMA alignment: If the 15 EMA continues to track above the 60 EMA, it supports a bullish bias.
Chart Notes:
The main chart highlights this week’s action, while the inset provides a fortnight overview of the broader decline and recovery for context.
Thank you for your time and your support...
🚀🚀Boost it if you like it (Thanks)🚀🚀
#Gold #XAUUSD #GoldTrading #Forex #Commodities #TechnicalAnalysis #PriceAction #TradingRecap #MJTrading #GoldForecast #MarketReview #WeeklyRecap #TradingView

EURUSD: Support & Resistance Analysis For Next Week 🇪🇺🇺🇸
Here is my recent structure analysis and important
supports and resistances for EURUSD for next week.
Consider these structures for pullback/breakout trading.
❤️Please, support my work with like, thank you!❤️
I am part of Trade Nation's Influencer program and receive a monthly fee for using their TradingView charts in my analysis.

DXY (Dollar Index) longs to shortsThe dollar has been bearish for several weeks, but we’re now starting to see signs of a potential retracement due to price being in oversold territory. Last week, DXY reacted from a key weekly demand level, suggesting that we could see some short-term bullish movement before any continuation to the downside.
I’ll be watching closely for price to either push higher into liquidity or retrace slightly deeper into more discounted demand zones for a cleaner long setup. This would also align with my short setups across other major pairs, making DXY strength a key narrative this week.
Confluences for DXY Longs:
DXY has been bearish for an extended period — now showing signs of accumulation on higher timeframes
Price may retrace upwards to collect liquidity before continuing its macro downtrend
Recently reacted from a major weekly demand zone
Imbalances and liquidity above, including Asia highs, remain untapped
P.S. If price fails to react from any of my current POIs, I’ll patiently wait for new zones to develop and adjust accordingly — always staying aligned with what price tells us.
Let’s stay sharp and crush the week ahead!

BTC vs DXY – Macro Setup at a Crossroads
Looking at BTC and DXY on the weekly, we’ve seen 3 key periods so far. In the first two, the pattern was clear: BTC went up, DXY went down.
Now we’re in the third period: what’s next?
👉 Has the move already played out?
👉 Is it happening now?
👉 Has DXY bottomed and BTC topped, or will DXY go lower while BTC climbs?
Macro conditions may help guide us.
BTC looks strong — supported by ETF inflows, on-chain strength, and institutional demand.
DXY looks weak — with softer economic data and rising expectations for rate cuts.
In my view, tariffs are likely to weigh heavier on DXY than BTC, favoring more upside for BTC.
The recent Big Beautiful Bill could also add fuel to BTC while adding pressure on DXY.
Always take profits and manage risk.
Interaction is welcome.

July 4 GOLD FIREWORKS!!!Gold bout to POP!!!! and it could be seriously huge! Im just patiently waiting for a area of entry. I have never traded a July 4th Holiday with this much clarity on what I see so this could get interesting.

Get Ready! Hot Air Rises. Fartcoin About To Break Wind.Trading Fam,
Our national debt is a meme. The buying power of our dollar is a meme. Our monetary system is a meme. The Fed is a ponzi scheme and a meme. Everything related to geopolitical economics has become a meme. We can't take any of this stuff seriously anymore. So, why not make a profit on the best memes of the day? Enter pungeant FARTCOIN. AI-created and managed, FARTCOIN is cutting loose with no reservations. And it looks like it is about to break wind again. They say hot air rises. Let's see how far this stink can go.
Let her rip!
Stew

Fundamental Market Analysis for July 3, 2025 USDJPYEvent to pay attention to today:
15:30 EET. USD - Non-Farm Employment Change
15:30 EET. USD - Unemployment Rate
15:30 EET. USD - Unemployment Claims
17:00 EET. USD - ISM Services PMI
The Japanese Yen (JPY) traded with a slight positive bias against the bearish US Dollar (USD) during the Asian session on Thursday and remains near the near one-month peak reached earlier this week. Despite the Bank of Japan's (BoJ) hesitation to hike rates, investors seem convinced that the central bank will remain on the path of normalizing monetary policy amid rising inflation in Japan. This is a significant divergence from the stance of other major central banks (including the U.S. Federal Reserve (Fed)), which are leaning towards a softer approach, and is favorable for lower JPY yields.
Meanwhile, US President Donald Trump hinted at a possible end to trade talks with Japan, and also threatened new tariffs against Japan over its perceived reluctance to buy American-grown rice. This, along with the overall positive tone towards risk, is a headwind for the safe-haven yen. In addition, traders seem reluctant and prefer to take a wait-and-see approach ahead of today's release of the closely watched US Non-Farm Payrolls (NFP) report. The crucial data will play a key role in influencing the US Dollar (USD) and will give a significant boost to the USD/JPY pair.
Trade recommendation: BUY 144.00, SL 143.00, TP 145.40

Silver Extends Gains to $36.70Silver hovered near $36.70 on Thursday after rising 1.4% in the previous session, supported by easing trade tensions and stronger expectations of Fed rate cuts.
Markets are now watching key US economic releases to see whether silver can sustain its upward momentum.
Resistance is at 37.50, while support holds at 35.40.

Gold is Pushing Bullish but is it really ready???This looks like a early move to move full on bullish. I feel like it might need to sweep the low from mid week before they really ready to go bullish. waiting for things to show a bit more clear during the Kill Zone.

A Dollar in Freefall and a Bitcoin on the Brink
In the grand theater of global finance, narratives rarely align with perfect symmetry. The market is a complex ecosystem of competing forces, a cacophony of signals where long-term tectonic shifts can be momentarily drowned out by the piercing alarms of short-term volatility. Today, we stand at the precipice of one of the most profound and fascinating divergences in modern financial history, a story of two assets locked in an inverse dance, each telling a radically different tale about the immediate future.
On one side of this chasm stands the titan of the old world, the U.S. Dollar. The bedrock of global commerce, the world’s undisputed reserve currency for nearly a century, is in a state of unprecedented crisis. The U.S. Dollar Index (DXY), the globally recognized measure of the greenback’s strength against a basket of other major currencies, is in freefall. It is suffering its most catastrophic crash since 1991, and by some measures, is enduring its worst year since the historic turmoil of 1973. This is not a minor correction; it is a fundamental challenge to the dollar’s hegemony, a macro-level event driven by seismic shifts in U.S. economic policy, including aggressive trade tariffs and ballooning government deficits. For the world of alternative assets, a collapsing dollar is the loudest possible bullhorn, a clarion call to seek refuge in stores of value that lie beyond the reach of any single government.
On the other side of the chasm is the digital challenger, Bitcoin. Born from the ashes of the 2008 financial crisis as an answer to the very monetary debasement the dollar is now experiencing, Bitcoin should, by all fundamental logic, be soaring. The dollar’s demise is the very thesis upon which Bitcoin’s value proposition is built. And yet, while the long-term case has never looked stronger, the short-term picture is fraught with peril. A close reading of its technical chart reveals a market showing signs of exhaustion. A key momentum indicator, the stochastic oscillator, is flashing a stark warning, suggesting that the digital asset, far from rocketing to new highs, could be on the verge of a significant drop, a painful correction that could pull its price back below the psychological threshold of $100,000.
This is the great divergence. The macro-economic landscape is screaming for a flight to safety into hard assets like Bitcoin, while the micro-level technicals of Bitcoin itself are suggesting an imminent storm. It is a battle between the long-term fundamental signal and the short-term technical noise, a dilemma that forces every market participant to ask themselves a critical question: In a world where the old rules are breaking down, do you trust the map or the compass?
Chapter 1: The Fall of a Titan - Deconstructing the Dollar's Demise
To understand the magnitude of Bitcoin’s long-term promise, one must first dissect the anatomy of the dollar’s current collapse. The U.S. Dollar Index, or DXY, is not merely a measure of the dollar against a single currency; it is a weighted average of its value relative to a basket of six major world currencies: the Euro, the Japanese Yen, the British Pound, the Canadian Dollar, the Swedish Krona, and the Swiss Franc. Its movement is a reflection of global confidence in the U.S. economy and its stewardship. For this index to suffer its worst crash since 1991 is a historic event. To be on pace for its worst year since 1973 is a paradigm-shifting crisis.
The year 1973 is not a random benchmark. It was the year the Bretton Woods system, which had pegged global currencies to the U.S. dollar (which was in turn pegged to gold), officially died. Its collapse ushered in the modern era of free-floating fiat currencies. For the dollar’s current performance to be compared to that chaotic, system-altering period is to say that the very foundations of the post-1973 monetary order are being shaken.
The catalysts for this historic weakness are rooted in a dramatic shift in American economic policy, largely attributed to the actions of President Donald Trump’s administration. The two primary drivers are a protectionist trade policy and a fiscal policy of burgeoning deficits.
First, the tariffs. The implementation of broad tariffs on imported goods was intended to protect domestic industries and renegotiate trade relationships. However, such measures are a double-edged sword for a nation's currency. They create friction in the intricate web of global supply chains, increase costs for consumers and businesses, and often invite retaliatory tariffs from trading partners. This environment of trade conflict creates economic uncertainty, which can deter foreign investment. When international capital becomes wary of deploying in a country, demand for that country’s currency wanes, putting downward pressure on its value.
Second, and perhaps more fundamentally, are the rising deficits. The U.S. government has been running massive budget deficits, spending far more than it collects in revenue. This debt must be financed. When a country runs a large budget deficit alongside a large current account deficit (importing more than it exports), it becomes heavily reliant on foreign capital to purchase its government bonds. If the world’s appetite for that debt falters, or if the sheer volume of new debt issuance becomes too large to absorb, the nation’s central bank may be implicitly forced to monetize the debt—effectively printing new money to buy the bonds. This expansion of the money supply is the classic recipe for currency debasement.
The combination of trade protectionism and fiscal profligacy has created a perfect storm for the dollar. Global investors, looking at the rising deficits and the unpredictable trade environment, are beginning to question the long-term stability of the dollar as a store of value. This erosion of confidence is what is reflected in the DXY’s historic plunge. A weaker dollar makes U.S. exports cheaper and imports more expensive, but its most profound effect is on the global investment landscape. It forces a worldwide repricing of assets and sends a tidal wave of capital searching for alternatives that can preserve wealth in an era of fiat decay.
Chapter 2: The Digital Phoenix - Bitcoin's Long-Term Bull Case
In the world of finance, every action has an equal and opposite reaction. As the value of the world's primary reserve asset erodes, the value of its antithesis should, in theory, appreciate. Bitcoin is the dollar’s antithesis. Where the dollar’s supply is infinite and subject to the political whims of policymakers, Bitcoin’s supply is finite, transparent, and governed by immutable code. There will only ever be 21 million Bitcoin. This fundamental, mathematically enforced scarcity is the core of its value proposition.
The inverse correlation between the DXY and Bitcoin is one of the most powerful and intuitive relationships in the digital asset space. When the DXY falls, it signifies that the dollar is losing purchasing power relative to other major currencies. For investors around the globe, this means that holding dollars is a losing proposition. They begin to seek out assets that are not denominated in dollars and cannot be debased by the U.S. Federal Reserve. Bitcoin stands as the prime candidate for this capital flight. It is a non-sovereign, globally accessible, digital store of value that operates outside the traditional financial system. A falling dollar is therefore the strongest possible tailwind for Bitcoin, validating its very reason for existence.
This relationship transcends simple price mechanics; it is a philosophical and macroeconomic hedge. Owning Bitcoin is a bet against the long-term viability of the current debt-based fiat monetary system. The dollar’s crash, driven by deficits and monetary expansion, is not a flaw in the system; it is a feature of it. Bitcoin offers an escape hatch. It is a lifeboat for investors who see the iceberg of sovereign debt on the horizon.
This narrative is what has fueled the wave of institutional adoption that has defined the current market cycle. Sophisticated investors and corporations are not allocating to Bitcoin because they are speculating on short-term price movements. They are buying it as a long-term strategic reserve asset, a hedge against the very macroeconomic turmoil that the dollar’s crash represents. They see a world drowning in debt and a global reserve currency being actively devalued, and they are making a calculated, multi-generational bet on a system of verifiable digital scarcity. From this perspective, the long-term bull case for Bitcoin has never been clearer or more compelling. The dollar’s historic weakness is the ultimate validation of the Bitcoin thesis.
Chapter 3: The Ghost in the Machine - Bitcoin's Short-Term Technical Warning
If the story ended with the macro-economic picture, the path forward would be simple. But markets are not simple. They are a reflection of human psychology, a tapestry of fear and greed woven in real-time. While the fundamental, long-term story points resolutely upward, the short-term evidence, as read through the language of technical analysis, is painting a much darker picture.
Technical analysis operates on the principle that all known information, including the bullish macro fundamentals, is already reflected in an asset's price. It seeks to identify patterns and gauge market momentum to predict future movements. One of the most trusted tools for measuring momentum is the stochastic oscillator. It does not measure price or volume itself, but rather the speed and momentum of price changes. Think of it like a car's tachometer: it tells you not how fast you are going, but how hard the engine is working to maintain that speed.
The stochastic oscillator operates on a scale of 0 to 100. A reading above 80 is considered "overbought," suggesting the asset has moved up too quickly and the rally may be running out of steam. A reading below 20 is considered "oversold," suggesting a decline may be exhausted. The current technical analysis of Bitcoin’s chart reveals a deeply concerning signal from this indicator.
Despite the overwhelmingly bullish news of the dollar’s collapse, Bitcoin’s price momentum is reportedly waning. The stochastic oscillator is likely showing what is known as a "bearish divergence." This occurs when the price of an asset pushes to a new high, but the oscillator fails to do so, creating a lower high. This is a classic warning sign. It’s the market’s equivalent of a car’s engine sputtering and revving less intensely even as the driver pushes the accelerator to the floor. It suggests that the underlying buying pressure is weakening, that the rally is becoming exhausted, and that a reversal or significant correction may be imminent.
The technical forecast of a potential drop below the $100,000 level stems directly from this type of signal. It implies that the recent price strength is not supported by genuine momentum and that the market is vulnerable. Why would this happen when the fundamental news is so positive? There are several possibilities. Short-term traders who bought at lower prices may be taking profits. The market may be flushing out over-leveraged long positions, triggering a cascade of liquidations. Or, it could simply be the natural rhythm of a market. No asset moves up in a straight line. Even the most powerful bull trends require periods of consolidation and correction to shake out weak hands, build a stronger base of support, and gather energy for the next major advance. A pullback to below $100,000, while painful for those who bought at the top, could be a perfectly healthy and necessary event in the context of a much larger, multi-year bull market.
Chapter 4: Reconciling the Irreconcilable - The Investor's Dilemma
This great divergence presents every market participant with a profound dilemma, forcing a clear-eyed assessment of their own investment philosophy and time horizon. The market is speaking in two different languages simultaneously, and the message you hear depends on the language you choose to listen to.
For the long-term investor, the individual or institution with a five, ten, or twenty-year outlook, the story is clear. The historic crash of the U.S. dollar is the signal. It is the fundamental, world-altering event that confirms their thesis. The debasement of the world’s reserve currency is a generational opportunity to allocate capital to a superior, non-sovereign store of value. From this vantage point, the bearish reading on a short-term stochastic oscillator is, at best, irrelevant noise. It is the momentary turbulence felt on a flight destined for a much higher altitude. The strategy for this investor is one of conviction. They may choose to ignore the short-term dip entirely, or more likely, view it as a gift—a final opportunity to accumulate more of a scarce asset at a discount before the full force of the dollar’s crisis is felt in the market. Their actions are guided by the macro map, not the short-term compass.
For the short-term trader, the world looks entirely different. Their time horizon is measured in days, weeks, or months, not years. For them, the bearish divergence on the stochastic oscillator is the signal. The macro story of the dollar’s decline is merely the background context. Their primary concern is managing risk and capitalizing on immediate price swings. A warning of a potential drop below $100,000 is an actionable piece of intelligence. It might prompt them to take profits on existing long positions, hedge their portfolio with derivatives, or even initiate a short position to profit from the anticipated decline. Their survival depends on their ability to react to the compass of market momentum, regardless of the map’s ultimate destination.
The most sophisticated market participants, however, attempt to synthesize these two perspectives. They recognize that the long-term macro trend provides the overarching directional bias, while the short-term technicals provide the tactical roadmap for navigating that trend. Such an investor would maintain a core long position in Bitcoin, acknowledging the powerful tailwind of the dollar’s collapse. However, they would use the technical signals to actively manage their position and optimize their entries and exits. They might trim their position when the stochastic indicator signals overbought conditions, taking some profit off the table to reduce risk. They would then stand ready to redeploy that capital and add to their core holding when the technicals signal oversold conditions after the very correction they anticipated. This approach allows them to maintain their long-term conviction while respecting the short-term risks, blending the art of the trader with the discipline of the investor.
Conclusion: The Signal and the Noise
The financial markets are standing at a historic crossroads. The U.S. dollar, the sun around which the global monetary system has orbited for generations, is dimming. Its historic crash is a signal of the highest order, a fundamental warning that the era of unchallenged fiat dominance is facing its most serious test. This decay is creating a powerful gravitational pull toward assets defined by scarcity and sovereignty, with Bitcoin as the undisputed digital leader. This is the signal.
Simultaneously, the internal mechanics of the Bitcoin market are showing signs of short-term fatigue. The warnings from technical indicators like the stochastic oscillator are a reminder that no market is immune to the laws of gravity, that periods of profit-taking and consolidation are a natural and healthy part of any long-term advance. This is the noise.
The great challenge, and the great opportunity, for every investor today is to learn to distinguish between the two. The collapse of the dollar is a paradigm shift, while the potential drop in Bitcoin’s price is a cyclical correction. The former defines the destination; the latter describes the terrain along the way. The current divergence is a test of thesis, of timeframe, and of temperament. Those who are shaken out by the short-term noise will likely miss the long-term signal. But those who understand that the dollar’s fall is the very reason for Bitcoin’s rise, and who have the conviction to see the short-term turbulence for what it is, will be best positioned to navigate this great divergence and witness the dawn of a new financial landscape.

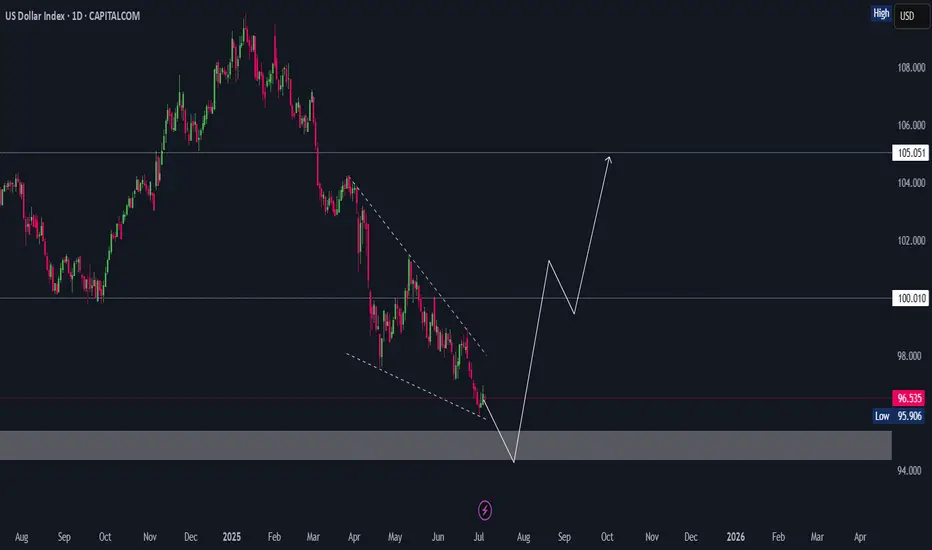
dollar elliott wave countingdxy is falling since it peaked in Q4 2022
since their last 75bps hike dollar is constantly falling and stocks, gold, bitcoin constantly rising and making new all time high
wave W = wave Y
(equal in length, 100% projection for wave Y)
since starting of the year due to trump tariff dollar is falling
this is year in first half dollar saw biggest collapse since end of gold standard
now 100% projection target for wave Y at 95 area is big static support level
if dxy recover back to 100 area then this will be first sign of reversal


Dollar Index Bearish to $96The DXY has been in a downtrend for a while & that bearish pressure is not over yet. I expect more bearish downside towards the $96 zone, before we can re-analyse the market for any signs of bullish takeover.
⭕️Major Wave 3 Impulse Move Complete.
⭕️Major Wave 4 Corrective Move Complete.
⭕️Minor 4 Waves of Major Wave 5 Complete, With Minor Wave 5 Yet Pending.

Whats the Play for the week? Are we bullish?Looking for more bullish activity to continue. Just need to see price confirm if it is indeed ready to proceed. if we can find a solid entry we will rock with it. but not trying to force anything.

Economic Red Alert: China Dumps $8.2T in US BondsThe Great Unwinding: How a World of Excess Supply and Fading Demand Is Fueling a Crisis of Confidence
The global financial system, long accustomed to the steady hum of predictable economic cycles, is now being jolted by a dissonant chord. It is the sound of a fundamental paradigm shift, a tectonic realignment where the twin forces of overwhelming supply and evaporating demand are grinding against each other, creating fissures in the very bedrock of the world economy. This is not a distant, theoretical threat; its tremors are being felt in real-time. The most recent and dramatic of these tremors was a stark, headline-grabbing move from Beijing: China’s abrupt sale of $8.2 trillion in U.S. Treasuries, a move that coincided with and exacerbated a precipitous decline in the U.S. dollar. While the sale itself is a single data point, it is far more than a routine portfolio adjustment. It is a symptom of a deeper malaise and a powerful accelerant for a crisis of confidence that is spreading through the arteries of global finance. The era of easy growth and limitless demand is over. We have entered the Great Unwinding, a period where the cracks from years of excess are beginning to show, and the consequences will be felt broadly, from sovereign balance sheets to household budgets.
To understand the gravity of the current moment, one must first diagnose the core imbalance plaguing the global economy. It is a classic, almost textbook, economic problem scaled to an unprecedented global level: a glut of supply crashing against a wall of weakening demand. This imbalance was born from the chaotic response to the COVID-19 pandemic. In 2020 and 2021, as governments unleashed trillions in fiscal stimulus and central banks flooded the system with liquidity, a massive demand signal was sent through the global supply chain. Consumers, flush with cash and stuck at home, ordered goods at a voracious pace. Companies, believing this trend was the new normal, ramped up production, chartered their own ships, and built up massive inventories of everything from semiconductors and furniture to automobiles and apparel. The prevailing logic was that demand was insatiable and the primary challenge was overcoming supply-side bottlenecks.
Now, the bullwhip has cracked back with a vengeance. The stimulus has faded, and the landscape has been radically altered by the most aggressive coordinated monetary tightening in modern history. Central banks, led by the U.S. Federal Reserve, hiked interest rates at a blistering pace to combat the very inflation their earlier policies had helped fuel. The effect has been a chilling of economic activity across the board. Demand, once thought to be boundless, has fallen off a cliff. Households, their pandemic-era savings depleted and their purchasing power eroded by stubborn inflation, are now contending with cripplingly high interest rates. The cost of financing a home, a car, or even a credit card balance has soared, forcing a dramatic retrenchment in consumer spending. Businesses, facing the same high borrowing costs, are shelving expansion plans, cutting capital expenditures, and desperately trying to offload the mountains of inventory they accumulated just a year or two prior.
This has created a world of profound excess. Warehouses are overflowing. Shipping rates have collapsed from their pandemic peaks. Companies that were once scrambling for microchips are now announcing production cuts due to a glut. This oversupply is deflationary in nature, putting immense downward pressure on corporate profit margins. Businesses are caught in a vise: their costs remain elevated due to sticky wage inflation and higher energy prices, while their ability to pass on these costs is vanishing as consumer demand evaporates. This is the breeding ground for the "cracks" that are now becoming visible. The first casualties are the so-called "zombie companies"—firms that were only able to survive in a zero-interest-rate environment by constantly refinancing their debt. With borrowing costs now prohibitively high, they are facing a wave of defaults. The commercial real estate sector, already hollowed out by the work-from-home trend, is buckling under the weight of maturing loans that cannot be refinanced on favorable terms. Regional banks, laden with low-yielding, long-duration bonds and exposed to failing commercial property loans, are showing signs of systemic stress. The cracks are not isolated; they are interconnected, threatening a chain reaction of deleveraging and asset fire sales.
It is against this precarious backdrop of a weakening U.S. economy and a global supply glut that China’s sale of U.S. Treasuries must be interpreted. The move is not occurring in a vacuum. It is a calculated action within a deeply fragile geopolitical and economic context, and it carries multiple, overlapping meanings. On one level, it is a clear continuation of China’s long-term strategic objective of de-dollarization. For years, Beijing has been wary of its deep financial entanglement with its primary geopolitical rival. The freezing of Russia’s foreign currency reserves following the invasion of Ukraine served as a stark wake-up call, demonstrating how the dollar-centric financial system could be weaponized. By gradually reducing its holdings of U.S. debt, China seeks to insulate itself from potential U.S. sanctions and chip away at the dollar's status as the world's undisputed reserve currency. This $8.2 trillion sale is another deliberate step on that long march.
However, there are more immediate and tactical motivations at play. China is grappling with its own severe economic crisis. The nation is battling deflation, a collapsing property sector, and record-high youth unemployment. In this environment, its primary objective is to stabilize its own currency, the Yuan, which has been under intense downward pressure. A key strategy for achieving this is to intervene in currency markets. Paradoxically, this intervention often requires selling U.S. Treasuries. The process involves the People's Bank of China selling its Treasury holdings to obtain U.S. dollars, and then selling those dollars in the open market to buy up Yuan, thereby supporting its value. So, while the headline reads as an attack on U.S. assets, it is also a sign of China's own domestic weakness—a desperate measure to defend its own financial stability by using its vast reserves.
Regardless of the primary motivation—be it strategic de-dollarization or tactical currency management—the timing and impact of the sale are profoundly significant. It comes at a moment of peak vulnerability for the U.S. dollar and the Treasury market. The dollar has been extending massive losses not because of China’s actions alone, but because the underlying fundamentals of the U.S. economy are deteriorating. Markets are increasingly pricing in a pivot from the Federal Reserve, anticipating that the "cracks" in the economy will force it to end its tightening cycle and begin cutting interest rates sooner rather than later. This expectation of lower future yields makes the dollar less attractive to foreign investors, causing it to weaken against other major currencies.
China’s sale acts as a powerful accelerant to this trend. The U.S. Treasury market is supposed to be the deepest, most liquid, and safest financial market in the world. It is the bedrock upon which the entire global financial system is built. When a major creditor like China becomes a conspicuous seller, it sends a powerful signal. It introduces a new source of supply into a market that is already struggling to absorb the massive amount of debt being issued by the U.S. government to fund its budget deficits. This creates a dangerous feedback loop. More supply of Treasuries puts downward pressure on their prices, which in turn pushes up their yields. Higher Treasury yields translate directly into higher borrowing costs for the entire U.S. economy, further squeezing households and businesses, deepening the economic slowdown, and increasing the pressure on the Fed to cut rates, which in turn further weakens the dollar. China’s action, therefore, pours fuel on the fire, eroding confidence in the very asset that is meant to be the ultimate safe haven.
The contagion from this dynamic—a weakening U.S. economy, a falling dollar, and an unstable Treasury market—will not be contained within American borders. The cracks will spread globally, creating a volatile and unpredictable environment for all nations. For emerging markets, the situation is a double-edged sword. A weaker dollar is traditionally a tailwind for these economies, as it reduces the burden of their dollar-denominated debts. However, this benefit is likely to be completely overshadowed by the collapse in global demand. As the U.S. and other major economies slow down, their demand for raw materials, manufactured goods, and services from the developing world will plummet, devastating the export-driven models of many emerging nations. They will find themselves caught between lower debt servicing costs and a collapse in their primary source of income.
For other developed economies like Europe and Japan, the consequences are more straightforwardly negative. A rapidly falling dollar means a rapidly rising Euro and Yen. This makes their exports more expensive and less competitive on the global market, acting as a significant drag on their own already fragile economies. The European Central Bank and the Bank of Japan will find themselves in an impossible position. If they cut interest rates to weaken their currencies and support their exporters, they risk re-igniting inflation. If they hold rates firm, they risk allowing their currencies to appreciate to levels that could push their economies into a deep recession. This currency turmoil, originating from the weakness in the U.S., effectively exports America’s economic problems to the rest of the world.
Furthermore, the instability in the U.S. Treasury market has profound implications for every financial institution on the planet. Central banks, commercial banks, pension funds, and insurance companies all hold U.S. Treasuries as their primary reserve asset. The assumption has always been that this asset is risk-free and its value is stable. The recent volatility and the high-profile selling by a major state actor challenge this core assumption. This forces a global repricing of risk. If the "risk-free" asset is no longer truly risk-free, then the premium required to hold any other, riskier asset—from corporate bonds to equities—must increase. This leads to a tightening of financial conditions globally, starving the world economy of credit and investment at the precise moment it is most needed.
In conclusion, the abrupt sale of $8.2 trillion in U.S. Treasuries by China is far more than a fleeting headline. It is a critical data point that illuminates the precarious state of the global economy. It is a manifestation of the Great Unwinding, a painful transition away from an era of limitless, debt-fueled demand and toward a new reality defined by excess supply, faltering consumption, and escalating geopolitical friction. The underlying cause of this instability is the deep imbalance created by years of policy missteps, which have left the world with a glut of goods and a mountain of debt. The weakening U.S. economy and the resulting slide in the dollar are the natural consequences of this imbalance. China’s actions serve as both a symptom of this weakness and a catalyst for a deeper crisis of confidence in the U.S.-centric financial system. The cracks are no longer hypothetical; they are appearing in the banking sector, in corporate credit markets, and now in the bedrock of the system itself—the U.S. Treasury market. The tremors from this shift will be felt broadly, ushering in a period of heightened volatility, economic pain, and a fundamental reordering of the global financial landscape.

Fundamental Market Analysis for June 30, 2025 USDJPYThe USD/JPY pair is attracting some sellers towards 143.85 during the Asian session on Monday. The U.S. dollar (USD) is weakening against the Japanese yen (JPY) amid rising bets for a Federal Reserve (Fed) interest rate cut.
The United States (US) and China are close to a deal on tariffs. However, U.S. President Donald Trump abruptly ended trade talks with Canada, adding uncertainty to the market's positive outlook.
In addition, traders are betting that the U.S. central bank will cut rates more frequently and possibly sooner than previously expected. Markets estimate the probability of a quarter-point Fed rate cut at nearly 92.4%, up from 70% a week earlier.
On the data side, the personal consumption expenditure (PCE) price index rose 2.3% in May, up from 2.2% in April (revised from 2.1%), the U.S. Bureau of Economic Analysis reported Friday. This value matched market expectations. Meanwhile, the core PCE price index, which excludes volatile food and energy prices, rose 2.7% in May, following a 2.6% increase (revised from 2.5%) seen in April.
On the other hand, the Bank of Japan's (BoJ) cautious stance on interest rate hikes could put pressure on the yen and create a tailwind for the pair.
Trade recommendation: SELL 143.50, SL 144.30, TP 142.40

Will Gold Break out for the New Month this week?I was anticipating these possible sweeps. with it being the end of the month I'm thinking I might need to do more watching for now than positioning. waiting for the market to show its hand on what it wants to do next.

DXY BANK VAULT BREAK-IN: Your Dollar Index Profit Blueprint🚨 DXY BANK HEIST: Dollar Index Breakout Robbery Plan (Long Setup) 🚨
🌟 Hi! Hola! Ola! Bonjour! Hallo! Marhaba! 🌟
Attention, Market Robbers & Dollar Bandits! 🏦💰💸
Using the 🔥Thief Trading Style🔥, we’re plotting a DXY (Dollar Index) bank heist—time to go LONG and escape near the ATR danger zone. Overbought? Yes. Risky? Absolutely. But the real robbery happens when weak hands panic. Take profits fast—you’ve earned this loot! 🏆💵
📈 ENTRY: BREAKOUT OR GET LEFT BEHIND!
Wait for DXY to cross 99.300 → Then strike hard!
Buy Stop Orders: Place above Moving Average.
Buy Limit Orders: Sneak in on 15M/30M pullbacks (swing lows/highs).
Pro Tip: Set a BREAKOUT ALARM—don’t miss the heist!
🛑 STOP LOSS: DON’T GET LOCKED UP!
For Buy Stop Orders: Never set SL before breakout—amateurs get caught!
Thief’s Safe Spot: Nearest swing low (2H chart).
Rebels: Place SL wherever… but your funeral! ⚰️
🏴☠️ TARGET: 102.300 (Bank Vault Cracked!)
Scalpers: Long only! Trail your SL like a pro thief.
Swing Traders: Ride this heist for maximum payout.
💵 MARKET CONTEXT: DXY IS BULLISH (But Traps Await!)
Fundamentals: COT Reports, Fed Plays, Geopolitics.
Intermarket Sentiment: Bonds, Gold, Stocks—all connected.
Full Analysis: Check our bio0 linkks 👉🔗 (Don’t trade blind!).
⚠️ ALERT: NEWS = VOLATILITY = TRAP ZONE!
Avoid new trades during high-impact news.
Lock profits with trailing stops—greed gets you caught!
💥 SUPPORT THE HEIST (OR GET LEFT BROKE!)
Smash that Boost Button 💖→ Stronger team = bigger scores!
Steal profits daily with the Thief Trading Style. 🎯🚀
Next heist coming soon… stay ready! 🤑🐱👤🔥
