USDCHF - Important BreakoutHello Traders !
The USDCHF price formed a rectangle pattern
Currently, The resistance level is broken.
So, I expect a bullish move📈
----------------
TARGET: 0.86500🎯
Dollar

USDCHF: Support & Resistance Analysis 🇺🇸🇨🇭
Here is my latest structure analysis for USDCHF.
Resistance 1: 0.8608 - 0.8630 area
Resistance 2: 0.8728 - 0.8747 area
Support 1: 0.8559 - 0.8562 area
Support 2: 0.8500 - 0.8544 area
Support 3: 0.8374 - 0.8404 area
Consider these structures for pullback/breakout trading.
❤️Please, support my work with like, thank you!❤️

Goatseus Maximus is meme NO.1 for this bull run! TA+TRADE PLAN🚀🚀🚀 MEMECOIN No.1 FOR THIS BULLRUN 🚀🚀🚀
Goatseus Maximus is primed to be the KING OF MEME COINS this season! With a powerful symmetrical triangle pattern, an incoming breakout, and massive hype potential, GOATSEUS MAXIMUS is set to dominate the market. This coin isn’t just riding the meme wave—it’s about to surf it to HUGE GAINS! 🌊💎
Get ready for the next big thing in crypto. With strong technicals, an upcoming bullish breakout, and a dedicated community, GOATSEUS MAXIMUS is about to hit the moon! Don’t miss the ride of a lifetime! 🌕✨
Goatseus Maximus is forming a symmetrical triangle pattern during an overall uptrend, a continuation pattern that often precedes a breakout in the direction of the prevailing trend. In this case, given the prior upward momentum, the odds are in favor of a bullish breakout.
Key Technical Insights:
Symmetrical Triangle: The price has been consolidating within the triangle, making higher lows and lower highs. This signals market indecision, but as the triangle narrows, an imminent breakout is expected.
Volume Spike: The volume shows a notable increase (175.9K), a positive signal that a strong move may follow soon, potentially confirming the breakout direction.
Indicators:
RSI (Relative Strength Index): At 54.21, the RSI suggests the coin is in a neutral zone, with more room for an upside move before hitting overbought territory.
Stochastic Oscillator: Sitting at 57.79, it shows momentum is gradually turning positive, which aligns with a potential breakout to the upside.
Support and Resistance Zones:
Support: The orange zone between $0.08 - $0.10 acts as a solid support area where buyers could step in.
Resistance: The current resistance levels are projected near $0.16 and $0.20. A breakout from the triangle could push the price toward these levels.
Trading Plan:
Entry Strategy:
Enter long on a confirmed breakout above the upper trendline of the triangle (above $0.14 - $0.15). Ensure that volume supports the breakout to avoid a false move.
Consider setting a pending buy order slightly above the triangle resistance line at $0.1505 to catch the breakout early.
Stop Loss:
Place a stop loss just below the lower trendline of the triangle (around $0.105) to protect against invalidation of the pattern.
Alternatively, if the price breaks below the support zone near $0.08, consider exiting, as this would signal bearish momentum.
Profit Targets:
First Target: $0.18, aligning with the next significant resistance zone.
Second Target: $0.24, based on the measured move from the base of the triangle, offering a strong risk-to-reward ratio.
Risk Management:
Ensure that the position size adheres to a 2-3% risk of your total portfolio.
Monitor volume and price action closely for any signs of reversal after a breakout.

EURUSD - 4H Bullish signsThe OANDA:EURUSD pair is currently positioned for potential bullish momentum, especially as the weakening of the US dollar becomes more evident. Technically, the EURUSD is showing signs of recovery, as the downward momentum appears to be weakening, and the price has reached a strong support zone. The recent decline in the USD due to a softer US jobs report, coupled with expectations of dovish action from the Federal Reserve, provides further support for a possible upward move in FX:EURUSD .
Additionally, with the European Central Bank (ECB) expected to take further action, possibly through a rate cut in mid-October, market sentiment around the Euro remains cautiously optimistic. If the pair breaks above the next resistance levels, the outlook for a continued rise seems strong, as the price aims for 1.1010 or higher. This aligns well with the technical analysis, where the support zone indicates a potential bounce in the coming sessions.

DXY - Dollar Index 4H bearish setupThe TVC:DXY is showing potential for a bearish reversal after its recent rise. Technically, DXY has bounced back to a key resistance zone after a major fall, reaching the order block from the last leg down. The failure to break significantly higher from this resistance suggests the possibility of another downward move. Liquidity grabs above the resistance zone further support this bearish outlook. However, a small bounce within the resistance zone before another fall is still possible as liquidity is gathered from the upside.
Fundamentally, several factors are influencing the bearish sentiment for the USD. The Federal Reserve’s ongoing easing cycle and the potential for further interest rate cuts weaken the dollar, especially as inflation pressures remain subdued. Other central banks, including the ECB, have cut rates, increasing the interest rate gap with the USD, which could further reduce demand for the dollar

USDJPY - 4H Sell SetupFX:USDJPY is displaying a clear technical setup for a bearish move. After a significant pullback following a sharp fall, the pair failed to surpass the resistance zone around 149. This area has proven strong as the price action was unable to hold above it, trapping liquidity just above the resistance. The price then rejected this zone with a sharp reversal. Additionally, the second attempt to break through the resistance further confirms the weakness, as liquidity hunting above the resistance has been met with selling pressure. This rejection, combined with the failed breakout, suggests the pair is likely to fall towards the lower targeted support zone, potentially setting up a strong shorting opportunity in the near term.
This aligns with fundamental factors, including expectations of slower rate cuts by the Federal Reserve. Meanwhile, Japan faces a cautious stance on raising interest rates, which has kept the yen under pressure. However, recent economic data from Japan, such as rising producer prices and decreased lending activity, suggests a shift may be underway, supporting further yen strength and a potential fall in USDJPY.
Traders should watch for a continuation of this move, as the failed attempts to breach resistance and the liquidity grab signal further downside pressure.

USD/JPY – Breakout of Resistance TrendlineWe have just broken out of the resistance trendline on USD/JPY. If you're currently short, I recommend reducing your position as the price approaches the green zone.
For those without a position, it might be wise to wait for the price to reach this green zone before considering a long entry. However, always wait for confirmation before entering long positions to ensure a higher probability of success.

Dollar Index Bullish to $109!I am looking for a 3 Sub-Wave correction into $109 for 2025.
I believe this'll be fuelled by the U.S. elections. Donald Trump will be selected as the next puppet to run the U.S. economy. His 'MAGA (Make America Great Again' phase will push liquidity into the US Dollar. This is how I think the market will reach $109.

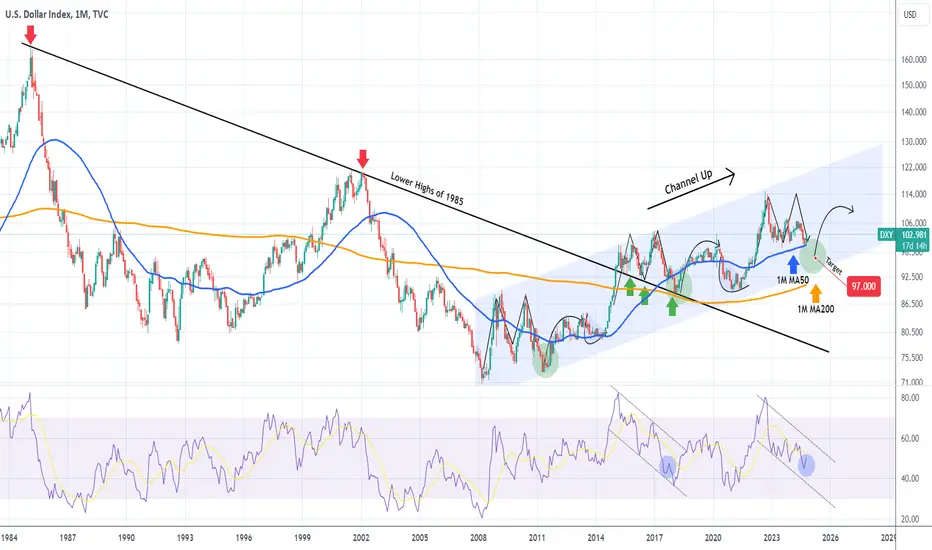
DXY Rebounding on the 1M MA50. But for how long?The U.S. Dollar index (DXY) is on a strong green 1M candle, already halfway through the month of October, as it is rebounding after making an exact test of the 1M MA50 (blue trend-line), the long-term Support.
On this chart we can see the DXY's multi-year price action. Even though it was on a heavy downtrend since the February 1985 High, it managed to break above it in January 2015 and sustain a strong Channel Up, coming off the March 2008 bottom of the disastrous Housing Crisis.
Within this strong Channel Up, we see a repeated pattern as long as Bullish and Bearish Legs are concerned. As you can see, the bottoms have been formed significantly below the 1M MA50, so this indicates that it is not time to buy yet.
If anything, a controlled short is justified and as we get closer to the bottom of the Channel Up, start buying on a multi-year basis (as long as the 1M MA200 (orang trend-line) holds). Based on the 1M RSI, where the similarities with the previous Leg are more obvious, we should be around levels similar to October 2017, so starting next month or December, we should start resuming the downtrend and a 'modest' level to target is 97.000.
-------------------------------------------------------------------------------
** Please LIKE 👍, FOLLOW ✅, SHARE 🙌 and COMMENT ✍ if you enjoy this idea! Also share your ideas and charts in the comments section below! This is best way to keep it relevant, support us, keep the content here free and allow the idea to reach as many people as possible. **
-------------------------------------------------------------------------------
💸💸💸💸💸💸
👇 👇 👇 👇 👇 👇
EURUSD: Key Support & Resistance Levels For Next Week 🇪🇺🇺🇸
Here is my latest structure analysis for EURUSD for next week.
Resistance 1: 1.0950 - 1.0970 area
Resistance 2: 1.0996 - 1.1012 area
Resistance 3: 1.1070 - 1.1110 area
Resistance 4: 1.1190 - 1.1215 area
Support 1: 1.0880 - 1.0916 area
Support 2: 1.0777 - 1.0792 area
Consider these structures for pullback/breakout trading.
❤️Please, support my work with like, thank you!❤️

#EURUSD 1.093 and prior gaps1.618 = 1.093
now we have channel and upside reciprocal target.
wouldn't be surprised if price smashed April 2017 gap up first though.

DXY: A Bullish Outlook for the USDThe US Dollar Index (DXY), a critical gauge of the dollar's performance against a basket of major currencies, recently encountered a significant demand area at 100.53. This pivotal point has historically acted as a fulcrum, influencing the currency's trajectory. Interestingly, this interaction coincides with a notable downturn in the commitment of traders (COT) report for retail traders, suggesting a pivotal shift in market sentiment.
Retail Traders Retreat Amidst Bullish Signals
Retail traders, often seen as contrarian indicators, have shown a marked decrease in their positions at this juncture, reaching notably low levels. This trend typically suggests a lack of confidence among smaller market participants, which can often precede a reversal when combined with other factors. It's crucial to consider these dynamics within the broader context of market sentiment and economic indicators.
Institutional Insights: Fund Managers and Commercials Buying the Dip
Conversely, the behavior of more significant market players such as fund managers and commercial traders provides a stark contrast. Fund managers have maintained or increased their bullish positions, demonstrating a robust confidence in the strength of the USD. Simultaneously, commercial traders, known for their strategic depth and market knowledge, have started accumulating positions, "buying the dip." This accumulation by commercials is often a reliable indicator of foundational strength in the market, suggesting that these savvy traders anticipate a forthcoming rise in the dollar's value.
Technical and Seasonal Factors Align for a Bullish Scenario
From a technical perspective, the DXY has shown signs of being oversold. When a financial instrument reaches such conditions, it often suggests that the selling momentum might be overextended, priming the market for a bullish reversal. This technical signal, in conjunction with the identified demand area, provides a compelling case for an impending upward movement.
Moreover, seasonality also plays a critical role in the dynamics of currency markets. Historical data and patterns can influence trader expectations and market movements significantly. For the DXY, seasonal trends around this time of year have frequently aligned with strengthening trends, reinforcing the current analysis that an uptick could be on the horizon.
Looking Forward: A Bullish Forecast for the USD
Considering these multifaceted insights—from the COT data illustrating a shift away from retail bullishness to the strategic accumulations by institutional players, and the supportive technical and seasonal indicators—the stage is set for a potential long-term increase in the value of the USD. Traders and investors would be wise to monitor these developments closely, as the confluence of these factors could lead to significant opportunities in the forex markets.
The current landscape of the DXY presents a textbook scenario where understanding the interplay between different trader behaviors and technical indicators can provide a strategic advantage. As we move forward, keeping a pulse on these shifts will be crucial for capitalizing on the anticipated upward trajectory of the USD.
✅ Please share your thoughts about DXY in the comments section below and HIT LIKE if you appreciate my analysis. Don't forget to FOLLOW ME; you will help us a lot with this small contribution.

DXY Index Sees Setback Amid Soft Labor and Inflation Data but..The US Dollar Index (DXY) experienced daily losses yesterday, following the release of softer-than-expected labor and inflation data. Despite these immediate setbacks, the broader outlook for the US economy remains positive, with recent indicators highlighting a level of growth that continues to exceed forecasts. The market’s reaction to the data, however, has raised questions about whether current valuations are overly optimistic.
From a technical standpoint, the US Dollar is still trading above a key supply area, where we initiated a bullish position. This level has proven to be a crucial support zone, and as long as the price remains above it, the outlook continues to favor further gains. The recent dip in the DXY may have been triggered by weaker-than-anticipated data, but the underlying strength of the US economy suggests that this could be a temporary correction rather than a reversal of the broader uptrend.
On the economic front, the US economy is still performing robustly. Recent data reveals that growth is outpacing expectations, driven by resilient consumer spending and stable industrial output. While the labor and inflation numbers may have cooled market sentiment in the short term, they are unlikely to derail the broader trend of economic expansion.
With this strong economic backdrop, we maintain our bullish stance on the US Dollar. The softer data is not enough to overshadow the ongoing strength of the US economy, and we anticipate further upside potential for the dollar in the weeks ahead. While market valuations may currently reflect some degree of optimism, the fundamental outlook supports the case for continued appreciation in the US Dollar Index.
As traders and investors weigh the short-term data against long-term trends, it is crucial to stay mindful of key technical levels and economic indicators. The recent pullback in the DXY may present an opportunity to reinforce bullish positions, particularly if the dollar continues to hold above critical support areas. Overall, we remain confident in the strength of the US Dollar and expect further gains as economic conditions evolve.
✅ Please share your thoughts about DXY in the comments section below and 👍 HIT LIKE if you appreciate my analysis. Don't forget to FOLLOW ME; you will help us a lot with this small contribution.

Hotter-than-Expected CPI Prints: A Potential Catalyst for DXY an
Introduction
The release of Consumer Price Index (CPI) data is a highly anticipated event in financial markets, often influencing investor sentiment, currency valuations, and risk appetite. A hotter-than-expected CPI print, indicating higher-than-anticipated inflation, has significant implications for monetary policy decisions, particularly interest rate cuts. This article explores how such a scenario could strengthen calls to halt or even reverse rate cuts, potentially bolstering the US Dollar Index (DXY) and leading to increased risk aversion.
Understanding CPI and Its Impact on Monetary Policy
CPI is a measure of the average change over time in the price of a basket of goods and services consumed by households. It is a key indicator of inflation, which central banks closely monitor to assess the overall health of an economy. When CPI rises above the target inflation rate, it suggests that prices are increasing at a faster pace than desired, potentially eroding purchasing power and destabilizing the economy.
Central banks often use interest rates as a tool to manage inflation. By raising interest rates, they make borrowing more expensive, which can slow down economic activity and reduce demand for goods and services, ultimately putting downward pressure on prices. Conversely, lowering interest rates can stimulate economic growth but may also lead to higher inflation if demand outpaces supply.
The Implications of a Hotter-than-Expected CPI Print
If a CPI report comes in hotter than expected, it suggests that inflation is running higher than anticipated. This could lead to increased concerns among central bankers and investors about the potential for inflation to spiral out of control. In response, central banks may feel compelled to pause or even reverse their monetary easing policies.
The prospect of higher interest rates can have a significant impact on financial markets. When central banks raise interest rates, it often leads to a stronger domestic currency relative to other currencies. This is because higher interest rates make the domestic currency more attractive to investors seeking higher returns on their investments.
In the case of the US Dollar, a stronger DXY can have implications for global financial markets. A stronger dollar can make imports cheaper for US consumers but can also make exports more expensive for US businesses, potentially hurting economic growth. Additionally, a stronger dollar can put downward pressure on commodity prices, which can impact the profitability of commodity-producing countries and industries.
The Potential Impact on Risk Aversion
A hotter-than-expected CPI print and the subsequent tightening of monetary policy can also lead to increased risk aversion among investors. When investors become more cautious about the outlook for the economy, they may be less willing to take on riskier investments, such as stocks and emerging market bonds. This can lead to a sell-off in these asset classes, as investors seek to shift their portfolios to safer, more liquid assets like US Treasury bonds.
Conclusion
A hotter-than-expected CPI print can have significant implications for financial markets, particularly if it leads to a change in monetary policy. By strengthening calls to halt or reverse rate cuts, such a scenario could bolster the US Dollar Index and increase risk aversion. Investors should closely monitor CPI releases and their potential impact on central bank decisions and market sentiment.

Armageddon after the election, huh?Someone yesterday dumped a lot of money into an options portfolio, that's designed to lower the price of December US10-year Bond futures. That automatically means more US 10Y yield, and since there's a strong correlation with the Dollar, it also means the Dollar is going up.
The most curious thing is watching how the S&P 500 makes ATH during rising Dollar.
Such synchronicity has historically led to powerful corrections, and something tells me that it will not be the Dollar.
Now, I ain't saying we should all go out and start selling stocks like never before. But what I am sayin' is that maybe, just maybe, we should take a step back and look at the bigger picture. Maybe the market's got some more room to run, and maybe we should be lookin' for opportunities to get in on the action.
So, yeah, the option sentiment's looking a little bearish, but that don't mean we should all be running for the hills just yet.
Let's keep our cool, do our research, and see what the market's got in store for us.

DXY sellUS dollar had a blasting week this time now as we have traded its upward rally now its moving towards its resistance level where from it will be moving downward rally👇 from its resistance level on H1 we can see a Fair value gap under the price rallied so we will be bearish until it fills its GAP now if we talk about H4 and Daily price is bearish from Daily Time frame so we are bearish this time until fair value gap

NZDUSD: Very Bearish Outlook 🇳🇿🇺🇸
NZDUSD broke and closed below a key daily horizontal support.
With a high probability, it turned into resistance.
We can anticipate a bearish movement from that.
Next support - 0.599
❤️Please, support my work with like, thank you!❤️

Dollar Index (DXY) levels to watch ahead of CPIShortly, US CPI will be released at 8:30am EDT or 13:30 BST.
Headline CPI is expected to print +0.1% m/m and +2.3% y/y (vs. 2.5% last)
Core CPI is seen at +0.2% or +3.2% y/y (unchanged from prev reading).
The inflation data will need to be some distance away from expectations to change the course of the dollar, which has been on the rise in the last week and a half.
Following last week’s formation of big bullish engulfing candle on the weekly chart, the dollar index has remined on the front foot so far this week, amid continued buying of the dollar thanks to that big beat on the NFP data.
At the time of writing, the DXY was holding comfortably above the broken bearish trend and support in the 101.90-102.15 region.
It was also above short-term support around 102.65-70 area, which is now the first line of defense for the bulls. They will need to defend this level to keep the bullish momentum alive.
The next big area of resistance is still quite far around 103.65 to 104.00 (where the 200-day average meets a former pivotal zone), meaning there is further room for the dollar rally before it potentially fades.
By Fawad Razaqzada, market analyst with FOREX.com

DXY H1 - Short before longDXY H1
Very good morning all, here is our update on the dollar index, last week we saw bulls storm the markets following various different data points. The bull run has sustained and Mondays trading session saw indecisive price movement in the form of consolidation. We are looking like we want to break to the downside.
Slowly, but hopefully surely we start to see price pull down towards our anticipated buy zone of around 101.850 price, this is where we would find support amongst a few timeframes, aligning with our confluence zone. Same bias as yesterday, until we see a break of this area of consolidation.


Sellers unable to push USDCHF below 0.84; possible upward move?The U.S. dollar to Swiss franc currency pair (USD/CHF) had been trading sideways above a key support level on the daily chart, marking the lowest price since 2015. In addition, a double bottom pattern has formed, signaling that sellers have been unable to continue pushing the price below 0.8400.
On Friday, Oct. 4, the USDCHF broke out of its sideways pattern on the daily chart, indicating potential buying momentum. A possible upward movement could take the price to the 0.8800 level in a few days.
Hot US jobs report, lower-than-expected unemployment favours the dollar
From a macroeconomic standpoint, Friday’s US nonfarm payroll (NFP) data came in well above expectations (254,000 actual vs. 147,000 forecast), pointing to a robust labor market with potential incoming growth over the coming months, which tends to favor the USD.
The NFP data also appears to have led markets to price out expectations of an outsized 50-basis-point interest rate by the Federal Reserve at its upcoming meeting — which could have led to more weakening in the US dollar.
The dollar has also benefited from safe-haven flows amidst rising tensions in the Middle East, with the IDF starting ground operations in Lebanon and Iran unleashing a large-scale ballistic missile attack on Israel for the second time.
Therefore, from a technical standpoint, we can observe the following:
USD/CHF at its lowest level since 2015.
Formation of a double bottom on the daily chart.
Sideways movement above support.
Friday's breakout indicating a potential uptick in buying activity.
From a macroeconomic standpoint, the following factors are in play:
NFP data surpassed expectations (254,000 actual vs. 147,000 forecast).
Unemployment rate came in lower than expected (4.1% actual vs. 4.2% forecast).
Together, these factors suggest that USD/CHF could appreciate, potentially reaching 0.8800 in the near term.
Disclaimer:
74% of retail investor accounts lose money when trading CFDs with this provider. You should consider whether you understand how CFDs work and whether you can afford to take the high risk of losing your money. Past performance is not necessarily indicative of future results. The value of investments may fall as well as rise and the investor may not get back the amount initially invested. This content is not intended for nor applicable to residents of the UK.

How Much More Longer BearishOn this pair, we find that on the weekly timeframe, the market is Bullish. Price even went all the way up towards our liquidity target but failed to close above it. We are currently witnessing another pullback.
On the Daily, price is bullish. We have seen prices currently retrace into the daily zone.
But there is a lot of speculation as to whether or not this our refined daily reversal zone has what it takes to invite the bulls of demand to hold prices at that level and drive it back up.
Now my Analysis:
As much as I would want the daily zone to hold, as this is the fastest way for us to find a LONG trading opportunity, jumping on the rally towards the confluence weekly/daily liquidity targets. But I have a bit of reservation on this. This is because of the force with which prices have come into the daily reversal zone. Prices have come into the zone with a strong push, and not the usual gentle slide in expected of a reversal zone. Dont get me wrong, I am not concluding that the zone will fail, but rather I am saying that instead of the initial 70% chance I had of the zone holding, I now have a 40% chance of it holding because of price action.
In the event that the zone holds, we will expect to see the rally resume with prices gravitating towards our liquidity target above; and we will excitedly pull out out panzy pips trading system and jump on the trade.
But what happens if the zone fails..?
Where this is the case, we will look to see prices deep further towards the Weekly zone below. From where we will look to see some bullish reversal and again place our trade setup right beside price and stand ready to trade.
In all of these, we do not and cannot completely rule out the possibility of catching some bearish trades where the daily zone is breached and price dips towards the Weekly zone.
Share your thoughts guys and let us see your perspective on the market

Are The Bulls Still Up To IT?On this pair, we see that the Weekly chart is ready to resume its long held bearishness. Over the past few days, we have witnessed prices rally all the way up (a Bullish retracement inside a bearish swing), driving prices into our marked out Weekly reversal zone. As expected, the zone held, and we began to see reversals, with prices turning bearish from that point.
But the thing is this, that bullish retracement on the weekly came as a result of a bullish extension on the daily chart. The pertinent question before us now is whether or not the bulls of the daily chart will be able to come in strongly enough to contain the current bearish push and hold prices in a bullish trend.
Here is my take.
It is common knowledge that the lower time frames move in consonance with (in obedience to) the higher timeframes... lol (the word "obedience" got me laughing for a bit. But let's cyt back to the chase)
Now we have seen the daily printing a bullish narrative. But we are all expected to believe that the bullish trend sustained by the daily has the primary intention and purpose of driving prices in the direction of the higher timeframe, which in this case is the weekly chart. We therefore believe that all of that bullish push was to drive prices into the Weekly reversal zone. With that being fulfilled, price is expected to move in the direction of the Weekly over and above the daily direction. This is the regular theory and philosophy of the forex market.
But will that narrative hold sway this time around?
We see prices now dipping bearish. This is an extension for the Weekly chart, and at the same time a retracement on the daily bullish swing.
In the event that the Daily zone holds (which is less likely), we will expect to see prices reverse bullish, begin totally and move to take out Daily liquidity target above. This will result in a deeper retracement inside the Weekyl zone, or a complete breach of the zone. Where the zone is breached, we will look to see the market print higher prices and go all the way up.
On the other hand, if the bearish perspective of the Weekly holds, we will expect to see the Daily zone breached, at which point we will expect prices to dip towards the weekly liquidity target below.
So guys, who do you thing is gonna win the day, the Bulls of the Daily or the Bears of the Weekly? share your thoughts in the comment section
