Fundamental Market Analysis for May 16, 2025 GBPUSDU.S. producer prices unexpectedly fell in April as the cost of services fell the most since 2009. The Bureau of Labour Statistics on Thursday released data that the
US Producer Price Index (PPI) rose 2.4 per cent in April, down from 2.7 per cent previously. This figure was weaker than market expectations of 2.5%. In addition, initial jobless claims in the US for the week ending 10 May were 229 thousand, compared to the previous week's 229 thousand (revised from 228 thousand). This value was in line with initial estimates.
Swap markets priced in the first Fed rate cut of 25 basis points (bps) at the September meeting and expect two more rate cuts before the end of the year. Some analysts believe policymakers may wait until December.
Favourable UK Gross Domestic Product (GDP) data suggests the UK's economic health is robust, dampening hopes of aggressive monetary policy easing by the Bank of England (BoE). This, in turn, provides some support for the British pound against the US dollar.
Trading recommendation: BUY 1.3350, SL 1.3250, TP 1.3550
Dollar

Solid Trend on Gold. How will we close the week?Looking for the bullish activity to continue as we close out the week. but being that it is Friday we must keep expectations low. Friday is notorious for doing whatever it wants. Patience! Wait for Killzones.

DXY 1W Forecast until the end of MAY 2025Up-trend will resume and last until the end of February 2025 topping no higher than 114. Current bottom is in at 105.9
Hence, it shouldn't fall below.
After February a consolidation period of 1,5 months will trap price action between the bottom of 122.16 and upper level of 114.9
The spring squeezed during consolidation will provide enough energy for further upwards movement starting in the end of April 2025. This will ignite a chain of devaluation of national currencies followed by epidemic inflation across the globe. This will finish/cool-down at DXY reaching the mark of 148.
New reality after May 2025?

Gold had Swept Lows and Filled Bullish Gaps! Reversal next?This is price action that I was patiently waiting for. Now that we have that sweep lows Im looking for signs price want to turn around. It can remain bearish for now. But Im expecting to see something clear by the time we get inside of the killzone.

DXY Sell this rally. Bearish until end-of-year.The U.S. Dollar index (DXY) has been trading within a Channel Down since the September 26 2022 High and is currently on a medium-term Bearish Leg. The last 3 weeks however have been a short-term rebound (all 1W candles green), but the price is still below both the 1W MA200 (orang trend-line) and the 1W MA50 (blue trend-line).
This doesn't alter the bearish trend as this is not the first time we've seen this price action. More specifically, DXY also made a short-term rebound during the first Bearish Leg of the pattern and rebounded on January 30 2023 back to the 1W MA50. This delivered a strong rejection which eventually completed the Bearish Leg with one last round of selling to complete a -13.30% Bearish Leg in total.
Before that, we also saw the same pattern (also on 1W RSI terms) in 2020, when on August 31 2020 the price again had a short-term rebound only to resume the bearish trend and finish the sequence again at -13.40% from the top.
As a result, as long as the price remains (closes) below the 1W MA50, the last sell signal is given when the 1W RSI breaks above its MA (yellow trend-line) and then we can expect the Bearish Leg to complete a -13.30% decline with a 96.000 Target.
-------------------------------------------------------------------------------
** Please LIKE 👍, FOLLOW ✅, SHARE 🙌 and COMMENT ✍ if you enjoy this idea! Also share your ideas and charts in the comments section below! This is best way to keep it relevant, support us, keep the content here free and allow the idea to reach as many people as possible. **
-------------------------------------------------------------------------------
💸💸💸💸💸💸
👇 👇 👇 👇 👇 👇

We need SWEEPS on Gold for a Bigger movePatiently waiting for gold to give us impulsive activity to indicate for a much bigger move. Need it to break outside of the current value first before I'm interested in a solid direction.

Digital Euro: Separating Fact from Conspiracy TheoriesIn today’s fast-paced digital landscape, misinformation can spread rapidly and mislead even those well-intentioned readers. With the Digital Euro project circulating online, numerous pieces of fake news have surfaced—not just criticism or differing opinions, but outright falsehoods that may convince citizens, especially those less familiar with financial innovations, that the project is something it is not. In this article, we delve into the most common misconceptions and explain with clarity and factual context why these claims do not correspond with reality.
1. Myth: "The Digital Euro Will Replace Cash"
❌ False. Despite alarming headlines, cash will not vanish. The Digital Euro is poised to become an additional payment option alongside physical money. The Eurosystem is committed to ensuring that banknotes and coins remain accessible. In fact, plans are already underway to introduce new series of euro banknotes, reaffirming the continued value of cash in our daily transactions.
2. Myth: "The ECB Will Be Able to Control and Block Your Payments"
❌ False. Privacy is a cornerstone of the Digital Euro. Similar to the way cash transactions operate, offline payments would be possible without any tracking by the Eurosystem. This means that your personal transactions remain private and free from arbitrary interference. The design of the digital euro ensures that your financial autonomy is preserved.
3. Myth: "There Will Be Arbitrary Limits on How Much Digital Euro Can Be Held"
❌ False. Any limits imposed on holding digital euros would not be arbitrary measures of control but rather tools to safeguard financial stability. Such thresholds are considered from the perspective of systemic security—not the curtailment of individual freedom. The focus is on ensuring that the financial ecosystem remains resilient rather than monitoring or constraining individual spending.
4. Myth: "The Digital Euro Is a Way to Introduce Negative Interest Rates on Deposits"
❌ False. The digital euro is designed to mirror cash in its fundamental properties—namely, being interest-free. It is not a mechanism for financial authorities to impose negative interest rates on personal funds. The purpose is to complement traditional cash by offering a modern payment solution without altering the neutrality of money.
5. Myth: "It Will Be Mandatory to Use the Digital Euro"
❌ False. Use of the digital euro is entirely optional, serving as one out of many available payment instruments. Just as consumers choose between cash, credit cards, or other digital means, the digital euro is simply an additional tool. No regulation compels you to adopt this innovation if you prefer your existing methods.
6. Myth: "Banks Will Lose All Their Role"
❌ False. The introduction of the digital euro will not render banks obsolete. Banks will continue to provide essential financial services, acting as intermediaries and offering the digital euro alongside other products. The evolution of the payment system enhances consumer choice without dismantling the traditional banking framework.
7. Myth: "The Digital Euro Will Be Programmable, So They Will Tell You How to Spend Your Money"
❌ False. The concept of programmability—that is, dictating how funds are spent—has been explicitly ruled out by the ECB. Both proposals from the European Commission and the legislative frameworks confirm that the digital euro will not be programmable. The goal is to maintain financial freedom and user discretion, similar to how cash operates.
8. Myth: "It's a Project to Eliminate Cryptocurrencies"
❌ False. Rather than extinguishing cryptoassets, the Digital Euro is designed to coexist alongside them. While cryptocurrencies are often speculative and volatile, the digital euro aims to offer a more stable and secure means of payment. The two are intended to serve different purposes: cryptoassets are generally considered investment or speculative instruments, whereas the Digital Euro would fulfill everyday transactional needs.
9. Myth: "There Will Be No More Privacy in Payments"
❌ False. Privacy in the digital age remains a top priority. Offline transactions with the Digital Euro will mirror the privacy features of cash, shielding your personal data. For online transactions, robust privacy regimes are in place. Importantly, the issuer—the Eurosystem—will not have the ability to directly connect transactions to specific individuals, ensuring that your financial privacy is maintained.
Conclusion
The Digital Euro is not the harbinger of a new era of financial surveillance or control. Instead, it represents an additional, modern means of payment designed to coexist with traditional cash and current banking services . By dispelling these myths, we hope to foster a clearer understanding of the Digital Euro project and promote informed discussions based on official facts.
Embracing accurate information is crucial to navigating the ever-changing world of digital finance, ensuring that choices are made based on facts rather than fictions.
FX_IDC:EURUSD TVC:DXY TVC:EXY INDEX:BTCUSD CRYPTO:BTCUSD TVC:SPX EUREX:FESX1! EURONEXT:N100 AMEX:FXE TVC:GOLD FX_IDC:XAUUSD

Fundamental Market Analysis for May 13, 2025 GBPUSDEvent to pay attention to today:
15:30 EET. USD - Consumer Price Index
18:00 EET. USD - BOE Governor Andrew Bailey Speaks
The GBP/USD pair is climbing towards 1.3195 in the early European session on Tuesday.
US President Donald Trump said last week that he would continue to impose new 10% tariffs on imports of most British goods, but would reduce higher tariffs on imports of British cars, steel and aluminium. These positive developments related to the US-UK trade deal are fuelling cable prices.
In addition, gradual and cautious policy easing by the Bank of England is helping to boost the Pound Sterling. The UK central bank cut interest rates by a quarter of a percentage point in a split decision last week and said the risks to growth posed by Trump's global trade war did not derail its plan for cautious policy easing. The Bank of England estimates the UK economy will grow by 1 per cent, up from the 0.75 per cent forecast at its February meeting.
Traders await the release of the US consumer price index (CPI) for April, due later on Tuesday.
Trading recommendation: BUY 1.3225, SL 1.3125, TP 1.3425

news changed things. but we still bullish on GoldPrice pushed down a bit lower but it still makes since for it to take liquidity for gaps and continue with its push. We have to wait for the killzones to give us a better idea.

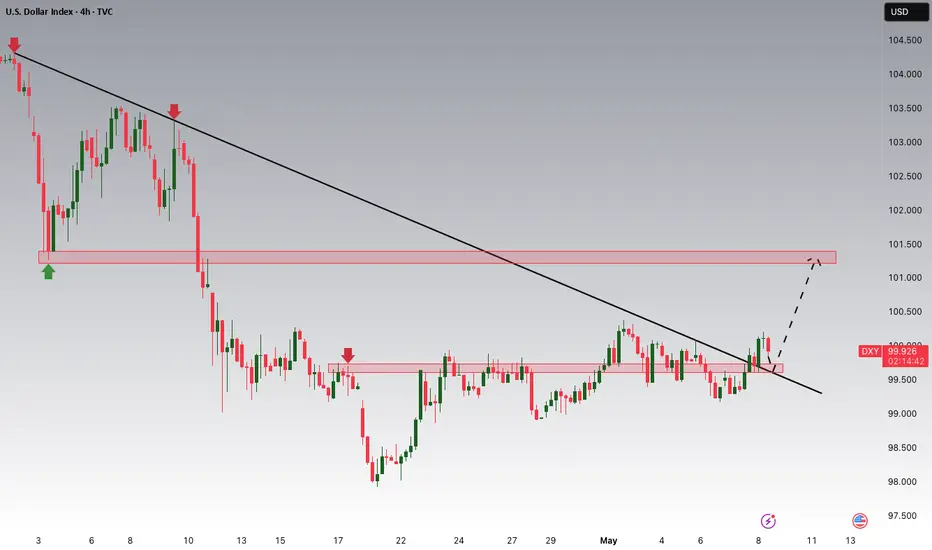
DXY Ready to Pop – Watch That 100 Break!After breaking below the key psychological level at 100 and making a low just under 98, the Dollar Index ( TVC:DXY ) has entered a consolidation phase.
Over the past three weeks, price has developed an inverted head and shoulders pattern, with the neckline perfectly aligning with the horizontal resistance at 100 — a strong zone of confluence from both a technical and psychological standpoint.
Despite the current hesitation under resistance, the structure suggests bullish potential. I believe we are approaching a breakout above 100, and once that happens, an acceleration to the upside is likely to follow.
🎯 Target: 102
🔒 Invalidation: A break below 98 would cancel the bullish bias.
As long as the price stays above the 98 area, I remain bullish and expect the dollar to strengthen.
🚀 The breakout hasn’t happened yet — but the pressure is building.

Global Calm, Fiscal Storm: The Yen's Challenge?The USD/JPY currency pair has recently experienced a notable surge, driving the Japanese Yen to its weakest level against the US Dollar in a month. This appreciation primarily stems from a significant improvement in global risk sentiment, sparked by a breakthrough trade agreement between the United States and China. This deal, aimed at reducing the US trade deficit, has bolstered investor confidence and diminished the traditional safe-haven appeal of the Yen. Adding to the dollar's strength is the Federal Reserve's continued hawkish stance, signaling no immediate plans for interest rate cuts and reinforcing the attractiveness of dollar-denominated assets amidst easing concerns about a US recession.
Simultaneously, internal economic pressures in Japan significantly weigh on the Yen. The nation's public debt has reached an unprecedented high, driven by persistent increases in defense spending and social welfare costs due to an aging population. Government subsidies for energy bills and the need to issue more bonds to cover rising expenditures exacerbate this fiscal strain. This challenging domestic backdrop contrasts sharply with the Federal Reserve's position, creating a widening divergence in monetary policy outlooks that favors the US Dollar through yield differentials, despite the Bank of Japan's cautious consideration of future rate adjustments.
Furthermore, reducing global geopolitical tensions has contributed to the shift away from safe-haven currencies. Recent ceasefires and prospects for diplomatic talks in key conflict areas have encouraged a "risk-on" environment in financial markets. This increased appetite for riskier assets directly reduces demand for the Japanese Yen, amplifying the impact of fundamental economic factors and monetary policy divergence on the USD/JPY exchange rate. The pair's trajectory remains subject to evolving global dynamics, upcoming economic data releases, and central bank communications.

A Gap In gold Needs to be Filled! Price opened gaping down. Now im looking for price to fill in that gap. establishing a low for the week and continue pushing up. Possibly going for new ATHs. We have to allow Monday to play out though to see what they want to do.

Bearish revrsal off pullback resistance?US Dollar Index (DXY) is rising towards the pivot and could reverse from this level to the 1st support.
Pivot: 101.78
1st Support: 98.90
1st Resistance: 103.41
Risk Warning:
Trading Forex and CFDs carries a high level of risk to your capital and you should only trade with money you can afford to lose. Trading Forex and CFDs may not be suitable for all investors, so please ensure that you fully understand the risks involved and seek independent advice if necessary.
Disclaimer:
The above opinions given constitute general market commentary, and do not constitute the opinion or advice of IC Markets or any form of personal or investment advice.
Any opinions, news, research, analyses, prices, other information, or links to third-party sites contained on this website are provided on an "as-is" basis, are intended only to be informative, is not an advice nor a recommendation, nor research, or a record of our trading prices, or an offer of, or solicitation for a transaction in any financial instrument and thus should not be treated as such. The information provided does not involve any specific investment objectives, financial situation and needs of any specific person who may receive it. Please be aware, that past performance is not a reliable indicator of future performance and/or results. Past Performance or Forward-looking scenarios based upon the reasonable beliefs of the third-party provider are not a guarantee of future performance. Actual results may differ materially from those anticipated in forward-looking or past performance statements. IC Markets makes no representation or warranty and assumes no liability as to the accuracy or completeness of the information provided, nor any loss arising from any investment based on a recommendation, forecast or any information supplied by any third-party.

USDJPY Set to Rise as Support Holds and Dollar Finds TailwindsUSDJPY looks poised for further upside following a period of consolidation and a successful retest of strong support around the 140.50 level. The weekly chart reveals a clear triple bottom pattern, reinforcing the strength of this support zone and suggesting renewed bullish momentum.
The US Dollar is starting to regain strength after a period of weakness, supported by improving U.S. economic data, sticky inflation, and a less dovish stance from the Federal Reserve. In contrast, Japan is unlikely to change its ultra-loose monetary policy in the near term, keeping rate differentials wide and favoring a stronger Dollar.
With the Bank of Japan expected to hold rates steady for the foreseeable future, capital is likely to continue flowing out of the yen. Carry trade flows remain intact, adding to the upward pressure on USDJPY.
Momentum indicators are turning higher, and price action is forming a steady base for another leg up. The market could target the 150 zone in the coming weeks, where the 50-week moving average may act as initial resistance.
As long as 140.50 holds, dips could offer attractive buying opportunities. A sustained move above 145.00 could trigger fresh bullish momentum and accelerate gains.

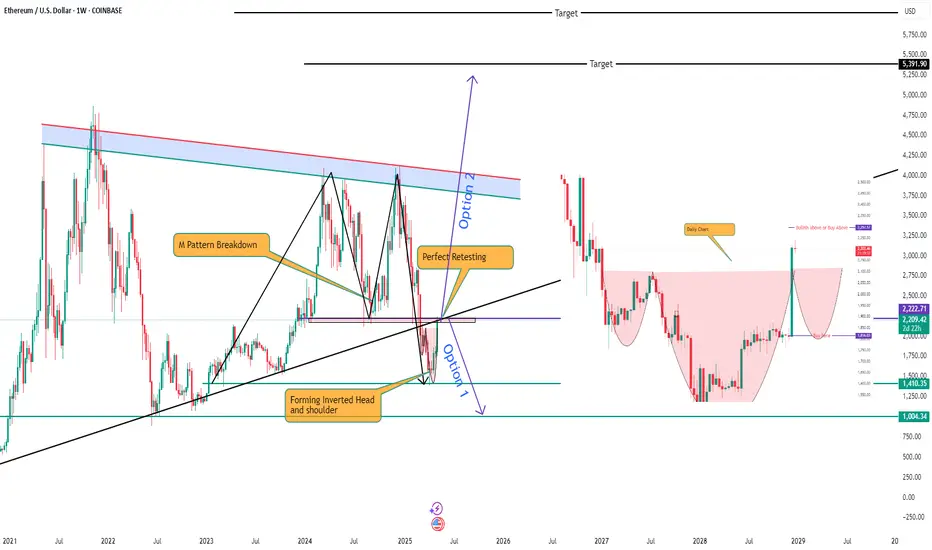
Ethereum - Perfect exactly how I thoughtEthereum
Stage 1 - Triangle Pattern - Gave perfect breakdown of triangle pattern
Stage 2 - Form M Pattern - Have almost completed the selling target
Stage 3 - Retesting completed *Current)
Stage 4 - Forming inverse cup and handle and inverted head and shoulder pattern
Stage 5- in either of the scenario it may come down but if it goes above 2297 expect it to reach 4000/500/7000 in coming days
Stage 5.2 - if the retesting is completed and bearish patter is continued expect it to reach to 900 USD
For more details ping me
GK Trade manthan
Retrace Complete...but we need 1 more Sweep on Gold!This pullback is what I waited for and it took all week for it to happen. Not sure if I will get the bullish move today being that it is Friday. But if they hit the level I'm looking for I will try at least once. Keeping expectations low since its the end of the week. but things are shaping out for us to have a STRONG bullish week next week.

Why I'm Bullish on the DXY: A Fundamental Approach!Powell continues to take a cautious tone, emphasizing a wait-and-see approach while acknowledging rising inflation risks, which suggests there's no urgency to cut rates. This leans slightly hawkish, especially compared to the market’s more dovish expectations, and could support some near-term Dollar strength. However, a more sustained move in the USD likely hinges on progress in upcoming trade discussions—particularly with China. Today's FOMC outcome is just one part of the broader picture; the next key signal may come with developments in the coming days. For now, the bias remains USD bullish heading into the London session.
Technically, the DXY has broken its downtrend, signaling a potential shift in momentum. I’ll be watching for a possible retracement toward the 99.700 area, which could serve as a key support level before any further upside continuation.
"DXY is building a textbook bullish flag — here’s exactly where For Traders (technical + confident)
DXY bulls gearing up for a double-leg rally”
1. Context & Market Structure:
After a sharp impulsive drop (green falling wedge), DXY has begun corrective accumulation in an ascending channel.
Current price 99.531 is consolidating inside a broadening bullish flag pattern.
Key Zones:
Major supply zone: 100.500 – 101.000 (highlighted yellow box)
Short-term resistance: 99.700
Short-term support: 98.8Projected Path (2 bullish legs):
First push (red path): Minor pullback → break to ~100.100
Second push (blue path): Consolidation → breakout towards 100.500–101.000 (target zone)
00–98.500
Bias:
Short-term bullish → Targeting supply zone around 100.5–101.0
Invalidation level: Clear break below 98.500 (would negate bullish setup)
>
Trade Idea:
Buy on dips within the ascending flag, targeting 100.100 and 100.500
Watch reaction near supply zone for possible reversal or continuation

GBP Steady Near $1.33, BoE Rate Cut ExpectedThe British pound hovered near $1.33 as traders awaited the BoE’s decision, with a 25 bps cut to 4.25% widely expected. Markets are also eyeing new economic forecasts for signals of further easing. While Trump’s tariff plans have stoked global slowdown fears, the UK is less exposed due to a U.S. goods surplus. A fresh trade deal with India, expected to generate £4.8 billion annually by 2040, may also cushion the economy.
If GBP/USD breaks above 1.3430, resistance levels come in at 1.3500 and 1.3550. Support lies at 1.3200, followed by 1.3050 and 1.2960.

What’s America's Real Goal in a Possible India–Pakistan War?We are nearing the end of the petro-dollar era. The power balance of the new world order will be defined not by oil, but by the strategic resources essential for AI, electric vehicles, and cutting-edge technology.
Throughout the 20th century, the U.S. maintained its global dominance by controlling access to oil. From the Middle East to Latin America and Africa, wherever oil was found, the U.S. was there.
But today, the focus has shifted to rare earth elements, lithium, copper, and other strategic minerals.
Trump’s 2025 move to buy Greenland wasn’t a diplomatic joke—it was a signal. Behind-the-scenes deals in Ukraine for rare earth deposits tell the same story: whoever controls these "white gold" assets will lead the tech-driven world.
Now enters Pakistan, with mineral-rich lands spanning over 600,000 km², nearly three times the size of the UK. Experts estimate its underground reserves to be worth $8 trillion.
In Balochistan's Rekodik field alone, there are 12 million tons of copper and 20 million ounces of gold, with a copper purity of 0.53%, well above global standards. In the north, newly discovered lithium reserves could be a game-changer for the EV revolution.
This is no longer just about resources—this is about deciding the future balance of global power.

Gold Should complete the Retrace before giving another DirectionWas expecting the pullback. Now I just need to wait for it to finish before trying to buy it. Price should give us a solid confirmation when its finally ready. want to see them take out some lower levels first. If price gives up a entry during Asia session we could see a nice short.

Bullish bounce?US Dollar Index (DXY) is falling towards the pivot and could bounce to the 1st resistance.
Pivot: 99.61
1st Support: 99.36
1st Resistance: 100.03
Risk Warning:
Trading Forex and CFDs carries a high level of risk to your capital and you should only trade with money you can afford to lose. Trading Forex and CFDs may not be suitable for all investors, so please ensure that you fully understand the risks involved and seek independent advice if necessary.
Disclaimer:
The above opinions given constitute general market commentary, and do not constitute the opinion or advice of IC Markets or any form of personal or investment advice.
Any opinions, news, research, analyses, prices, other information, or links to third-party sites contained on this website are provided on an "as-is" basis, are intended only to be informative, is not an advice nor a recommendation, nor research, or a record of our trading prices, or an offer of, or solicitation for a transaction in any financial instrument and thus should not be treated as such. The information provided does not involve any specific investment objectives, financial situation and needs of any specific person who may receive it. Please be aware, that past performance is not a reliable indicator of future performance and/or results. Past Performance or Forward-looking scenarios based upon the reasonable beliefs of the third-party provider are not a guarantee of future performance. Actual results may differ materially from those anticipated in forward-looking or past performance statements. IC Markets makes no representation or warranty and assumes no liability as to the accuracy or completeness of the information provided, nor any loss arising from any investment based on a recommendation, forecast or any information supplied by any third-party.
