USD/MXN Mirrors 2017 Reversal; Elliott Wave Pointing Lower Back in 2016–2017, we first saw a very sharp recovery on USD/MXN, but when Trump took office in January 2017, the market reversed strongly lower, falling all the way from 22 to 17.60, lost nearly 20% . That very similar pattern is now becoming visible again with 2024–2025 price action. Last year, after Trump won the US election, we saw significant depreciation of the Mexican peso, but since he has officially taken office in January, we’re seeing a complete reversal—just like in 2017.
In fact, the Mexican peso has been gaining nicely over the past few months, likely based on speculation that Trump will find the agreement and trade deals with other countries, particularly related to tariffs. Since no one really benefits from trade wars, it’s not surprising that even Trump’s recent remarks reflect an acknowledgment of the global situation being unsustainable, especially when it comes to CHINA-US trade.
With that in mind, markets in general are likely to recover, and we’re already seeing some nice rebounds. And when stocks are in recovery mode, commodity currencies—including the peso—tend to perform well.
Looking at USD/MXN specifically, we’re seeing a strong reversal down from February highs, just like in 2017. The current drop hasn't even retraced 38.2% of the 2024 rally yet, which suggests more downside is likely—ideally toward the 19.00 area, maybe even 18.00 by year-end.
From an Elliott Wave perspective, it's useful to zoom in on smaller time frames. The structure doesn’t look like completed impulse yet, so technically there can be more weakness coming. Resistance for wave four rally sits around the 19.77–19.84 zone, which aligns with Fibonacci projections for wave four, as well as swing lows from March and April.
This area could serve as a nice resistance of the current bounce, especially if the Fed delivers any dovish remarks this week. No rate cuts are expected, but even a hint at future cuts could send the US yields lower, which would weigh on the dollar and support risk assets—meaning commodity currencies could outperform.
In that case, USD/MXN could ideally fall back below 19.50.
Elliott Wave analysis also helps define clear invalidation levels, very important when it comes to potential trade setups. In this scenario, 20.16 is a key level to watch. A break above it would overlap with the start of the current move and signal that the bears are finished for now, thus I would need to adjust the view accordingly.
Grega
Dollar

USDJPY Forecast: Haven Appetite Back in SightUSDJPY remains above the 0.618 Fibonacci retracement zone at 139, stemming from the uptrend between January 2023 (127.20) and July 2024 (162.00).
However, the pair is currently trading below resistance at 146, steering the trend back toward key support levels at 142 and 139.
A decisive break below 139 could expose new 2025 lows near 138.30 and 134.60, both key Fibonacci levels.
On the upside, a rebound above 146 may open the way to 149 and 151, testing the grounds for a more sustainable uptrend.
Written by Razan Hilal, CMT

Bullish Breakout for Gold???Waiting to see what they want to do. Price was bullish all day yesterday and Im trying to see if they want to give a pullback before continuing with the action. I know its best to just wait for the killzone to get the best entry.

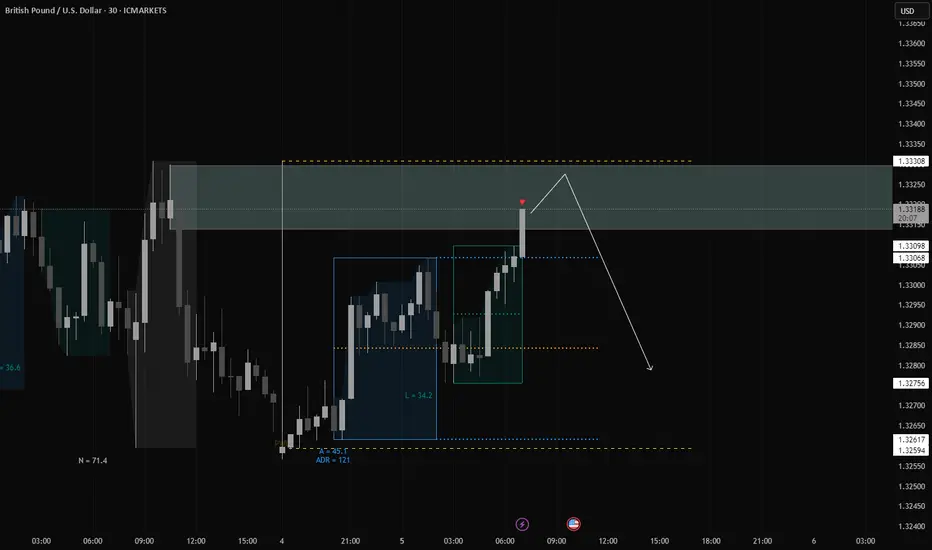
GBPUSD Sell AreaHello everyone, we got a potential sell zone around this zone for GBPUSD.
HTF Trends (D & W) indicate a bearish trend and it does seem like GBPUSD might be seeking to take out liquidity before continuing its move.
For my entry confirmation I will be looking out for rejection and see if we can get any clear patterns.
I expect the move to happen at most late during new york session.
Let me know your thoughts!
Dollar Decline Against All Major CurrenciesThe Dollar’s decline didn’t start with the recent ‘Liberation Day’ tariffs. In fact, it has been gradually weakening since the 1970s.
More recently, however, the Dollar has lost value against many currencies since January. Why is that?
Why have the USD/CHF and USD/SGD strengthened against the US Dollar over the past few decades? One reason is that both countries have managed their money supply with discipline. For example, as of end-2024, Switzerland’s net federal debt stood at 141 billion Swiss franc, their debt to GDP ratio at 17.2%.
In contrast, the United States has expanded its national debt at an alarming rate. Some might point out that Japan’s debt-to-GDP ratio is even higher—around 230%. That is why the Japanese Yen has also been in decline for decades.
Why does printing more money through QE and increasing the money supply weaken a currency?
Just imagine in a close economy with 10 people and 1 central bank. If the central bank printed $100 and distributed equally to the 10, each of them will receive $10 to buy 10 available cheesecakes.
But now the central bank decided to print $1,000 and each person will have $100 to buy 10 available cheesecakes.
The global economy is not a close, but an open system.
When the US and other major economies printed massive amounts of money, they didn’t just inflate their own economies—they exported inflation worldwide. This contributes to rising cost of living not all around the world.
In my view, Gold is also a currency pair against the US at the start of 1971. The moment dollar unpeg itself from gold, gold appreciates. With each QE, we can see how the currencies have diluted with gold and inflation appreciating over these years.
Why different currencies have started to appreciate against the USD since January this year?
We can see all the currencies have either reached its bottomed in January and started moving higher or it formed a reversal pattern like the Aussie dollar and the Dollar Yuan, in this case with this inverted hammer, it is indicating Dollar Yuan to reverse downward, meaning dollar coming off and yuan to appreciate.
January was President Trump inauguration and February was when he rolled out tariffs against Canada, Mexico and China, and the market do not like that and has been selling the USD against the rest of the currencies?
If US has printed the so much money, but why other than Swiss franc and Singapore Dollar, many other currencies have been depreciating against dollars over the past decades?
I’d like to hear your thoughts on this.
Euro FX Futures & Options
Ticker: 6E
Minimum fluctuation:
0.000050 per Euro increment = $6.25
Disclaimer:
• What presented here is not a recommendation, please consult your licensed broker.
• Our mission is to create lateral thinking skills for every investor and trader, knowing when to take a calculated risk with market uncertainty and a bolder risk when opportunity arises.
CME Real-time Market Data help identify trading set-ups in real-time and express my market views. If you have futures in your trading portfolio, you can check out on CME Group data plans available that suit your trading needs www.tradingview.com
Trading the Micro: www.cmegroup.com

Whats the direction for the Week? We should wait to see...Looking for price to go Bullish...But i need to allow Monday to play out first to give us a solid direction. They could go bullish early or they could pull back to give a lower entry first.

EURUSD: Detailed Support & Resistance Analysis 🇪🇺🇺🇸
Here is my latest structure analysis
and important supports & resistances on EURUSD
for next week.
Consider these structures for pullback/breakout trading.
❤️Please, support my work with like, thank you!❤️
I am part of Trade Nation's Influencer program and receive a monthly fee for using their TradingView charts in my analysis.

US INDEX (DXY) TIME TO BUY !!!HELLO TRADERS
As i can see this chart created a harmonic pattren and it crystal clear showing the levels till it hold above our design Stop Loss Trade War Talks and NFP results with slowing down the inflation shows us that $ will recover from this zone if not break SL make a proper research befor taking any trade we appriciate your cooments and support us Stay Tuned for more updates ...

DXY (Dollar index) Shorts from 1hr supply zone My general outlook on the DXY this week leans bearish, as I expect price to continue trending lower. I’ve identified a nearby 1H supply zone, where we could see price react and begin pushing lower. There is also a larger supply zone further above, but it’s currently out of reach unless price pulls back significantly.
Looking back, the 2-day demand zone I marked over a week ago has played out well, with a strong bullish reaction from that level — price is still rising from that zone. During this move, a new 11H demand zone has formed, which also led to a change of character to the upside. If price revisits that zone, we may see another bullish continuation from there.
Key Points:
Overall bearish trend expected to continue in the short term.
1H supply zone nearby is a potential trigger point for a sell-off.
2D demand zone previously marked is still holding and influencing price.
11H demand zone has caused a bullish shift and could provide another long opportunity if price returns.
P.S. This is my general DXY outlook for the week. I don’t trade the dollar directly, but I use it as a key confluence when analysing and executing trades across other major pairs.

NZDUSD Potential DownsidesHey Traders, in today's trading session we are monitoring NZDUSD for a selling opportunity around 0.59650 zone, NZDUSD is trading in a downtrend and currently is in a correction phase in which it is approaching the trend at 0.59650 support and resistance area.
Trade safe, Joe.

Dollar Outlook Ahead of Jobs ReportThe dollar index is attempting a comeback, but the 100.20–100.50 zone has so far formed a strong resistance. Today’s jobs report will be key for determining the short-term direction.
Nonfarm payrolls are expected to rise by 138k. This could be the last relatively strong report before the effects of tariffs begin to weigh on the labor market. Leading indicators already show significant pressure on trade and transportation employment, though the full impact is likely to emerge in future reports. Still, we may see early signs of softness today.
As the economy comes out of winter, there could be some temporary strength in weather-sensitive sectors. Overall, I expect a slight beat in today’s nonfarm payrolls data. If unemployment also holds at 4.2%, the dollar could respond positively. Positive reaction to the payrolls data usually do not pass around 1% gains.
An interesting detail: TVC:DXY has risen after each of the last eight jobs reports, regardless of whether the data was strong or weak. That trend might end today, though, as the dollar is no longer in an established uptrend.
If the 100.20–100.50 resistance zone breaks, the dollar could climb toward 101.50 in the coming days. However, the broader outlook remains negative.
Please check our longer-term analysis here:

Why Has the USD Been Falling?Dollar has lost value against many currencies since January. Why is that?
The Dollar’s decline didn’t start with the recent ‘Liberation Day’ tariffs. In fact, it has been gradually weakening since the 1970s.
U.S. Treasury Futures & Options
Ticker: 6E
Minimum fluctuation:
0.000050 per Euro increment = $6.25
Disclaimer:
• What presented here is not a recommendation, please consult your licensed broker.
• Our mission is to create lateral thinking skills for every investor and trader, knowing when to take a calculated risk with market uncertainty and a bolder risk when opportunity arises.
CME Real-time Market Data help identify trading set-ups in real-time and express my market views. If you have futures in your trading portfolio, you can check out on CME Group data plans available that suit your trading needs www.tradingview.com
Trading the Micro: www.cmegroup.com

Lows Swept! Now we should get Bullish action on Gold!Waited for price to sweep lows before looking for areas to buy. We got that sweep and its now the end of the week. We have been bearish all week. I'm not sure if it will go full on bullish cause we are in a new month and its Friday. They might just move sideways and wait for next week to push. We will take what we can get.

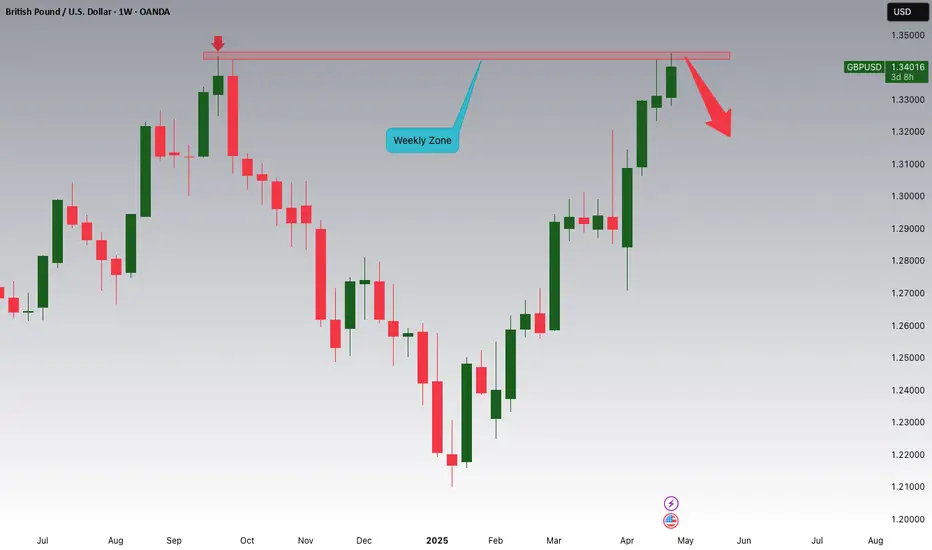
GBPUSD is Forming a Weekly Double Top!!!Hey Traders!
In today's session, we're closely watching GBPUSD for a potential short setup around the 1.34200 level.
The pair is currently forming a double top pattern on the weekly timeframe, a classic reversal signal. Price action is showing signs of rejection at the neckline, suggesting possible downside momentum from this key resistance zone.
Trade safe, Joe.
USDCHF Potential UpsidesHey Traders, in today's trading session we are monitoring USDCHF for a buying opportunity around 0.82700 zone, USDCHF is trading in an uptrend and currently is in a correction phase in which it is approaching the trend at 0.82700 support and resistance area.
Trade safe, Joe.

EUR/USD Inverse DXY PatternEUSR/USD forming a carbon copy inverse of the DXY on daily timeframe (stands to reason). Will we see the other half play out? Bulls still seem in control, but such meteoric rise surely comes with some correction to the downside as the dollar strengthens?

GOLD setting up for a bigger Bullish PlayBeen waiting for price to get down close to this FVG. Now it looks like it setting up for the bigger play. The key is to wait for the killzone.

IMP update for all Forex Traders Expect the Dollar Index (DXY) to appreciate in the near future. However, a further decline into the green highlighted region is possible before this upward movement. The green zone represents a potential key reversal area. Monitor the following currency pairs for trading opportunities if the DXY begins to climb:
BUY - USDCAD, USDCHF, USDSGD;
SELL - EURUSD, GBPUSD

Gold Spot (XAU/USD) Bullish Setup: Buy Zone to Target Levels Gold Spot (XAU/USD) on the 1-hour timeframe. Key points:
Support Zone: Strong support is identified in the yellow zone around 3,290–3,293, where price has bounced multiple times.
Buy Zone: Market is currently in a potential buy zone just above support, signaling a possible long entry.
Targets:
1st target: Around 3,368
2nd target: Around 3,419
All-Time High: Marked as a potential long-term resistance above 3,500.
Outlook: If price respects the support and buy zone, the market may rally toward the 1st and 2nd targets. Watch for bullish confirmation before entering.

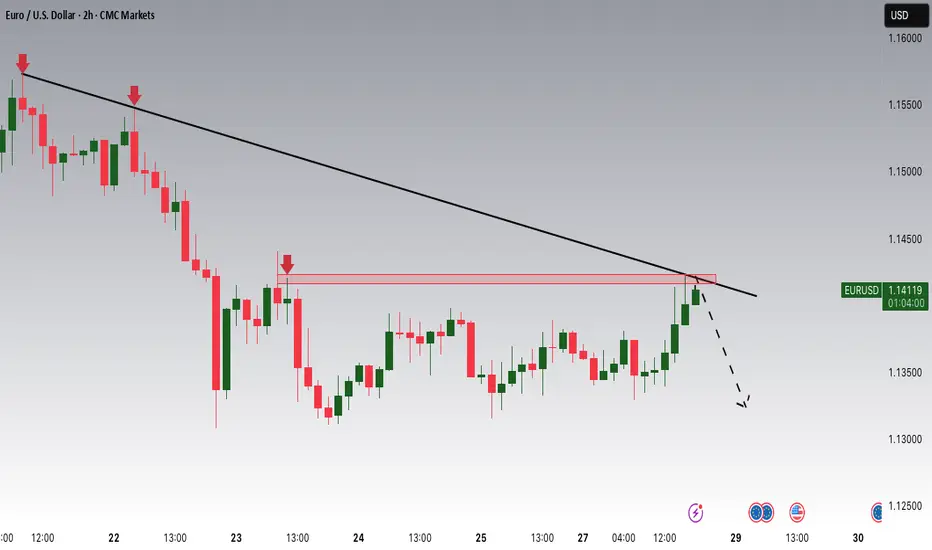
EURUSD is Switching to a Bearish Trend!Hey Traders, in today's trading session we are monitoring EURUSD for a selling opportunity around 1.14200 zone, EURUSD is trading in a downtrend and currently is in a correction phase in which it is approaching the trend at 1.14200 support and resistance area.
Trade safe, Joe.
The Monthly Transition for GoldLooking for price to retrace and take out lows before it proceeds to be bullish. Waiting for Killzones.

GBPUSD SELL NOW BUY LATER!Our previous idea played out perfectly once again! Currently, GBPUSD is showing signs of a pullback within a mini bearish trend. However, I still believe the overall structure remains bullish. I'll be watching for buying opportunities once this pullback completes. Stay patient and wait for confirmation!

Heading into pullback resistance?US Dollar Index (DXY) is rising towards the pivot which is a pullback resistance and could reverse to the 1st support which acts as a pullback support.
Pivot: 100.27
1st Support: 98.32
1st Resistance: 101.77
Risk Warning:
Trading Forex and CFDs carries a high level of risk to your capital and you should only trade with money you can afford to lose. Trading Forex and CFDs may not be suitable for all investors, so please ensure that you fully understand the risks involved and seek independent advice if necessary.
Disclaimer:
The above opinions given constitute general market commentary, and do not constitute the opinion or advice of IC Markets or any form of personal or investment advice.
Any opinions, news, research, analyses, prices, other information, or links to third-party sites contained on this website are provided on an "as-is" basis, are intended only to be informative, is not an advice nor a recommendation, nor research, or a record of our trading prices, or an offer of, or solicitation for a transaction in any financial instrument and thus should not be treated as such. The information provided does not involve any specific investment objectives, financial situation and needs of any specific person who may receive it. Please be aware, that past performance is not a reliable indicator of future performance and/or results. Past Performance or Forward-looking scenarios based upon the reasonable beliefs of the third-party provider are not a guarantee of future performance. Actual results may differ materially from those anticipated in forward-looking or past performance statements. IC Markets makes no representation or warranty and assumes no liability as to the accuracy or completeness of the information provided, nor any loss arising from any investment based on a recommendation, forecast or any information supplied by any third-party.
