Bullish during the War
Weekly Timeframe
Awesome Oscillator is still having its Bearish Retracement. We are looking for green volume next week to see more upside candles. Ichimoku-Cloud is still holding on, we are still inside the cloud which is fairly bullish. EMA Ribbon is still bullish it hasn't changed really from being bullish since 2011. We are currently experiencing two spring up. if we close with green candle we can expect more to the upside.
1D Timeframe
This is Double Bottom that has huge potential to the upside. We already broke the cloud and the next rejection area is $42,221. We just need to hold on to this line of support and wait for the push up after consolidation; and if we don't, then we can see a movement to the downside. Our retracement in daily time-frame has shown green volume already in AO, it means this is the beginning of more volume and candle to the upside. The bottom are reached in the Retracement. RSI is also about to cross its Moving Average which means we are crossing a bullish zone for RSI.
4H Timeframe
200 Moving Average in 4h timeframe becomes weak and easy to break. We have broken the resistance in the second retest, so we can expect more to the upside. We need to break $39,904 and hold it as our support area then break $40,646 to continue the bull run. AO is already bullish and no sign of retracement yet.
We will discuss more on the possibility on our Live. Stay tune and check with us!
Want more insights before US market open? Hit Like, Share, and Subscribe for more daily trading tutorial & cryptocurrency news
TradeScholar, the best cryptocurrency educational community online!
Find the content above difficult to understand?
Feeling lost about how to trade?
Want to learn how to do your Own Price Prediction?
We endeavour to share you our investment knowledge & experience in order to help you starting your path to financial freedom. Follow, Subscribe & Join our Community to trade together!
Disclaimer: Above technical analysis is pure educational information, not Investment Advice. The information provided on this post does not constitute investment advice, financial advice, trading advice, or any other sort of advice and you should not treat any of the website's content as such. Do conduct your own due diligence and consult your financial advisor before making any investment decisions.
Dollar_index

What Does DXY Want To Do Next?!As we all know the chaos between Russia and Ukraine has escalated into an all-out war! Where does that leave the dollar index? How does it affect the movement? Will we see drastic moves or will it continue to move according to market structure? Personally, I cannot say what the DXY will do, but… I can give my best analysis on it!
We seen from the previous week then dollar was bearish and mid-week, she made a hard dip and then a quick move up! Few of the assets paired with the dollar (UCAD, UJ, EU, GU, etc.) were showing signs of uncertainty. Selling off dramatically, buying up frantically, no one seemed to know what was going on. This coming week I will anticipate the dollar index to become bullish. As of late, oil prices have been surging and somehow the dollar looks to (somewhat) still be in tact. Also the US is reportedly mustering up a nuclear deal with Iran. If the deal goes through we could see oil prices coming down, which would mean a rise in the almighty dollar! On my chart at the most recent level of price action you can see DXY stopped going lower than a certain level and has found small support after shorting on the 15th & 17th.
Markets have been very active lately so it would be wise to follow up on any news events and correlate them with your analysis! As for me? I’ll be paying close attention to the issues with Russia and Ukraine, how dxy, gold, and oil prices react, and what new information is being released to directly affect the markets.
Overall this coming week on DXY: BULLISH

EURUSD 4H Analysis 450+ PipThis is my simple idea for EURO US DOLLAR ( EURUSD ) 4H time frame
I hope it is useful :)
Note 1 : It may take several weeks
Note 2 : DON'T FORGOT, STOPLOSS IS YOUR FRIEND :)
Best regards :)

DOLLAR INDEX Update....SELL...NOW
This week DXY chart Hopefully Create ab=cd pattern. So, that
If breakout 95.858 support zone then market goes to 95.300 & 94.00
support level. If break 96.300 resistance level then market
seems buy to 96.888 resistance level.

DXY dollar will be bullishDXY dollar will be bullish
Dollar created a bullish pattern.
Be carefull, patient and discipline.
This post does not provide financial advice. It is for educational purposes only! You can use the information from the post to make your own trading plan for the market.
But you must do your own research and use it as the priority. Trading is risky, and it is not suitable for everyone. Only you can be responsible for your trading.
Good trades to All.

DXY create butterfly pattern. So long buy Now
This week DXY chart held Bullish butterfly pattern.
Now market buy to 95.826 & 96.144 resistance level.

DXY 96.03 - 0.07% SHORT IDEA * PRICE ACTION & REVERSAL PTTNS HELLO EVERYONE
HOPE EVERYONE IS DOING GOOD HAVING A GOOD ONE.
NEW WEEK, NEW OPPORTUNITIES.
LOOKING AT THE DOLLAR INDEX
* The INDEX is currently trading in a RISING WEDGE , tested the ROOF of this structure.
- looking at a possible H&S FORMATION the 4H AND LOWER.
- Short term the pair has currently entered an uptrend on the 4h chart this.
- Strong bullish momentum towards resistance will invalidate the whole set up.
- Looking for SHORT entries on the INDEX this week should all the rules of the formation be met.
lets see how it goes
IF THIS IDEA ASSISTS IN ANY OR IF YOU LIKE THIS ONE
SMASH THAT LIKE BUTTON & LEAVE A COMMENT.
ALWAYS APPRECIATED
____________________________________________________________________________________________________________________
* Kindly follow your entry rules on entries & stops. |* Some of The idea's may be predictive yet are not financial advice or signals. | *Trading plans can change at anytime reactive to the market. | * Many stars must align with the plan before executing the trade, kindly follow your rules & RISK MANAGEMENT.
_____________________________________________________________________________________________________________________
| * ENTRY & SL -KINDLY FOLLOW YOUR RULES | * RISK-MANAGEMENT | *PERIOD - SWING TRADE

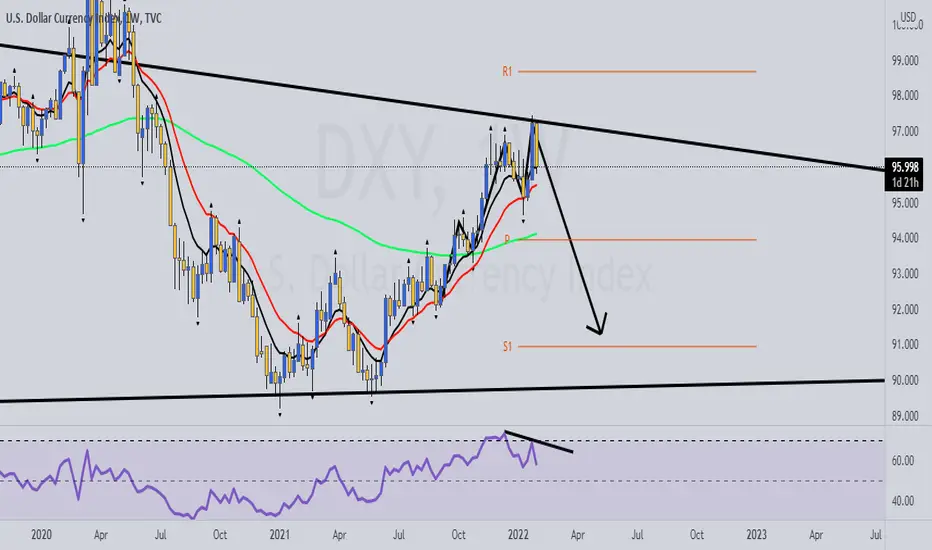
Dollar Index Long Term AnalysisWeekly Bearish Divergence at top of monthly trendline.
Looking for Dollar to drop towards bottom of monthly trendline.
dollar Index still falling downAs you can see the 3rd wave of dollar index in the daily timeframe was finished therefore we are expecting the correction wave which is wave 4.
According to the previous bottomT it could move down to at least 94.62

DXY (Dollar/USD) Technical Analysis & Forecast - Still BullishTraders,
The dollar (DXY) has been rising higher as expected. 2 weeks ago we published an update in which we mentioned that dollar was simply taking a healthy correction for the next move upwards. Dollar Index has exactly done that. It has tested an FCP zone and trend lines and gone up for parabolic move.
Dollar can still rise to 100, 103, 105, 113 on the bullish side. There are several gaps available on the dollar which means that at some point in time it will fall to 90 but when, that no one knows. So manage your positions and risk.
Rules:
1. Never trade too much
2. Never trade without a confirmation
3. Never rely on signals, do your own analysis and research too
✅ If you found this idea useful, hit the like button, subscribe and share it in other trading forums.
✅ Follow me for future ideas, trade set ups and the updates of this analysis
✅ Don't hesitate to share your ideas, comments, opinions and questions.
Take care and trade well
-Vik
____________________________________________________
📌 DISCLAIMER
The content on this analysis is subject to change at any time without notice, and is provided for the sole purpose of education only.
Not a financial advice or signal. Please make your own independent investment decisions.
____________________________________________________


DXY Technical Analysis & Forecast - Has Anything Changed?Traders, Not much has changed on DXY. The dollar index is still struggling between FCP zone and its bullish strength. If we get a break and confirmation above the FCP zone, this can still go parabolic. In this DXY (Dollar/USD) Technical Analysis & Forecast we see various scenarios along with EURUSD situation.
Rules:
1. Never trade too much
2. Never trade without a confirmation
3. Never rely on signals, do your own analysis and research too
✅ If you found this idea useful, hit the like button, subscribe and share it in other trading forums.
✅ Follow me for future ideas, trade set ups and the updates of this analysis
✅ Don't hesitate to share your ideas, comments, opinions and questions.
Take care and trade well
-Vik
____________________________________________________
📌 DISCLAIMER
The content on this analysis is subject to change at any time without notice, and is provided for the sole purpose of education only.
Not a financial advice or signal. Please make your own independent investment decisions.
____________________________________________________

DXY Critical Point 11/02/2021we can see the price has showed some resistance and felled off back to its bearish trend but yet we have a heavy Accumulation zone at 88-90to which market has already showed some reaction and it stood as a support area, we may have some retrace back up to the 38% or 50% of current bearish wave Fibonacci levels and then heads down to the -61.8 of the same wave expansion,
we have defined few TP areas by the confluences of Fibonacci and Price Action where we expect to get if DXY continued its down trend.
from the other side we are having some fundamental news also coming which is not seems to be that good for the greenback and some how supports the fall of the Currency temporally
by this analysis we can be more bullish on the USD Quote instruments and bearish on Base ones.
we are publishing this idea Neutral we had seen some Regular Bullish Divergence with MACD coming up in the Weekly Time Frame which is in the linked ideas

US Dollar FailureIt is pretty clear from the chart the US Dollar is going to have problems breaking the 8/1 Gann ratio and the 0.618 Fib.
The 0.618 Fib has been the most important level for the dollar for the last 30 years , 101 seems like an impossible task to close above with only doing it once in its history in 1999 , by 2003 we feel under and have failed every rally to get above it.
It's literally been 22 years since the dollar has closed a monthly candle above the 0.618 , showing incredible weakness. In January 2017 we had our first attempt since 1999 and failed.
Now the US dollar is facing the 8/1 Gann ratio and breaking that is not going to be easy. As you can see two amazing reactions of this Gann Fans literally catching the top wick in January 2017 and March 2020. Amazing reaction so far , from my experience with Gann Fans a double rejection of the 8/1 Gann is extremely bearish. If it had any real strength it should have broken it by second attempt.
I have also set a Fib time sequence using the impulse wave from 1999 down to 2003 and as you can see we get an interesting timeline of events, not amazing reactions but pretty decent. The next date is April 2024, Could be the year the next rejection of the 8/1 Gann Fan?
With massive bearish divergence on the Dow Jones something big is coming take a look below at the 6month chart on the RSI
Massive bearish divergence it's there and its building up with a possible conclusion July 2024 ,I cover this in my TA below
So will the Dollar be rejected at the 8/1 Gann Mid 2024 for the third time? If so, expect a move down to 82 dollars.

Dollar seems to start dropping TVC:DXY
Hey everyone , I wish you have a profitable week
So as we see in the chart , dollar index looks more bearish now and I think the rally is over and base is already created , and now we go for drop
I personally expect nice growth on AUD , GBP
What is your idea about Dollar index ??
mention your view in comments

DOLLAR INDEX CHART ANALYSIS.....
This week DXY chart held critical situation.
If DXY chart breakout 96.600 resistance level then market goes up to
96.870 & 97.294 resistance level.
If break out 95.800 support level then market goes down to 95.515 & 95.250
support level.
HOPE FULLY BUY POSSITIVE.

The Dollar and dead presidents (Update)Here we have a chart on the DXY. Although we have had a move back up it might be short lived as the trend over time is down. Investors aren't collecting cash the yare buying assets with it. the trend is valid until it's broken. AS you can clearly see it's valid since the early 70's (50 years now) so it's long term trend.
The move down we have had since 2020 print of the multiple trillions (40% of all dollars ever printed) was minimal. For me it looks like the big move down has still yet to come especially as they are most likely printing even more.
I've also added the RSI indicator with the chart. It shows a pennant formation which eventually either breaks down or up. That is usually determined by the initial move into it.
Not financial advice.
Cash is Trash - Ray Dalio

$Dollar$ index 4hr chartDollar index should find support this week. Look for a long opportunity at those levels. The Dollar is the valuation of most things, so this dictates future prices.

XAUUSD (Gold) Daily Analysis : Bull or Bear ?Examining the gold's chart ( XAUUSD ) in daily timeframes, we see that the price is in a trading range after the break of the uptrend and is fluctuating in the same range.
We see that the price has rebounded (pullback) to the broken level. We have to see if the price will succeed in breaking its next dynamic support with the start of the new trading week or not .
Exiting the price below or above this range could determine the possible future trend of the Gold ( XAUUSD ) .
The bearish targets will be $1760 and $1726 and $ 1707 respectively .
Follow our other analysis & Feel free to ask any questions you have, we are here to help.
⚠️ This Analysis will be updated ...
👤 Arman Shaban : @ArmanShabanTrading
📅 12.DEC.2021
⚠️(DYOR)
❤️ If you apperciate my work , Please like and comment , It Keeps me motivated to do better ❤️

10-year interest rate for the dollar index compared to the dollaThe fall in the 10-year interest rate for the dollar index from 10 percent to one percent heralds a strong decline in the dollar in 2022

DXY chart held on critical situation.....
07 DECEMBER 2021
DOLLAR INDEX MY VIEW-
N.B-This week DXY chart held critical situation.
If DXY chart breakout 96.600 resistance level then market goes up to
96.870 & 97.294 resistance level.
If break out 96.00 support level then market goes down to 95.700 & 95.00
support level.
AronnoFX will not accept any liability for loss or damage as a result of
reliance on the information contained within this channel including
data, quotes, charts and buy/sell signals
If you like this idea, do not forget to support with a like and follow.
Traders, if you like this idea or have your own opinion about it,
write in the comments. I will be glad.

dollar index try touch fibo 61% AC daily is green ,it show dollar can go up (+ trend can start)
but then dollar index 50% can crash to 80.00
we advice buy in green arrow and sellimit on pink arrow
93.00 is very important , if it break ,dollar can crash wild (eurusd and gold will fly up)

Dollar Index DXY - Correction due downside comingDXY - Daily - Price action calling for a deep correction on dollar index and across all US major pairs. I see a 150-200 pips pullback on DXY before a continuation of the bullish trend on dollar weekly.
