Dollar Index Exhibiting Strong Bullish SignalsThis may be my second or third time analyzing the dollar index, so bear with me on this latest go. Looking at the weekly chart, especially in the last year or so, we see there is strong evidence of a reverse head and shoulders, only that the left shoulder is still to be formed. But, the reverse left shoulder aside we still have another strong bullish indicator, the cup and handle forming. Which ever way you look at it there's a tone of technical evidence that the dollar index is fixing to weaken relative to the currencies that comprise it. This doesn't bode well for the proponents of the most recent "trade war" between the U.S., China, and Europe. With U.S. goods becoming more expensive relative to the rest of the world and the anticipation of higher prices from the tariffs imposed from those aforementioned countries; demand will lessen for U.S. goods both internationally and domestically and this has the makings of a inflationary slow-down in the economy, which is the worst type of recession.
Dollar_index

Stop hunt, False Break and a Pinbar - The Dollar is going downI've been writing about the option of a bearish correction wave in DXY in the recent weeks.
Last week's stop hunt leads me to think that this time it will break down and continue towards the 200 MA line.
All it needs now is to break the short term support....

DOLLAR INDEX NEXT MOVE... No any strong sign to short DXY yet... wait for daily closure to confirm
if daily close strongly above 95.00, indicate a good bullish momentum still in the market.
otherwise a spike above 95.00, indicate a weak bullish momentum start happening.
Market will swift away around.
So be careful with shorting too earlier...
Aim for better entry price..
overall DXY is bullish to me till this point despite all the news about trade war...
US market is position itself for greater year ahead into 2018-2019
while China market will assist on this while consolidate its overprice market for a better healthier market.
Longest bull market in history in making.
GREAT FEAR vs GREAT GREED

DXY continue to the downside?? Daily candle closed bearish, we could see a little pullback and then continue the bearish movement until 93.50 region

Dollar Index ResistanceHey traders! Hope you're having a good day wherever in the world you are :) So today I bring forth to you the dollar index which just doesn't seem like it doesn't want to give up it's monstrous run up in the past few weeks... until now I hope. I've drawn in what I think might be a good area of resistance and you know what that means. Time to look for shorting or long opportunities that are paired with the dollar and/or even commodities such as Oil, gold, etc.
So get to it and lets make some $$$$.

DXY week 26th of 2018On chat today, DXY looking finding support at 94.50 level & resume back its way to north.
Its Monday, after London Open, price went retrace slightly. to 94.50 area again.
Anticipate when NY open today, to see price resume its way back to north.
If other way round, price broke 94.50 and going south to 94.20.
So let's see what move next.


DXY Long (scalp)Dollar to rally up to touch 95.00. Fundamentals are showing an aggressive growth in the economy in terms of todays release of PPI. Will post updates on this.

DXY Possible H&S Formation With Perfect Retest Level TargetI am looking a a possible Head And Shoulders formation on the Dollar Index. Should this setup unfold as I have it here, the target happens to be on a perfect retest level as well. Simple and clean setup which could give some good direction on some other pairs as well.
Contact me via direct message for any assistance required
Happy trading!
Linton

3 reasons to sell the dollar todayNot so often there are days when you can say with almost 100% certainty that this is a day of great movement. So today is just one of those days. Too many crucial things happen on this Friday.
First, the US tariffs against China ($ 34 billion) since today are reality. China, in its turn, introduces counter tariffs. In fact, this means war. Especially because Europeans are on the line, and the rest of the world as well. And although the issue of applying the protectionist foreign economic policy is ambiguous and has not quite obvious effects, nevertheless, most experts agree that the world economy will lose from this. And it can lose so seriously that a new world crisis will begin. The fact that the shares in Asia have updated the nine-month lows on the eve of July 6 suggest that these opinions did not arise from scratch.
Secondly, today's statistics on the US labor market can quite unpleasantly surprise the markets. That is, we do not expect devastating data (there was simply no serious reason for this during the reporting period), but the markets are already so spoiled by excellent data from US that even a small negative deviation can well provoke a sell-off of the dollar. The United States is in fact trapped in the "ideal". Because it's impossible to stamp records always. Sooner or later, Akela will miss. The unemployment rate has reached the level of 3.8%. The occasion for optimism. So, it is so, but if you recall the course of macroeconomics, then there is such a thing as "natural unemployment". That is, the level of the labor supply, which provides an opportunity for further economic growth, since 100% deprivation deprives the economy of opportunities for growth (at least extensive). Estimates of the level of natural unemployment vary, but the consensus is somewhere around 4-5%. As you can see, the USA has already fallen below the critical level. That is, the possibilities of quantitative growth are limited. But the NFP indicator is just the quantitative growth and there is almost no space for it. So, the US will be very difficult to maintain the growth rate of new jobs at + 200K per month.
And finally, as we said earlier, there are purely technica reasons, if you look at the Dollar Index chart, you can see its inability to overcome the key resistance 95 and see signs of a nascent correction: consolidation at the top, the formation of reversal graphical patterns, candlestick signals, in a neutral-negative state (see the KenJi and TDI indications), etc.
So, we believe that the chances of a dollar increase are small, but the probability of correction is great. Therefore, we recommend selling the dollar on all fronts. The minimum target for correction for the Dollar Index is 93.30. But very likely and descent to area 90 in the foreseeable future.

dollar index technical analysis #DXThe risk of falling prices due to the development of a ending diagonal pattern

dollar index bull flagI see a nice bullish flag pattern has formed, price has broken the shorter term exhaustion to the upside and we can continue to see a stronger dollar with the push

Interesting pullback from the resistance zone. Whats next ?Hi guys, looks like we couldn`t close higher then our strong resistance line a couple days ago. Now I think that we are going to challenge the SMA 50, we may find support earlier at 93.20 $ (the latest bounce to the resistance line). Lets see what happens !

Dollar Index - third waveIt seems like we're going to have the third wave inside the fifth wave within the next few hours.

A Second Head and Shoulders FormingIt looks like the there's a second head and shoulders forming on the U.S. Dollar index. This comes with all the news with the potential trade wars and the GLD ETF is starting to look bullish with new higher lows which only bolsters the evidence.

DXY Weekly IdeaDXY Weekly Idea
Wait for confirming whether break zone line or not.
Case 1-> Break zone then placing Long
Case 2-> Not break zone then placing Short

DXY Monthly TADollar Index is at Downtrend don't forget it! Also Time Cycles are so obvious!!!! Time period is 16 years. It is time to short US Dollar....Big investor said that time rhymes.....For long-term short US Dollar...News are for losers!

UPDATE: Don't take excessive risk during stormy waters, EURUSDHi guys, thank you for the support! I will have this analysis out each weekend as well as daily updates throughout the week, if you guys like what I'm doing hit the "follow" button and you will get a notification each time I post a video or chart!
Have a great day everyone!

UPDATE: What happends to GBPUSD with Brexit vote?Hi guys, thank you for the support! I will have this analysis out each weekend as well as daily updates throughout the week, if you guys like what I'm doing hit the "follow" button and you will get a notification each time I post a video or chart!
Have a great day everyone!

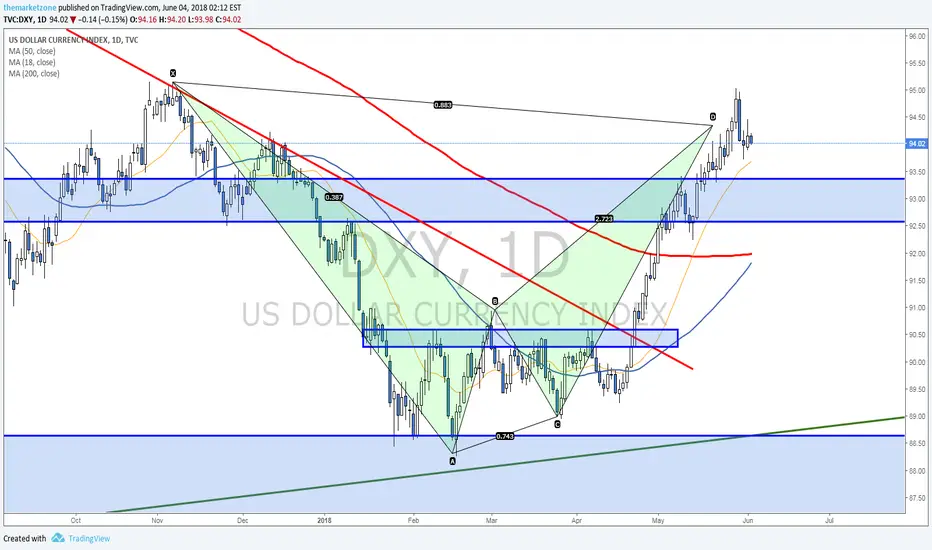
Reversal pattern confirmedThe bearish Bat pattern was confirmed last week with a strong bearish reaction to the PRZ.
The Dollar is still above support (!) but it looks like near term trades should focus on counter Dollar opportunities.
Do you agree?
[DOLLAR INDEX] UPDATESThe dollar index will be the driver for the next week, geo-political tensions, trade war and some economic data will still move the market in the short term. From a technical point of view, the index has reached our bearish target around 88.50, and from this area has triggered a good rally. With this in mind, what's next? To find some answers, we must remember what we said two years ago, do you remember? Open the chart below:
If the Fed does not change monetary policy, this view could be correct... what do you think?
If you think this analysis can be useful, leave a your comment or your ILIKE!
Thank you for support and trade with care!

Trading Perspective on The US Dollar (June 3 – June 9)Trading Perspective on The US Dollar (June 3 – June 9): Bullish
Fundamental Forecast for The USD: Bullish
The Greenback got a week full of good news. U.S. economic indicators coming in so positively, notably Unemployment Rate falling to an 18-year low of 3.8% coupled with Nonfarm payrolls beating economists’ expectations (223,000 versus 188,000) continued to underpin the Fed’s tightening plan, and would continue to support US Dollar’s strength in the coming week. The rate hike probability in the next FOMC meeting on June 13 increased to 91.3%.
Trade War will be the main topic for the week ahead as there will be few U.S. high-profile economic data releases printing. This week witnessed the US announce a decision to allow steel and aluminum tariff exemptions for several of its staunch allies. With G7 leaders meeting in Canada next week, this hot spot will surely be put on the agenda. However, whether the posture calms or escalates, bullish sentiment on the US Dollar will likely dominate.
Technical Forecast for The USD: Bullish
The USD posted a breakout failure as expected. However, risk appetite was back in play due to lots of positive announcements, leading the benchmark currency to test back the 94.24 barrier twice in the final two days of the week. Bulls seemingly continued to prevail, suggesting for a possible break above this level in the near-term. The target is predefined at the vicinity of 95.11.
Follow me to get more analysis.

Dollar Index - ending diagonalIt's likely that the fifth wave is takin the form of an ending diagonal, so we're going to have a downward correction pretty soon.
