Dollar_index


DXY - make or break time, watch for EURUSD etcIf we see that price holds above the cloud then a further bullish move higher could follow, see targets on chart. This might be bearish for EURUSD, Gold and Silver.

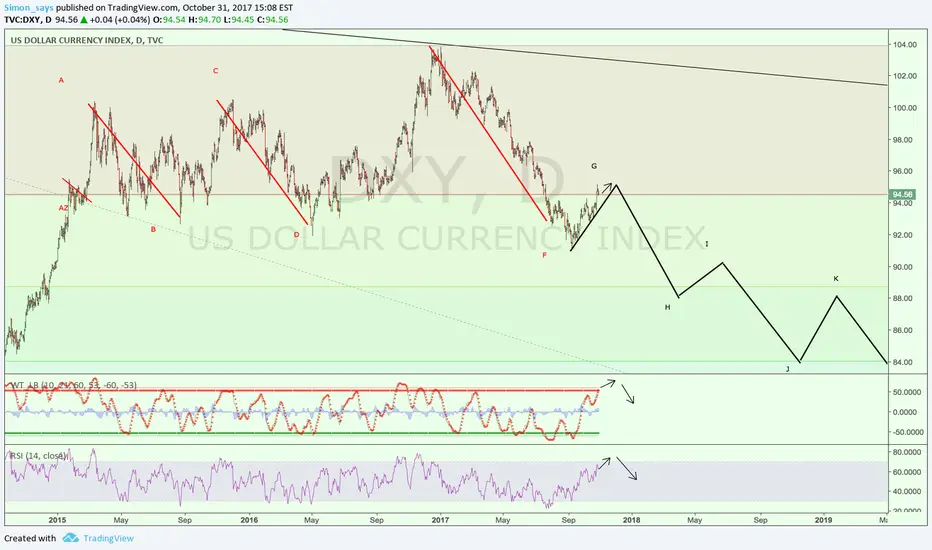
DXY 1W - Elliott waves - updateDecided to make an update on my last plot of DXY from 24th Aug '17 (chart below).
So far, everything looks good!!
We are still in F -> G move I'm expecting price continue to move up until December 2017.
Reasons for that: in short-term Trump will announce new Fed chair, in long-term expectations of FED to hike rates by 25bp.
XAUUSD (gold) will trade in opposite direction as DXY, it means XAUUSD will move down until rate hikes.
Expecting XAUUSD to move strongly up next year, while DXY will go south G -> H move.
USD Index - Uptrend Intact Despite CorrectionLast week price pulled back towards broken resistance area turning support at 94.030. We see this as a correction pointing to further advances as still being the higher probability move.

Dollar Index (DXY) – Bearish Minor 5 – Trend ContinuationDollar Index (DXY) – Bearish Minor 5 – Trend Continuation
Dollar Index (DXY) bounced off the Reversal Area pointed out in the previous “Dollar-Index-DXY – Market Crash Road Map – Full Elliott Wave Cycle” and commenced the Corrective Pattern for Minor 4 (red).
It seems like the Dollar Index (DXY) is approaching what is called the “Golden Section” in Elliott Wave Analysis which acts as a Point of Interest or Vibration Level, drawing the Price Action towards it as a magnet. Golden Section usually acts as Trend Continuation Levels, in the Dollar’s case a Bearish Trend Continuation for Minor 5 (red).
If the above would be correct, then the Dollar Index (DXY) could resume the Dominant Trend and finalize Minor 5 (red) and with it the entire Intermediate (C) leg (turquoise), thus completing the Cycle in Primary Wave A (blue).
Dollar Index (DXY) – Corrective Minor 4 – Wave Analysis:
• Minute A (blue) commenced on the up-side showing a 3 Swing Sequence in its Minuette ABC Sub-Waves (orange).
Minuette (a) (orange) shows a typical 5 Swings Motive Structure.
Minuette (b) (orange) shows a deep pull-back in a Zig-Zag Pattern.
Minuette (c) (orange) shows an Extension, which took a form of an Wedge, making the entire Minute A (blue) develop as a Leading Diagonal for the overall Corrective Structure.
• Minute B (blue) retraced as a Triple Three Pattern, showing a Complex Structure in its Minuette WXYXZ Sub-Waves (purple).
• Minute C (blue) is possibly taking form of an Expanding Ending Diagonal, with 2 legs awaiting to finalize, which are Minuettes (iv) & (v) (black).
A Bearish Divergence would be awaited at the end of Minuette (v) (black).

USDSEK - FOLLOWING THE DOLLARIVE DECIDED TO POST FREE TRADE SIGNALS FOR A WEEK. YOUR WELCOME.
THE FOLLOWING IS WHERE THE TRADE WILL TAKE PLACE FOR THE SELL
HEADING TO WAVE 5!!!
USDSEK SELL STOP
ENTRY - 8.37
SL 8.46200
TP 8.04
TP 7.88
TP 7.65

DXY - DOLLAR ON THE MOVEIVE DECIDED TO POST FREE TRADE SIGNALS FOR A WEEK. YOUR WELCOME.
THE FOLLOWING IS WHERE THE TRADE WILL TAKE PLACE FOR THE SELL
DXY SELL
SELL AT -94.700
SL 95.55
TP 92.59
TP 92.30
TP 88.17

Dollar Index - ending diagonalIt seems like wave v of (iii) is going to take the form of an ending diagonal pattern.

DXY reversal. Could go to 97.50ishLooks like DXy has completed a head and shoulders reversal pattern.
MAs crossed over. MACD in bullish momentum.
Could go test 96.60 (200 day MA) and go beyond to 97.50ish

USD Index - Advance Into Resistance ExpectedWe start the week with price having rejected from the previous area of resistance turned support at 94.030 and is now looking to test next key resistance at 95.270. Next major resistance to the upside after 95.270 sits at 96.695.


USD Index - Breakout Hints At Further AdvancesWe start the week with the USD Index above key resistance of 94.030 hinting at further advances in the USD Index. A pullback and re-test of the 94.030 will provide a great chance to look for Bullish formations and patterns towards the target and next key area of resistance at 95.270

New Daily demand zone being created on Dollar Index around 94New Daily demand zone being created on Dollar Index around 94. Weekly supply level eliminated, long bias at Daily and Weekly demand levels

USD Index/DXY SHORT PROJECT (Daily)Good day, All!
The daily bearish DXY project is currently forming.
Once point 5 is shaped, it can provide quite an interesting short opportunity.
If this pattern works, it may also signify the continuation of the major bearish trend which started back in the beginning of 2017:

DXY - Daily Outlook - Inverse H&SDXY forming inverse heads and shoulders on the daily time frame, looking to extend to 96.30

DOES THE USD APPRECIATION MEAN BTC FALL?I expect the USD will appreciate in 2018, which may subdue the appreciation of BTC.

Not convinced on USD Strength...Looking at the technicals, DXY has attempted to break the fib line more than once. If you look at USD JPY it has tried to penetrate the 114.40 a few times. We are not far from 114.40 again or far from 94.00. If DXY breaks 94 and USDJPY breaks 114.40 then great, on we go...

USD Index - Breakout Of Resistance Hints At Further AdvancesWe start the week with the USD Index above key resistance at 93.455 leading to a Bullish bias in this market next week. A failure of resistance would pave the way for a re-test of support at 92.635 however as long as we remain above 93.455 we will only be looking for longs in the USD Index next week.


Dollar Index - More room to fall back before Bullish Movement?DXY Daily:
- Inverted Head and Shoulders on the daily. Would like to see a break of the neckline before making any big decisions on the USD Pairs
- Break and Retest of the descending channel
- Counter trendline being respected well currently
- Completion of right shoulder matches up with 0.5 / 61.8 fib retracement

DXY Dollar index need correction before December ratehike decideNeed to fall channel retest and collect power to break resistances.If you like please support with like and fallow.Thanks Check my other charts...
