“The Dollar Job: Break-In Strategy for 99+ Profits”💸 “DXY Heist Blueprint: Thieves’ Bullish Breakout Play” 🏴☠️
🌟Hi! Hola! Ola! Bonjour! Hallo! Marhaba!🌟
Welcome, Money Makers & Silent Robbers 🕶️💼✨
This is our next big Thief Trading Heist Plan targeting the 💵 DXY Dollar Index Vault. Armed with both technical precision 🔍 and fundamental insight 📊, we're ready to strike smart — not just fast.
🎯 THE MASTER HEIST PLAN:
🟢 ENTRY POINT – “Heist Entry Protocol”
🎯 Wait for price to break above Resistance @ 99.000 and candle to close ✅
💥 Plan A: Place Buy Stop Orders just above breakout
📥 Plan B: For Pullback Pros, use Buy Limit at recent swing low/high (15m–30m TF)
📌 Tip: Set alerts — don’t get caught napping while the vault opens! ⏰🔔
🛑 STOP LOSS – “Thief’s Escape Hatch”
🧠 Use 4H swing low at 98.100 as SL
⚖️ Adjust based on your lot size and number of open positions
🚨 Don't rush to set SL for Buy Stop entries before confirmation! Patience is part of the plan. 😎
🎯 TARGET – “Mission Objective”
💰 First Exit Target: 100.000
🏃♂️ Optional: Escape earlier near high-risk zones (Blue MA Line Trap Area)
⚔️ SCALPERS' CODE – Stay Sharp!
Only scalp on the Long side.
🔐 Use Trailing SL to guard your loot!
💸 Big wallets? Jump early.
🧠 Smaller stack? Follow the swing crew for coordinated execution.
🌐 MARKET OUTLOOK: WHY THE VAULT’S OPENING
💡 Currently seeing bullish momentum in the DXY
📈 Driven by macroeconomics, sentiment shifts, and intermarket pressure
📰 Want the full debrief? Check our analysis across:
COT Data
Geopolitics & News
Macro Trends & Sentiment
Fundamental Forces
📎🔗 See full breakdown
⚠️ TRADE MANAGEMENT ALERT
🚫 Avoid opening new trades during high-impact news
🔁 Always use Trailing Stops to lock in profits
❤️ Support The Heist – Boost the Plan!
Every boost powers our underground crew 🐱👤.
We rob the markets, not the people. 💼💰
Like & Boost to help grow the Thief Trading Gang 👊💥
Stay tuned, robbers – more heist plans dropping soon.
💸🚀📈🤑
Dollarcostaverage

Warren Buffett's Approach to Long-Term Wealth BuildingUnderstanding Value Investing: Warren Buffett's Educational Approach to Long-Term Wealth Building
Learn the educational principles behind value investing and dollar-cost averaging strategies, based on historical market data and Warren Buffett's documented investment philosophy.
---
Introduction: The Million-Dollar Question Every Investor Asks
Warren Buffett—the Oracle of Omaha—has consistently advocated that index fund investing provides a simple, educational approach to long-term wealth building for most investors.
His famous 2007 bet against hedge funds proved this principle in dramatic fashion: Buffett wagered $1 million that a basic S&P 500 index fund would outperform a collection of hedge funds over 10 years. He crushed them. The S&P 500 returned 7.1% annually while the hedge funds averaged just 2.2%.
Today, we'll explore the educational principles behind this approach—examining historical data, mathematical concepts, and implementation strategies for learning purposes.
---
Part 1: Understanding Value Investing for Modern Markets
Value investing isn't about finding the next GameStop or Tesla. It's about buying quality assets at attractive prices and holding them for compound growth .
For beginners, this translates to:
Broad Market Exposure: Own a cross-section of businesses through low-cost index funds
Long-term Perspective: Think decades, not months
Disciplined Approach: Systematic investing regardless of market noise
"Time is the friend of the wonderful business, the enemy of the mediocre." - Warren Buffett
Real-World Application:
Instead of trying to pick between NASDAQ:AAPL , NASDAQ:MSFT , or NASDAQ:GOOGL , you simply buy AMEX:SPY (SPDR S&P 500 ETF) and own pieces of all 500 companies automatically.
---
Part 2: Dollar-Cost Averaging - Your Secret Weapon Against Market Timing
The Problem: Everyone tries to time the market. Studies show that even professional investors get this wrong 70% of the time.
The Solution: Dollar-Cost Averaging (DCA) eliminates timing risk entirely.
How DCA Works:
Decide on your total investment amount (e.g., $24,000)
Split it into equal parts (e.g., 12 months = $2,000/month)
Invest the same amount on the same day each month
Ignore market fluctuations completely
DCA in Action - Real Example:
Let's say you started DCA into AMEX:SPY in January 2022 (right before the bear market):
January 2022: AMEX:SPY at $450 → You buy $1,000 worth (2.22 shares)
June 2022: AMEX:SPY at $380 → You buy $1,000 worth (2.63 shares)
December 2022: AMEX:SPY at $385 → You buy $1,000 worth (2.60 shares)
Result: Your average cost per share was $405, significantly better than the $450 you would have paid with a lump sum in January.
---
Part 3: The Mathematics of Wealth Creation
Here's where value investing gets exciting. Let's run the actual numbers using historical S&P 500 returns:
Historical Performance:
- Average Annual Return: 10.3% (1957-2023)
- Inflation-Adjusted: ~6-7% real returns
- Conservative Estimate: 8% for planning purposes
Scenario 1: The $24K Start
Initial Investment: $24,000 | Annual Addition: $2,400 | Return: 8%
Calculation Summary:
- Initial Investment: $24,000
- Annual Contribution: $2,400 ($200/month)
- Expected Return: 8%
- Time Period: 20 years
Results:
- Year 10 Balance: $86,581
- Year 20 Balance: $221,692
- Total Contributed: $72,000
- Investment Gains: $149,692
Scenario 2: The Aggressive Investor
Initial Investment: $60,000 | Annual Addition: $6,000 | Return: 10%
Historical example after 20 years: $747,300
- Total Contributed: $180,000
- Calculated Investment Gains: $567,300
Educational Insight on Compound Returns:
This historical example illustrates how 2% higher returns (10% vs 8%) could dramatically impact long-term outcomes. This is why even small differences in return rates can create life-changing wealth over decades. The mathematics of compound growth are both simple and incredibly powerful.
---
Part 4: Investing vs. Savings - The Shocking Truth
Let's compare the same contributions invested in stocks vs. a high-yield savings account:
20-Year Comparison:
- Stock Investment (8% return): $221,692
- High-Yield Savings (5% return): $143,037
- Difference: $78,655 (55% more wealth!)
"Compound interest is the eighth wonder of the world. He who understands it, earns it... he who doesn't, pays it." - Often attributed to Einstein
Key Insight: That extra 3% annual return created an additional $78,655 over 20 years. Over 30-40 years, this difference becomes truly life-changing.
📍 Global Savings Reality - The Investment Advantage Worldwide:
The power of index fund investing becomes even more dramatic when we examine savings rates around the world. Here's how the same $24K initial + $2,400 annual investment compares globally:
🇯🇵 Japan (0.5% savings):
- Stock Investment: $221,692
- Savings Account: $76,868
- Advantage: $144,824 (188% more wealth)
🇪🇺 Western Europe Average (3% savings):
- Stock Investment: $221,692
- Savings Account: $107,834
- Advantage: $113,858 (106% more wealth)
🇬🇷 Greece/Southern Europe (2% savings):
- Stock Investment: $221,692
- Savings Account: $93,975
- Advantage: $127,717 (136% more wealth)
🇰🇷 South Korea (2.5% savings):
- Stock Investment: $221,692
- Savings Account: $100,634
- Advantage: $121,058 (120% more wealth)
💡 The Global Lesson:
The lower your country's savings rates, the MORE dramatic the advantage of global index fund investing becomes. For investors in countries with minimal savings returns, staying in cash is essentially guaranteed wealth destruction when compared to broad market investing.
This is exactly why Warren Buffett's advice transcends borders - mathematical principles of compound growth work the same whether you're in New York, London, or Athens.
Note: Savings rates shown are approximate regional averages and may vary by institution and current market conditions. Always check current rates in your specific market for precise calculations.
---
Part 5: Building Your Value Investing Portfolio
Core Holdings (80% of portfolio):
AMEX:SPY - S&P 500 ETF (Large-cap US stocks)
AMEX:VTI - Total Stock Market ETF (Broader US exposure)
LSE:VUAA - S&P 500 UCITS Accumulating (Tax-efficient for international investors)
Satellite Holdings (20% of portfolio):
NASDAQ:QQQ - Technology-focused (Higher growth potential)
AMEX:VYM - Dividend-focused (Income generation)
NYSE:BRK.B - Berkshire Hathaway (Value investing & diversification)
---
Part 6: Implementation Strategy - Your Action Plan
Month 1: Foundation
Open a brokerage account (research low-cost brokers available in your region)
Set up automatic transfers from your bank
Buy your first AMEX:SPY shares
💡 Broker Selection Considerations:
Traditional Brokers: Interactive Brokers, Fidelity, Vanguard, Schwab
Digital Platforms: Revolut, Trading 212, eToro (check availability in your country)
Key Factors: Low fees, ETF access, automatic investing features, regulatory protection
Research: Compare costs and features for your specific location/needs
Month 2-12: Execution
Invest the same amount on the same day each month
Ignore market news and volatility
Track your progress in a simple spreadsheet
Year 2+: Optimization
Increase contributions with salary increases
Consider additional core holdings like LSE:VUAA for tax efficiency
Consider tax-loss harvesting opportunities
Visualizing Your DCA Strategy
Understanding DCA concepts is easier when you can visualize the results. TradingView offers various tools to help you understand investment strategies, including DCA tracking indicators like the DCA Investment Tracker Pro which help visualize long-term investment concepts.
🎯 Key Visualization Features:
These types of tools typically help visualize:
Historical Analysis: How your strategy would have performed using real market data
Growth Projections: Educational scenarios showing potential long-term outcomes
Performance Comparison: Comparing actual vs theoretical DCA performance
Volatility Understanding: How different stocks behave with DCA over time
📊 Real-World Examples from Live Users:
Stable Index Investing Success:
AMEX:SPY (S&P 500) Example: $60K initial + $500/month starting 2020. The indicator shows SPY's historical 10%+ returns, demonstrating how consistent broad market investing builds wealth over time. Notice the smooth theoretical growth line vs actual performance tracking.
Value Investing Approach:
NYSE:BRK.B (Berkshire Hathaway): Warren Buffett's legendary performance through DCA lens. The indicator demonstrates how quality value companies compound wealth over decades. Lower volatility = standard CAGR calculations used.
High-Volatility Stock Management:
NASDAQ:NVDA (NVIDIA): Shows smart volatility detection in action. NVIDIA's explosive AI boom creates extreme years that trigger automatic switch to "Median (High Vol): 50%" calculations for conservative projections, protecting against unrealistic future estimates.
Tech Stock Long-Term Analysis:
NASDAQ:META (Meta Platforms): Despite being a tech stock and experiencing the 2022 crash, META's 10-year history shows consistent enough performance (23.98% CAGR) that volatility detection doesn't trigger. Standard CAGR calculations demonstrate stable long-term growth.
⚡ Educational Application:
When using visualization tools on TradingView:
Select Your Asset: Choose the stock/ETF you want to analyze (like AMEX:SPY )
Input Parameters: Enter your investment amounts and time periods
Study Historical Data: See how your strategy would have performed in real markets
Understand Projections: Learn from educational growth scenarios
🎓 Educational Benefits:
This tool helps you understand:
- How compound growth actually works in real markets
- The difference between volatile and stable investment returns
- Why consistent DCA often outperforms timing strategies
- How your current performance compares to historical market patterns
- The visual power of long-term wealth building
As Warren Buffett said: "Someone's sitting in the shade today because someone planted a tree a long time ago." This tool helps you visualize your financial tree growing over time through actual market data and educational projections.
---
Part 7: Common Mistakes to Avoid
The "Perfect Timing" Trap
Waiting for the "perfect" entry point often means missing years of compound growth. Time in the market beats timing the market.
The "Hot Stock" Temptation
Chasing individual stocks like NASDAQ:NVDA or NASDAQ:TSLA might seem exciting, but it introduces unnecessary risk for beginners.
The "Market Crash" Panic
Every bear market feels like "this time is different." Historical data shows that patient investors who continued their DCA through 2008, 2020, and other crashes were handsomely rewarded.
---
Conclusion: Your Path to Financial Freedom
Value investing through broad index funds and dollar-cost averaging isn't glamorous. You won't get rich overnight, and you won't have exciting stories about your latest trade.
But here's what you will have:
Proven strategy backed by decades of data
Peace of mind during market volatility
Compound growth working in your favor 24/7
A realistic path to serious wealth creation
The Bottom Line: Warren Buffett's approach works because it's simple, sustainable, and based on fundamental economic principles. Start today, stay consistent, and let compound growth do the heavy lifting.
"Someone's sitting in the shade today because someone planted a tree a long time ago." - Warren Buffett
Educational Summary:
Understanding these principles provides a foundation for informed decision-making. As Warren Buffett noted: "The best time to plant a tree was 20 years ago. The second-best time is now" - emphasizing the educational value of understanding long-term investment principles early.
---
🙏 Personal Note & Acknowledgment
This article was not entirely my own work, but the result of artificial intelligence in-depth research and information gathering. I fine-tuned and brought it to my own vision and ideas. While working with AI, I found this research so valuable for myself that I could not avoid sharing it with all of you.
I hope this perspective gives you a different approach to long-term investing. It completely changed my style of thinking and my approach to the markets. As a father of 3 kids, I'm always seeking the best investment strategies for our future. While I was aware of the power of compound interest, I could never truly visualize its actual power.
That's exactly why I also created the open-source DCA Investment Tracker Pro indicator - so everyone can see and visualize the benefits of choosing a long, steady investment approach. Being able to see compound growth in action makes all the difference in staying committed to a strategy.
As someone truly said: compound interest is the 8th wonder of the world.
---
Disclaimer: This article is for educational purposes only and does not constitute financial advice. Past performance does not guarantee future results. Always consult with a qualified financial advisor before making investment decisions.

Dogecoin (DOGE) OverboughtI have been trading for a long time using the DCA strategy indicator that I have developed and I have recently published the indicator on my Tradingview page.
According to this indicator, I have been buying DOGEs at support levels with more money than I would have thrown away so far. This support level is generally seen at $0.056. In addition, I dumped some of my DOGE at $0.2285, but then bought again at $0.107. I have already shared this analysis.
I think that DOGE, which has broken through two resistances, will advance at least up to $0.75 (potential 89% return). But for this progress, I think that it must first find support at the $0.2285 level, which was broken again. This is because the indicator also gives an overbought signal. Therefore, I will tailor my portfolio accordingly. But I wouldn't be surprised if it continues relentlessly.
As long as Elon Musk remains in government, I think this cryptocurrency will be on a continuous upward trend.

What Is Dollar-Cost Averaging (DCA) in Investing and Trading?What Is Dollar-Cost Averaging (DCA) in Investing and Trading?
Dollar-cost averaging (DCA) is a popular strategy used by investors and traders to manage market fluctuations and build positions over time. Instead of trying to time the market, DCA focuses on consistent, regular investments regardless of price movements. This article answers “What is DCA?”, its advantages and limitations, and how it can be applied in both investing and trading.
What Is Dollar-Cost Averaging (DCA)?
So what is DCA investing? Dollar-cost averaging (DCA) is a strategy that involves consistently investing a fixed sum at regular intervals, regardless of the asset’s current price. This approach helps distribute the cost of purchases over time, potentially reducing the impact of short-term price fluctuations. Instead of trying to time the market perfectly—a challenging task even for experienced traders—a dollar-cost averaging strategy focuses on regular contributions to average the cost of assets.
This method offers a straightforward, disciplined strategy for both long-term investors and traders who wish to build or adjust positions gradually. By spreading out purchases, a DCA strategy may help mitigate the effects of market volatility. For example, during a period of market decline, the fixed investment buys more units at a lower cost, which could result in higher returns when prices recover. Conversely, during a sustained rise, the investor buys fewer units, which helps avoid overexposure. For example, if you invest $50 every week and the market is rising, you will buy fewer stocks, but when the market is moving down, you will buy more with the same amount.
What does DCA mean for market participants? DCA is particularly useful in uncertain economic environments where price swings are common. It provides a systematic approach to entering the market, removing the need to make snap decisions based on short-term market movements, and fostering a steady accumulation of assets over time.
How Does DCA Work?
DCA investing operates by establishing a regular schedule for investing a set amount of money into a chosen asset, regardless of its current market price. Instead of waiting for a particular price or market condition, funds are allocated at consistent intervals—be it weekly, monthly, or quarterly. Over time, this means buying more units when prices are lower and fewer units when prices are higher, resulting in an average purchase price that can be lower than if the investment was made in one lump sum.
Consider an investor using DCA. They commit £100 every month to buy company shares. In the first month, the share price is £20, so they purchase 5 shares. The next month, the price drops to £10, allowing them to buy 10 shares with the same £100. In the third month, the price rises to £25, and they purchase 4 shares.
Over three months, the investor has spent £300 and acquired 19 shares in total. To calculate the average cost per share, divide £300 by 19, which equals approximately £15.79 per share. This average is lower than the highest price paid and reflects the effect of buying more shares when prices are low and fewer when prices are high.
DCA also simplifies the process of entering the market. By adhering to a set timetable, investors bypass the need for constant market analysis, making it particularly appealing for those who prefer a more hands-off strategy. This systematic approach can be applied not only to traditional investments like shares and funds but also to other assets that traders and investors engage with.
DCA in Trading
DCA isn't just for long-term investors; traders can also employ it to navigate the ups and downs of fast-moving markets. By spreading out their entries or exits, traders may potentially lower the average cost of a position or build on a winning trend, all while managing their exposure to volatile moves.
Lowering the Average Price
For traders facing a position that's moving against them, DCA offers a way to adjust the average entry cost. By allocating additional funds, the average price of the position may be reduced. This approach can create a potential opportunity to exit with better returns if the market reverses. However, it is important to note that this method also increases exposure, and additional entities might compound losses if the trend continues.
Adding to a Winner
Conversely, traders may apply DCA to increase their positions when an asset shows strength. By gradually adding to an effective trade, the overall exposure is built in a controlled manner, potentially capturing further movement without committing all capital at once. This method is particularly popular in markets where momentum builds slowly, allowing traders to gradually take advantage of the sustained trend.
Applications Across Markets
Using DCA in stocks can help manage entries during periods of volatility, especially when market sentiment shifts rapidly. Forex traders often use similar techniques to adjust positions in response to fluctuating currency pairs, while the high volatility seen in crypto* markets makes DCA an appealing strategy for building positions gradually.
When using DCA in trading, a disciplined approach is essential. Whether lowering the average cost in a losing position or building on an effective trade, traders should carefully consider the additional risk that comes with increased exposure.
Advantages of Dollar-Cost Averaging
Dollar-cost averaging offers a range of advantages that make it an attractive strategy for both investors and traders, especially when navigating uncertain markets.
Mitigating Market Volatility
By investing a fixed amount at regular intervals, DCA spreads out exposure over time. This approach can reduce the impact of sudden market swings. Instead of being affected by a one-off high price, the average cost is spread across different market conditions. This may help stabilise entry points and smooth out short-term volatility.
Disciplined Investment Approach
DCA promotes a structured investment routine. With regular contributions, there is less temptation to try timing the market. This disciplined approach might be particularly useful when markets are highly volatile or ahead of news and economic events. It encourages systematic investing, reducing the likelihood of making impulsive decisions driven by market noise.
Accessibility for All Traders
DCA does not require intricate market analysis or deep expertise in market timing. Its straightforward nature makes it appealing to both newcomers and seasoned traders looking for a simpler method to build positions over time. By providing a clear framework, DCA allows traders to focus on long-term goals without the pressure of constant market monitoring.
Limitations of Dollar-Cost Averaging
While dollar-cost averaging offers a structured approach to investing and trading, there are some limitations to consider.
Potential Opportunity Cost
Spreading out investments means funds are gradually deployed over time. In a market that is consistent, waiting to invest might lead to missed returns compared to committing all funds upfront. This method can reduce the impact of volatility but might underperform during extended trends.
Continued Exposure to Market Trends
Investors remain exposed to the market throughout the investment period. If the market experiences a prolonged trend, regular investments will accumulate at better prices, but overall returns may still suffer. This approach does not eliminate market risk and requires a long-term perspective to potentially see a turnaround.
Dependence on Consistency
The effectiveness of dollar-cost averaging relies heavily on maintaining a consistent investment schedule. Any interruption or inconsistency can dilute the intended advantages of the strategy. It also assumes that investors are able to commit regular funds, which may not be feasible in all financial situations.
Comparing DCA to Lump-Sum Investing
Comparing DCA to lump-sum investing offers insights into different approaches to managing market exposure and returns.
Risk Exposure
Lump-sum investing involves placing all available funds into an asset at once. This method can yield higher returns if the market moves in their favour, but it also exposes the investor to immediate risk if the market moves against them. In contrast, risk is spread over time through a dollar-cost average, meaning regular investments reduce the likelihood of entering the market at a high point and potentially lowering the overall average cost.
Market Conditions
The performance of each approach can vary depending on market trends. In steady trends, lump-sum investing may capture more returns since all funds are deployed early. However, in volatile or declining conditions, DCA could mitigate the effects of short-term fluctuations by smoothing out entry prices over time.
Flexibility and Commitment
Lump-sum investing requires confidence and a readiness to commit all funds immediately. DCA, on the other hand, offers a more measured entry into the market. This method is popular among those who prefer a systematic approach and might not have a large sum available at one time.
The Bottom Line
Understanding the dollar-cost averaging definition can help investors and traders potentially manage market volatility and reduce emotional decision-making. While it has its limitations, DCA can be an effective strategy for building positions over time.
FAQ
What Is an Example of Dollar-Cost Averaging?
Imagine investing £100 into a stock every month, regardless of its price. In January, the stock costs £20, so you buy five shares. In February, the price drops to £10, allowing you to buy 10 shares. In March, the price rises to £25, and you buy four shares. Over three months, you’ve invested £300 and purchased 19 shares, averaging out your cost per share to £15.79.
Is There the Best Dollar-Cost Averaging Strategy?
The most effective DCA strategy depends on individual goals. A consistent, long-term approach with regular investments—whether weekly or monthly—may help smooth out market volatility. Focusing on diversified assets could also reduce risk exposure.
What Is the Daily DCA Strategy?
This strategy involves investing a fixed amount every day through DCA, meaning it may help minimise the impact of short-term price fluctuations in volatile markets. However, it requires careful planning due to frequent transactions and potential fees.
Does Dollar-Cost Averaging Work With Stocks?
Yes, DCA is commonly used with stocks. It may help manage the effects of market volatility, allowing investors to build positions over time without worrying about short-term price swings.
What Does DCA Mean in Stocks?
DCA, or dollar-cost averaging, in stocks, means regularly investing a fixed amount, regardless of price, to average out the cost per share over time and manage market volatility. A similar answer is true for “What does DCA mean in crypto*?”, except it would involve a regular fixed investment in a particular cryptocurrency*.
How to Calculate DCA in Crypto* Investing?
There is a simple formula to calculate DCA, meaning in crypto*, an investor would just divide the total amount invested by the total number of units purchased. This provides the average cost per unit over time, regardless of price fluctuations.
*Important: At FXOpen UK, Cryptocurrency trading via CFDs is only available to our Professional clients. They are not available for trading by Retail clients. To find out more information about how this may affect you, please get in touch with our team.
This article represents the opinion of the Companies operating under the FXOpen brand only. It is not to be construed as an offer, solicitation, or recommendation with respect to products and services provided by the Companies operating under the FXOpen brand, nor is it to be considered financial advice.

Buying The Dip / Dollar Cost AveragingI recently published my first script and felt now would be a good time to share something I feel could help some people out. I have been trading since 2021 and it has been an amazing journey. Anyhow, I would consider myself a value based investor and in it for the long term.
So as the market takes a dip - now is certainly the time to be buying the dip or dollar cost averaging. The way I see it, if you are going to DCA/Buy The Dip, it might be handy to have access to a tool that is slightly better than just regularly timed investments.
Take a look at my indicator and let me know your thoughts.
Comment, Like and Follow if you enjoy the strategy and companion indicator.

Behind the DCA Strategy: What It Is and How It WorksWho invented the Dollar Cost Averaging (DCA) investment strategy?
The concept of Dollar Cost Averaging (DCA) was formalized and popularized by economists and investors throughout the 20th century, particularly with the growth of the U.S. stock market. One of the first to promote this strategy was Benjamin Graham , considered the father of value investing and author of the famous book The Intelligent Investor (published in 1949). Graham highlighted how DCA could help reduce the risk of buying assets at excessively high prices and improve investor discipline.
When and How Did Dollar Cost Averaging Originate?
The concept of DCA began to take shape in the early decades of the 20th century when financial institutions introduced automatic purchase programs for savers. However, it gained popularity among retail investors in the 1950s and 1960s with the rise of mutual funds.
Overview
The core principle of DCA involves investing a fixed amount of money at regular intervals (e.g., every month. This approach allows investors to purchase more units when prices are low and fewer units when prices are high, thereby reducing the impact of market volatility.
Why Was DCA Developed?
The strategy was developed to address key challenges faced by investors, including:
1. Reducing Market Timing Risk
Investing a fixed amount periodically eliminates the need to predict the perfect market entry point, reducing the risk of buying at peaks.
2. Discipline and Financial Planning
DCA helps investors maintain financial discipline, making investments more consistent and predictable.
3. Mitigating Volatility
Spreading trades over a long period reduces the impact of market fluctuations and minimizes the risk of experiencing a significant drop immediately after a large investment.
4. Ease of Implementation
The strategy is simple to apply and does not require constant market monitoring, making it accessible to all types of investors.
Types of DCA
Dollar Cost Averaging (DCA) is an investment strategy that can be implemented in two main ways:
Time-Based DCA → Entries occur at regular intervals regardless of price.
Price-Based DCA → Entries occur only when the price meets specific criteria.
1. Time-Based DCA
How It Works: The investor buys a fixed amount of an asset at regular intervals (e.g., weekly, monthly). Entries occur regardless of market price.
Example: An investor decides to buy $200 worth of Bitcoin every month, without worrying whether the price has gone up or down.
2. Price-Based DCA
How It Works: Purchases occur only when the price drops below a predefined threshold. The investor sets price levels at which purchases will be executed (e.g., every -5%). This approach is more selective and allows for buying at a “discount” compared to the market trend.
Example: An investor decides to buy $200 worth of Bitcoin only when the price drops by at least 5% compared to the last entry.
Challenges and Limitations
1. DCA May Reduce Profits in Bull Markets
If the market is in an bullish trend, a single trade may be more profitable than spreading purchases over time or price dips.
2. Does Not Fully Remove Loss Risk
DCA helps mitigate volatility but does not protect against long-term bearish trends. If an asset continues to decline for an extended period, positions will accumulate at lower values with no guarantee of recovery.
3. May Be Inefficient for Active Investors
If an investor has the skills to identify better entry points (e.g., using technical or macroeconomic analysis), DCA might be less effective. Those who can spot market opportunities may achieve a better average entry price than an automatic DCA approach.
4. Does Not Take Full Advantage of Price Drops
DCA does not allow aggressive buying during market dips since purchases are fixed at regular intervals. If the market temporarily crashes, an investor with available funds could benefit more by buying larger amounts at that moment.
5. Higher Transaction Costs
Frequent small investments can lead to higher trading fees, which may reduce net returns. This is especially relevant in markets with fixed commissions or high spreads.
6. Risk of Overconfidence and False Security
DCA is often seen as a “fail-proof” strategy, but it is not always effective. If an asset has weak fundamentals or belongs to a declining sector, DCA may only slow down losses rather than ensure future gains.
7. Requires Discipline and Patience
DCA is only effective if applied consistently over a long period. Some investors may lose patience and leave the strategy at the wrong time, especially during market crashes.

Key Elements in Trading & Investing ManagementKey Elements in Trading & Investing Management: Your Blueprint for Success 📊
🔍 Risk/Reward Analysis:
Every trade or investment should start with a thorough risk/reward assessment. This ensures you're not just chasing gains but are aware of the potential downside.
🎯 Clear Entry & Exit Strategies:
Define your entry and exit points before you trade. This discipline keeps your strategy on track, whether the market moves in your favor or against it.
🏞️ Embrace Market Volatility:
Accept drawdowns as part of the trading journey. Just as you'd celebrate profits, handle losses with the same composure to maintain your strategic approach.
🔄 Consistency in Strategy:
Avoid tweaking your strategy after a loss. Stick to your rules to foster a consistent trading methodology.
🔧 Utilize All Available Tools:
Leverage every tool at your disposal on platforms like TradingView—indicators, charts, and risk management features—to make informed decisions.
🎯 Set Profit Targets & Stop Losses:
Implement break-even points and stop-loss orders to secure profits and minimize losses, ensuring each trade is managed with precision.
💰 Focus on Capital Preservation:
Your primary goal should be to protect and grow your capital, not just to celebrate short-term wins. Long-term sustainability is key.
📈 Compound Your Success:
Use your gains wisely to compound your investments rather than risking them on speculative bets. Let your edge work for you over time.
🌟 Master Your Trading Edge:
Identify what gives you an advantage in the market, be it technical analysis, fundamental insights, or a unique approach, and harness it consistently.
💵 Implement Dollar Cost Averaging for Stability:Dollar Cost Averaging (DCA) is your ally for those looking to invest without timing the market. By investing a fixed amount at regular intervals, you buy more shares when prices are low 📉 and fewer when prices are high 📈, averaging out the cost over time. This strategy mitigates the impact of volatility 🌪️ and reduces the risk of investing a lump sum at a peak price.
Consistent Investment: Set up a schedule to invest, say, weekly or monthly, into your chosen assets. 🗓️
Emotional Discipline: DCA helps remove emotion from investing decisions, promoting a disciplined approach. 😌
Long-Term Growth: Over time, this method can lead to significant returns as you accumulate more shares at varied price points. 🌱📈
Incorporate DCA into your broader strategy to enhance your risk/reward balance, ensuring that you're not just reacting to market highs and lows but methodically building your investment base. 💡

UBISOFT REKT- What happens when you're one of the biggest video game companies in the world and you rest on your laurels? You sink.
- That said, as traders, we can always attempt to capitalize on a dead cat bounce.
- Right now, nothing to buy, if Ubisoft not down more and bounce before, just forget it.
------------------------------------------------------------------------------------------
Trading Parts :
------------------------------------------------------------------------------------------
- Buy around 10€ ( 30% invest )
- DCA Rebuy to 8.5€ ( 70% invest )
------------------------------------------------------------------------------------------
- TP1 : 17.9€
- TP2 : 29.9€
------------------------------------------------------------------------------------------
SL : 5.9€
------------------------------------------------------------------------------------------
Stay S4fe
Happy Tr4Ding !

Is the crash here?Throughout all of social media and YouTube I've been seeing many people panicking if weather or not we have topped and should start selling. One thing that I've learned predicting mayor world events is to: always play it on the safe side when dealing with uncertainty. Instead of shorting the market, I prefer reducing my exposure, as short trades are extremely risky, and I've personally learned that the hard way. It is true that price action is now at an infliction point. With a vast amount of stocks entering a downtrend in such a harsh manner. It is not hard to see why everyone is panicking. Do I think this is the crash we've been waiting for? Perhaps it is, but I can't tell with certainty because even tough price is over extended, it does have a lot of structure supporting it.
The reason we are at an infliction point is due to the price action reaching the 25MA which many times is used as support or resistance and going below this threshold would for sure confirm a downtrend and with my Mean Returns indicator the story is the same. We are seeing a loss in momentum after having a very bullish push in the last years.
With all the recent news in the U.S. election, it is fascinating to see the market react to these mayor events. These do change the scope of how the market should behave, as a lot of uncertainty has just been introduced to the U.S. population in general. This lack of knowing what the future hold in store is what I believe to be the driving force of this recent downtrend. Combined with increasingly worsening economic fundamentals is what will give us the crash we are waiting for. But before making a decision on how to trade, it's important to consider all possible outcomes. Which is exactly what you can see in the graph. Where I've marked what different price action would mean to the economy and the market in general, as well as setting a trading plan for all of these outcomes.
This type of panicking is what leads me away from using stop losses. People panic and push prices violently. However, many times the analysis was correct from the start but hitting a stop loss gets you to close your position prematurely. That's why I define several entry levels and dollar cost average since the beginning. Using an equation to determine how much should I invest, at which levels to determine the correct amount of exposure to avoid missing out and to always have a favorable average price.

How to dollar cost averge with precisionI've seen several dollar cost averaging calculator online, however there is something I usually see missing. How many stocks should you buy if you want your average cost to be a specific value. Usually the calculators will ask how much you bought at each level ang give you the average, but not the other way around (telling you how much to buy to make your average a specific value). For this, I decided to make the calculations on my own.
Here, you can see the mathematical demonstration: www.mathcha.io

PFE Long 1D Conservative Trade DCAConservative Trade
"+ long balance
- volumed expanding ICE
+ support level
+ volumed 2Sp-"
Monthly context
"- short impulse
+ 1/2 correction of 15 years long trend
+ historical volume
- resistance level"
There's no trading signal, but I like volume distribution on daily, so started to accumulate shares little by little.
No stop loss or take profit at this point, we'll be adding as we go.

A better DCA strategy that you need to start using. We all know about Dollar Cost Averaging positions over time.
However allow me to introduce you to a weighted DCA strategy that gets you a tighter average and retains additional capital over time ready to be allocated at "better prices".
First take your monthly $ allocation to your desired Ticker
*For this example we use $400 added monthly and TSLA as the Ticker
We break the monthly add into 1/4ths
So if we have $400 That = 4 lots of $100 dollars.
Set an Auto buy to $100 (as well as auto div reinvest if there is one)
*This feels like we're leaving too much on the table and not invested, but this is what gives this strategy the sauce.
*We use the Daily chart over a year timeframe for consistency.
If RSI is >= 60 we leave the auto buy of $100 (1/4) as is and save the remaining 3/4s to allocate at another date.
If RSI is >= 50 -60 we buy another 1/4 ($100) (totaling $200 or 2/4s of monthly allocation)
If RSI is <= 30 we allocate the other 3/4s ( $300 ) for a full 4/4s monthly allocation
_We will also @ RSI <= 30 allocate 1/4 of all saved monthly allocations
As seen in the Chart this occurs in Feb of 2024 where we buy $400 ($100 auto buy + $300 manual) and from $1300 reserves we've accumulated we use $325 to purchase additional shares.
This leaves us in great shape, we have a much tighter avg while also maintaining funds ready to specifically purchase more shares at a better price without the fomo.
The monthly breakdown of DCA'd shares looks like this
Shares DCA'd
Jul .35
Aug .789
Sep .794
Oct .773
Nov 1.94
Dec .84
Jan .84
Feb 3.90
mar 1.06
Apr 1.225
may 1.109
Jun 1.13
14.75 shares over 1 year
Total Invest
$3025
AVG/Share
$205 (9% better Avg than regular DCA)
W/ $1775 available for RSI < 30 situations
Any questions/ opinions welcomed.
Good Luck out there.

FRONTLINE PLC Long - Dollar Cost AverageThis is an analysis of Frontline PLC - a Norwegian oil transportation company, the following is strictly my own personal opinion and does not constitute financial advice.
Key numbers:
Dividend yield expected 2024 - 17%
P/B - 2.03
P/E - 5.41
Market cap 47 178 MNOK (4.5 BUSD)
Analyst estimates:
Analyst estimate average for FRO is 267.5 NOK which is equivalent to a 32.3% increase from todays price.
Key information:
FRO has had a significant increase in price the past 6 months, and analysts estimate an increase in both dividends and growth for the company in the coming years.
Technical analysis:
FRO made a bullish divergence on the 195-200 support level recently, after a significant sell off the past few weeks the stock did not even drop as a result of dividends being paid out to stock holders, and I see this as a sign of the stock being about to reverse the downwards trend and begin to move back towards my price target of 260-280.
Strategy:
I am currently in possession of FRO shares with a GAV of 150 NOK/Share as well as increasing my position on friday for 200 NOK/Share. I am looking to hold these shares until price reaches 260-300 NOK/Share depending on coming events. If the price keeps moving down, I will look to hold my position until the stock reaches my price target regardless, as the dividend payout is significant. This might change if significantly bearish news arise, but I do not see that as a high probability at this moment.
If price reaches my profit target, I will again look at analyst estimates and given there is no change I will exit my position for a significant gain. If analyst estimates increase I will either close part of my position or hold it until bearish divergence on the 4H timeframes.

Let's Dollar Cost Average with Ethereum 🎯Hi Traders, Investors and Speculators 📉📈
Ev here. Been trading crypto since 2017 and later got into stocks. I have 3 board exams on financial markets and studied economics from a top tier university for a year. Daytime job - Math Teacher. 👩🏫
In this 5min video, you'll see an example on arguably one of the most important strategies that every trader should know : The Dollar-Cost-Average method. When it comes to time for buying towards the end of a bearish market (ideally the accumulation zone), buy too soon and you risk regret if the price drops. But, if you wait and the price goes up, you may feel like you missed out on a deal. Or worse, you end up without a position.
When you dollar-cost average, you invest percentages of your available money at different entry points. Rather than attempting to time the market and catch the exact bottom, you buy in at a range of different prices. Dollar-cost averaging is a strategy that increases your profitability, as well as allows you to sleep soundly and carry on with your life without having to watch the charts all day.
Like with most investment strategies, dollar-cost averaging is not for everyone (not ideal for short term swings or day traders), and there are times it works better than others (during the end of the mark down phase). But it can be a powerful tool for removing some of the emotional barriers to investing. In this video, we look at how dollar-cost averaging works and the best ways to use the strategy.
While you're here 👀 learn more about stop hunt's in this post:
_________________
👀 Follow us here on TradingView for daily updates and trade ideas on crypto , stocks and commodities 💎
👍Hit like & Follow 🔔
We thank you for your support !
CryptoCheck

Bull Market Booming: Top Tips to Maximize Your Investment Gains!It appears that a bull market has taken hold in the US market, as evidenced by the remarkable rise of the S&P 500 index, surging over 20% from its October lows. Adding to this favorable outlook, the Federal Reserve has finally implemented a much-anticipated pause in the cycle of interest rate hikes.
With the shift in market sentiment from bearish to bullish, investors are eagerly looking for avenues to leverage this upward trend and make the most of the prevailing conditions.
Today, we will delve into the various factors that indicate the arrival of a bull market, along with strategies and invaluable tips to help you seize the opportunities presented by this favorable market scenario.
What Lies Behind All This Optimism?
The current wave of optimism in the market and the emergence of a new bull market can be attributed to several significant factors that are often overlooked or avoided in discussions. One key reason behind this optimism is the remarkable earnings results reported by companies.
Investors are celebrating the fact that companies are no longer delivering mediocre performance. Instead, they are exceeding expectations and showcasing strong growth. This shift in mindset from accepting average results to embracing a "glass-half-full" outlook is driven by the realization that companies are meeting and even surpassing the high growth expectations set for them.
This surge in optimism is fueled by the confidence that companies have proven their ability to generate substantial earnings and capitalize on market opportunities. Investors are therefore responding by driving up the market and contributing to the overall bullish sentiment.
It is important to acknowledge and consider this fundamental aspect when discussing the reasons behind the current optimism and the substantial year-to-date increases observed in the market. The impressive performance of companies and their ability to meet or exceed growth expectations have played a vital role in shaping the current bullish market sentiment.
S&P 500 daily chart
The positive forward guidance provided by CEOs further reinforces the current optimism in the market, as it signals their increased confidence in navigating challenges, particularly those posed by inflation. A notable example of this trend can be seen in Nvidia's Q1 earnings report, which highlighted the company's upwardly revised guidance. This adjustment reflects the strong demand for AI technologies that power applications at major industry players such as Google, Microsoft, and OpenAI, the creator of ChatGPT.
Nvidia's projected revenue of $11 billion for Q2 significantly surpassed the estimates put forth by Wall Street analysts. This impressive figure serves as tangible evidence that the AI craze is more than just hype. The surge in demand for graphics processing units (GPUs) from both established tech giants and startups as they develop their AI platforms has been a key driver behind Nvidia's remarkable performance. As a result, the company's shares experienced a staggering 26% surge, propelling Nvidia's market value to an extraordinary $1 trillion.
This achievement places Nvidia among the elite group of publicly traded US companies that have reached this milestone, joining the ranks of industry giants such as Apple, Microsoft, Google parent Alphabet, and Amazon. The significance of Nvidia's market value milestone further solidifies the notion that the demand for AI technologies is substantial and here to stay, providing a strong foundation for the ongoing bull market in the US market.
Tesla stock daily chart
Tesla has also emerged as a significant player worth noting in the current market landscape. The company has experienced a remarkable turnaround, with its stock value surging by an impressive 70% over a six-month period, including a notable 53% increase in the past month alone. This is a noteworthy development, considering that Tesla had suffered a substantial loss of around two-thirds of its value in 2022.
The strategic and timely price cuts implemented by Tesla, although initially perplexing to some, are now proving to provide the company with a potential market share advantage. These price adjustments have contributed to the renewed interest and confidence in Tesla, ultimately fueling its recent resurgence.
As the Q1 reporting cycle has concluded, the results reveal a strong performance for tech stocks in the latter half of the year. This surge can be attributed to the prevailing optimism surrounding the Federal Reserve's approach to nearing the end of its rate hike cycle. The anticipation of higher interest rates, coupled with concerns of slower economic growth and softer labor market conditions, has contributed to a decline in inflation. Surprisingly, the adverse effects that were initially expected to impact households and businesses have been less severe than initially predicted.
Furthermore, with the concerns surrounding the US debt ceiling alleviated and the mitigation of inflation risks, the overall market sentiment has undergone a transformation from bearish to bullish. This shift in sentiment is likely to continue, with stocks, particularly mega-cap tech companies like Tesla, expected to maintain strong returns throughout the remainder of the year.
Overall, Tesla's impressive turnaround and the positive performance of tech stocks exemplify the overall market's optimistic outlook, driven by a combination of factors such as Federal Reserve actions, inflation dynamics, and improved market conditions.
Top Bull Market Stocks to Consider Buying Now: Tesla (TSLA)
This is not financial advice.
Indeed, Tesla's influence extends beyond its position as a dominant player in the electric vehicle (EV) market. The company's offerings go beyond vehicles and encompass solar and energy storage solutions. Tesla's plans to establish a factory in Shanghai for manufacturing Megapack batteries further solidify its position as a leader in the renewable energy sector. These batteries play a crucial role in storing renewable energy, alleviating strain on the grid during peak hours, and promoting a more sustainable energy ecosystem.
While Tesla's growth will be primarily driven by its vehicle production, the company's positive outlook is reinforced by upcoming price cuts and the launch of new products such as the highly anticipated Cybertruck and Semi. These product expansions contribute to the company's overall growth potential and indicate its commitment to innovation and diversification within the EV market.
Despite some mixed recent financial results, investing in Tesla during the current bullish market phase is seen by many as a reasonable bet on the company's potential to become the world's largest automaker. Tesla's strong market presence, technological advancements, and commitment to sustainability have garnered significant investor confidence and positioned the company for continued success in the evolving automotive and renewable energy sectors.
Alphabet (GOOGL)
Alphabet stock daily chart
Google, with a staggering market capitalization of $1.6 trillion, stands as one of the most prominent names in the business world. It secures its place among the top five most valuable companies globally and boasts a widely recognized and esteemed brand.
Google remains at the forefront of groundbreaking advancements in various technological spheres, including mobile technology, cloud services, data analytics, artificial intelligence (AI), and virtual reality. These innovative developments continue to drive the company's success and shape its competitive edge. Notably, a significant portion of Google's revenue stems from its dominance in internet advertising, a lucrative sector that contributes substantially to its financial performance.
The active integration of AI within Google's operations serves as a strong catalyst for the growth of its shares. As AI technology becomes increasingly prevalent, it expands the addressable market for Google, creating new avenues for growth and revenue generation. The global corporate AI market, in which Google actively participates, is projected to experience a remarkable annual growth rate of 34.1% until 2030. This highlights the immense potential and opportunities that lie ahead for Google as it leverages AI capabilities to propel its business forward.
With its continuous pursuit of technological innovation and a diversified revenue stream, Google remains a formidable force in the industry, poised for sustained growth and influence in the years to come.
Intel (INTC)
Intel stock Monthly chart
The increasing adoption of artificial intelligence (AI) technology has created a surge in demand for chips, leading to notable market movements for prominent AI chip manufacturers. Both Advanced Micro Devices (AMD) and NVIDIA have experienced significant share price increases since the start of 2023, capitalizing on the growing enthusiasm surrounding AI advancements.
In light of this trend, chipmaker Intel is also seeking to position itself as a key player in the AI chip market. Intel has been engaged in negotiations for a strategic initial public offering (IPO) investment with Arm, a renowned British chipmaker. This move follows NVIDIA's previous unsuccessful attempt to acquire Arm.
By exploring this potential partnership, Intel aims to solidify its position in the AI chip sector and leverage Arm's expertise and technology to enhance its own capabilities. The negotiations highlight the fierce competition among chipmakers to secure a prominent position in the rapidly expanding AI market.
As the race for AI chip dominance intensifies, these developments demonstrate the strategic moves undertaken by major players in the industry to stay ahead in the evolving landscape of AI technology. The outcome of these negotiations will undoubtedly have implications for the future trajectory of the AI chip market and the competitive dynamics among key players such as AMD, NVIDIA, and Intel.
Strategies For Investing In A Bull Market
If we are indeed in the early stages of a new bull market, it's crucial to have strategies in place to make the most of rising stock prices. Here are four strategies to consider:
1 ) Diversification and Asset Allocation: Review your asset allocation to ensure you have sufficient exposure to stocks to benefit from the bull market. Consider rebalancing your portfolio by reducing your allocation to bonds and cash while increasing your allocation to equities. However, exercise caution and remain aware that market conditions can change rapidly. Don't assume that stocks will only go up from here. Maintain a well-balanced portfolio that includes a mix of stocks, bonds, and cash. If you're uncertain about the ideal mix, the Rule of 110 suggests subtracting your age from 110 to determine the percentage of your portfolio to allocate to stocks.
2 ) Focus on Growth Stocks and Sectors: In a bull market, growth stocks and sectors tend to perform well. Look for innovative companies that leverage technology to create efficiencies or address global challenges. Industries experiencing rapid growth in 2023 include CBD product manufacturing, 3D printing, solar power, and artificial intelligence. Remember that growth stocks offer higher return potential but also come with increased risk compared to more established companies.
3 ) Consider Value Investing: Value stocks are equities that appear undervalued relative to their intrinsic value. They may be trading at lower prices due to investor overreactions or a market environment that favors faster-growing assets. In a strong bull market, value stocks may lag as investors favor growth assets. However, for patient, long-term investors, this presents a buying opportunity. Value stocks often shine during bear markets and may offer dividend payments. Utilize the bull market to increase your holdings of value stocks, which can act as a buffer during the next bear market while providing dividend income.
4 ) Dollar-Cost Averaging: Implement a strategy known as dollar-cost averaging (DCA), where you invest a fixed amount on a regular schedule, regardless of market fluctuations. For example, invest $400 on the same day each month instead of trying to strategically time the market. DCA helps manage the volatility often seen in the early stages of a bull market. By investing consistently, you buy more shares when prices are low and fewer shares when prices are high. This approach lowers your average cost basis over time and minimizes the impact of short-term market fluctuations.
Remember that these strategies should be tailored to your individual financial goals, risk tolerance, and time horizon. It's advisable to consult with a financial advisor who can provide personalized guidance before making any significant investment decisions.
Risks To Be Aware Of In A Bull Market
While bull markets can present favorable opportunities, it's crucial to be aware of potential risks and pitfalls. Here are three significant risks to consider:
1 ) Overconfidence and Speculation: During a bull market, there is a tendency for investors to become overconfident and take on higher levels of risk. This can lead to speculative investing, where investors chase after high-risk, high-reward opportunities. However, when the bull market eventually ends, these speculative investments may experience substantial losses. It's important to maintain a balanced approach to investing and avoid excessive risk-taking, as downturns can permanently impact the outlook for smaller, less established companies.
2 ) Market Bubble: Bull markets can sometimes give rise to market bubbles, where stock prices become significantly detached from their underlying value. This occurs when investors, driven by excessive optimism, push prices to unsustainable levels. While market bubbles can provide opportunities for gains in the short term, they also carry the risk of a sudden correction or crash. Once the bubble bursts, panic can set in, causing a rapid decline in stock prices and the onset of a new bear market. It's essential to remain cautious and be aware of signs of excessive market exuberance.
3 ) Impact of Interest Rates and Inflation: The interplay between interest rates, inflation, and economic conditions can influence the trajectory of a bull market. Changes in interest rates by central banks, such as the Federal Reserve, can impact borrowing costs and corporate profitability. Additionally, shifts in inflation levels can affect consumer spending power and overall economic growth. Uncertainties regarding future interest rate hikes or spikes in inflation can introduce volatility and potentially dampen or reverse a bull market. It's important to monitor economic indicators and the actions of central banks to gauge their potential impact on market conditions.
It's worth noting that predicting the specific outcomes of these factors in the coming months or years is challenging. The key is to remain vigilant, maintain a diversified portfolio, and consider the long-term perspective when making investment decisions. Consulting with a financial advisor can provide valuable guidance in navigating the risks associated with a bull market.
Tips For Benefitiing From A Bull Market
To successfully navigate a bull market and maximize your investment potential, it's important to consider the following strategies:
1 ) Stay Disciplined: Maintaining discipline is crucial in avoiding excessive risk-taking and speculative behavior. Define your investing parameters and process, and stick to them. Establish clear criteria for the types of investments you're willing to make and the level of risk you're comfortable with. Evaluate any exceptions carefully and have a clear exit plan for more speculative assets. By staying disciplined, you can mitigate the risks associated with overaggressive investing and ensure a more measured approach to capitalizing on the bull market.
2 ) Think Long-Term: Adopting a long-term perspective is key to protecting your investments from short-term market fluctuations and potential downturns. While it can be tempting to make impulsive decisions based on short-term market movements, it's important to focus on your long-term financial goals. Allocate a portion of your portfolio to cash reserves to cover emergencies or major purchases, so you don't need to tap into your investment accounts during market volatility. This long-term outlook allows you to weather market cycles and take advantage of opportunities that may arise, while also providing stability and peace of mind.
3 ) Rebalance Regularly: Bull markets can lead to overexposure to stocks as their value appreciates. Regularly rebalancing your portfolio helps maintain your desired asset allocation. For example, if your target allocation is 70% equities and 30% bonds and cash, and stocks have outperformed, your allocation may shift to 75% stocks and 25% bonds and cash. By periodically selling stocks and purchasing bonds, you can restore your desired asset allocation and lock in some profits from the bull market. Rebalancing also helps manage risk by ensuring that your portfolio remains aligned with your risk tolerance and investment objectives.
4 ) Seek Professional Advice: Each individual's financial situation is unique, and it's important to consider your circumstances when implementing investment strategies. Regularly review your investment plan and consult with a financial professional to ensure it remains aligned with your goals and risk tolerance. A financial advisor can provide personalized guidance based on your specific situation, help you navigate market trends, and offer insights on potential investment opportunities. They can also assist in assessing the performance of your portfolio and making adjustments as needed.
By following these strategies, you can position yourself to make informed investment decisions, manage risk, and capitalize on the opportunities presented by a bull market. However, it's important to remember that investing involves inherent risks, and past performance is not indicative of future results. Stay informed, monitor market conditions, and be prepared to adjust your strategies as needed.
Conclusion:
As the bull market gains momentum, it is essential for investors to be well-prepared and make informed decisions. Employing various strategies such as diversification and asset allocation, emphasizing growth stocks and sectors, considering value investing, and implementing dollar-cost averaging can significantly enhance one's ability to navigate the market effectively. Nevertheless, it is crucial to remain cautious of potential risks, including overconfidence, market bubbles, and the influence of interest rates and inflation. To maximize gains during the bull market while minimizing potential risks, it is vital to maintain discipline, adopt a long-term perspective, regularly rebalance portfolios, and seek professional advice. It is important to note that individual circumstances vary, thus investment strategies should be tailored to align with personal financial goals and risk tolerance.

The Struggle of Consistency: Navigating DCA in Crypto InvestingHello dear @TradingView community! Today let’s focus on what is Dollar Cost Averaging ?
Determining the optimal moment to buy cryptocurrency is often a challenging task due to the high volatility of crypto assets. Prices can fluctuate unpredictably at any given time, leading traders to experience the fear of missing out (FOMO).
This fear is commonly felt when the price of a cryptocurrency, such as Bitcoin (BTC), suddenly surges or plunges. During price drops, individuals tend to panic and sell their holdings in a frantic attempt to avoid further losses. Conversely, when prices rise, panic ensues as people worry they don't possess enough coins to sell.
As evident, making decisions to buy or sell cryptocurrencies is no easy feat. However, if you seek long-term financial gains from cryptocurrencies without succumbing to the anxiety caused by every price spike, it would be wise to consider the Dollar Cost Averaging (DCA) strategy. Let's delve deeper into what DCA entails and how it functions in the realm of cryptocurrencies.
What is Dollar Cost Averaging?
Dollar cost averaging is an investment strategy where fixed amounts are regularly invested at consistent intervals, in contrast to a one-time lump sum investment. This approach involves executing transactions regardless of the asset's current price or market fluctuations. It is highly favored by investors and management funds seeking long-term profits from various assets like ETFs, commodities, cryptocurrencies, stocks, and more.
How does DCA work? To employ the DCA strategy, you first determine the amount of cryptocurrency you wish to invest. In conventional investing, one would typically invest the entire designated sum in a specific asset. However, with DCA, you invest fixed amounts of USD into Bitcoin or any other asset over a designated period. For instance, you may choose to purchase $100 worth of BTC every month for a 10 year period.
When utilizing DCA, the selection of the cryptocurrency becomes crucial. With around 22,904 cryptocurrencies available today, you must pick a coin you believe will appreciate in value and yield profitable returns. You can even choose an ETF which follows the trend (up or down) for any specific asset or basket of assets.
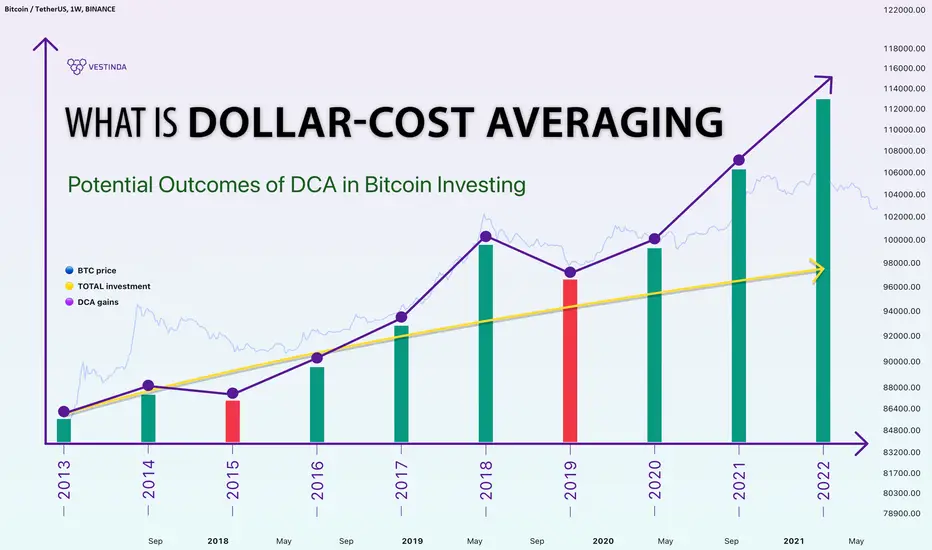
To comprehend how DCA operates, consider the following example:
Let's assume it is June of 2014, and Katie decides to allocate $10,000 in BTC. In June of 2014, the price of Bitcoin stood at approximately $560 per coin. Instead of investing the entire sum at once, Katie opts for dollar cost averaging throughout the 9 years.
From June 2014 to May 2022, Katie spent $100 each month on BTC, disregarding market price fluctuations. After 8 years, she spends almost $9,600 and her earnings reflect the following:
The green line in the chart represents Katie’s total investment amount, while the orange line depicts the fluctuation of portfolio size value over the 9-year period. When Katie initiated his investments, both the cost of BTC and his investments were approximately $100. However, as time progressed, the price of Bitcoin underwent changes.
By May of 2022, Katie's $9,600 investment had grown to $287,518 worth of BTC, showcasing a growth rate of 2,895%. With maximum gain of $631,540 at bitcoin ATH.
Online DCA tools are also available to estimate the earnings from purchasing bitcoins over several months. For example, platforms like dcaBTC enable users to customize their DCA strategy according to their preferences, specifying the amount to purchase, investment frequency, and duration.
To successfully implement dollar-cost averaging (DCA) in Bitcoin investing, several key steps need to be followed. These steps involve setting a budget, choosing a reputable cryptocurrency exchange, establishing recurring purchases or utilizing recurring purchases and automated investment platforms (such as Binance, Coinbase, Kraken, Crypto.com or even at Vestinda), and monitoring and adjusting the strategy as necessary.
Pros and Cons of Dollar Cost Averaging
Let's commence with the pros of dollar cost averaging. By making regular and consistent purchases over time, you mitigate the risk associated with poorly timed lump sum investments. Additionally, since you make regular purchases, you alleviate the fear of missing out and impulsive decision-making prompted by price fluctuations.
Cryptocurrency exchanges and platforms charge transaction fees for every trade. While one might assume that DCA would result in higher commission fees, it is essential to remember that this is a long-term strategy. The commission costs are negligible compared to the potential profits that can be realized over several years.
Moreover, DCA does not necessitate substantial investments. This strategy involves smaller and consistent purchases, eliminating the need to determine how best to deploy a large sum in one go. Furthermore, if prices suddenly drop at the time of purchase, you can acquire the cryptocurrency at a lower price.
However, it is important to note that if the cryptocurrency's price is bullish, you may end up buying at a higher price. This is particularly relevant when dealing with BTC or any chosen cryptocurrency. Many crypto enthusiasts and investors prefer to purchase a significant amount at once, fearing a subsequent price surge in the hours, days, weeks, or months to come.
As previously mentioned, with the DCA strategy, you purchase small amounts at regular intervals, regardless of market stability.
Should you utilize the DCA Strategy?
DCA facilitates maximizing profits with relatively low risk. Although this approach is not devoid of drawbacks, it offers numerous advantages that can be leveraged to your benefit.
Hence, is DCA worth your time and money? As always, we recommend thoroughly studying all available information before making any decisions. Save this article to your browser bookmarks for easy reference in the future.
Happy trading!
DX1 DOLLAR💥1H-TIMEFRAME ANALYSISDX1 DOLLAR💥1H-TIMEFRAME ANALYSIS
💗Hello ladies and gentlemen
This is my new idea for 💥Dollar Index
I hope my idea is clear
Support me by like and share thank you
Stay Safe💯💲💲💲
Good luck💰😍

Urgent update for the bitcoin March 14, 2023It's a very difficult time to enter any daytrading position. But hey, it's absolutely a good time to look for possible entry position for our long term holding.
Thank you

Bitcoin weekly chart analysis with possible bottom anticipationHello all,
As demonstrated in the chart i believe the bottom is yet to come and best support would be 6500-7700 demand zone. But this might take a year or so.
I believe from now on the best possible strategy to gain and catch the next Bitcoin bull cycle is DCA ( Dollar Cost Average ).
I am recommending DCA because "buying the dip" is a relative term and no one can foresee a certain dip, so lets manage the risk accordingly and split up our buying orders on BTCUSDT in several chunks to get an average on the dipped price !

ADA/USDTADA for me, is looking good for long term accumulation.
I like the team, and descentralization behind the project.
Also the developers are working hard if you analyze the github repo(see on coingecko).
Bear markets are a good time to DCA. At the moment of writing, 0.886 Fib.retracement looks good for DCA.
It is a very nice correction and risk/reward for long term is looking good for me.
0.15-0.18 is looking good for next support level.
Strategy is simple for long term. If the price is going down = acummulation. If it's going up, waiting with patience and looking for taking profits
!!! These are not financial advices. It's my perspective based on my knowledge at this point of time.

DCA Investing in BitcoinInvest more every time price goes down to reduce your average buy. If your average buy price is very close to current market price then your investment will recover faster as soon as uptrend starts.

BTC/USDWhy is this a buyer's market?
1. Moving averages in the past were bought (200MA, 300MA)
2. Everyone is looking at 200MA. This can break down also.
3. Great support at 13-16k if capitulation is not over at 24k levels.
--------------------------------------------------------------------------------
Next will analyze RSI to spot rare occasions to DCA Bitcoin.
This analysis is for long-term investors not for traders.
--------------------------------------------------------------------------------
Have a plan and respect it until making profits.
Emotions always will fool human beings.
Mindset + Patience = Succes
--------------------------------------------------------------------------------

OPPROTUNITY - BE AHEAD OF THE CROWD - LONG - ADA /BUSD -CARDANORed line is the lowest potentially reachable price.
The orange range lines are the probable sector where the price needs to get out from, to either increase of fall.
There are some symmetrics vertically.
The price have failed to recover and stay in the orange range.
The blue down trending line has been very regular but we can notice that the price have succeeded in passing through it.
The horizon is more positive but there is a danger zone close to the lowest $0.12 area.
What to watch? Check at this orange range, investors will probably wanting to see the price recovering in that range before entering massively.
Isn't it the great moment to dollar cost average and be ahead of the crowd ?
