“The Dollar Job: Break-In Strategy for 99+ Profits”💸 “DXY Heist Blueprint: Thieves’ Bullish Breakout Play” 🏴☠️
🌟Hi! Hola! Ola! Bonjour! Hallo! Marhaba!🌟
Welcome, Money Makers & Silent Robbers 🕶️💼✨
This is our next big Thief Trading Heist Plan targeting the 💵 DXY Dollar Index Vault. Armed with both technical precision 🔍 and fundamental insight 📊, we're ready to strike smart — not just fast.
🎯 THE MASTER HEIST PLAN:
🟢 ENTRY POINT – “Heist Entry Protocol”
🎯 Wait for price to break above Resistance @ 99.000 and candle to close ✅
💥 Plan A: Place Buy Stop Orders just above breakout
📥 Plan B: For Pullback Pros, use Buy Limit at recent swing low/high (15m–30m TF)
📌 Tip: Set alerts — don’t get caught napping while the vault opens! ⏰🔔
🛑 STOP LOSS – “Thief’s Escape Hatch”
🧠 Use 4H swing low at 98.100 as SL
⚖️ Adjust based on your lot size and number of open positions
🚨 Don't rush to set SL for Buy Stop entries before confirmation! Patience is part of the plan. 😎
🎯 TARGET – “Mission Objective”
💰 First Exit Target: 100.000
🏃♂️ Optional: Escape earlier near high-risk zones (Blue MA Line Trap Area)
⚔️ SCALPERS' CODE – Stay Sharp!
Only scalp on the Long side.
🔐 Use Trailing SL to guard your loot!
💸 Big wallets? Jump early.
🧠 Smaller stack? Follow the swing crew for coordinated execution.
🌐 MARKET OUTLOOK: WHY THE VAULT’S OPENING
💡 Currently seeing bullish momentum in the DXY
📈 Driven by macroeconomics, sentiment shifts, and intermarket pressure
📰 Want the full debrief? Check our analysis across:
COT Data
Geopolitics & News
Macro Trends & Sentiment
Fundamental Forces
📎🔗 See full breakdown
⚠️ TRADE MANAGEMENT ALERT
🚫 Avoid opening new trades during high-impact news
🔁 Always use Trailing Stops to lock in profits
❤️ Support The Heist – Boost the Plan!
Every boost powers our underground crew 🐱👤.
We rob the markets, not the people. 💼💰
Like & Boost to help grow the Thief Trading Gang 👊💥
Stay tuned, robbers – more heist plans dropping soon.
💸🚀📈🤑
Dollarindex

DXY BANK VAULT BREAK-IN: Your Dollar Index Profit Blueprint🚨 DXY BANK HEIST: Dollar Index Breakout Robbery Plan (Long Setup) 🚨
🌟 Hi! Hola! Ola! Bonjour! Hallo! Marhaba! 🌟
Attention, Market Robbers & Dollar Bandits! 🏦💰💸
Using the 🔥Thief Trading Style🔥, we’re plotting a DXY (Dollar Index) bank heist—time to go LONG and escape near the ATR danger zone. Overbought? Yes. Risky? Absolutely. But the real robbery happens when weak hands panic. Take profits fast—you’ve earned this loot! 🏆💵
📈 ENTRY: BREAKOUT OR GET LEFT BEHIND!
Wait for DXY to cross 99.300 → Then strike hard!
Buy Stop Orders: Place above Moving Average.
Buy Limit Orders: Sneak in on 15M/30M pullbacks (swing lows/highs).
Pro Tip: Set a BREAKOUT ALARM—don’t miss the heist!
🛑 STOP LOSS: DON’T GET LOCKED UP!
For Buy Stop Orders: Never set SL before breakout—amateurs get caught!
Thief’s Safe Spot: Nearest swing low (2H chart).
Rebels: Place SL wherever… but your funeral! ⚰️
🏴☠️ TARGET: 102.300 (Bank Vault Cracked!)
Scalpers: Long only! Trail your SL like a pro thief.
Swing Traders: Ride this heist for maximum payout.
💵 MARKET CONTEXT: DXY IS BULLISH (But Traps Await!)
Fundamentals: COT Reports, Fed Plays, Geopolitics.
Intermarket Sentiment: Bonds, Gold, Stocks—all connected.
Full Analysis: Check our bio0 linkks 👉🔗 (Don’t trade blind!).
⚠️ ALERT: NEWS = VOLATILITY = TRAP ZONE!
Avoid new trades during high-impact news.
Lock profits with trailing stops—greed gets you caught!
💥 SUPPORT THE HEIST (OR GET LEFT BROKE!)
Smash that Boost Button 💖→ Stronger team = bigger scores!
Steal profits daily with the Thief Trading Style. 🎯🚀
Next heist coming soon… stay ready! 🤑🐱👤🔥

DXYWe are expecting Dollar to stay weak for a bit longer before we see some reversals. For now it will be going up and down to complete the wave.
Disclosure: We are part of Trade Nation's Influencer program and receive a monthly fee for using their TradingView charts in our analysis.

DXY Swing Short! Sell!
Hello,Traders!
DXY keeps falling down
And the index broke the
Key wide horizontal level
Around 97.800 which is now
A resistance and the breakout
Is confirmed so we are very
Bearish biased and we will
Be expecting a bearish
Continuation on Monday
Sell!
Comment and subscribe to help us grow!
Check out other forecasts below too!
Disclosure: I am part of Trade Nation's Influencer program and receive a monthly fee for using their TradingView charts in my analysis.

DXY STRONG DOWNTREND CONTINUES|SHORT|
✅DXY is going down currently
In a strong downtrend and the index
Broke the key structure level of 98.000
Which is now a resistance,
And after the pullback
And retest, I think the price
Will go further down next week
SHORT🔥
✅Like and subscribe to never miss a new idea!✅
Disclosure: I am part of Trade Nation's Influencer program and receive a monthly fee for using their TradingView charts in my analysis.

US DOLLAR INDEX BOTTOMING?DXY looking for bottom and reversal around 97.
possible target : 108+
stop trade below 96.
good luck.
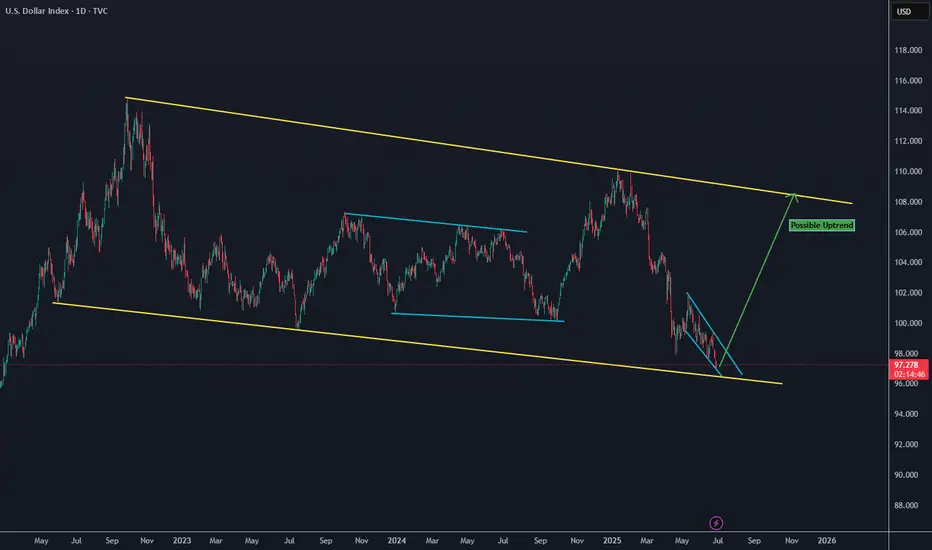
DXY Short-term rebound quite likely.The U.S. Dollar index (DXY) has been trading within almost a 3-year Channel Down, which has assisted us in choosing the right levels to sell high and buy low.
Despite being now on its 2nd major Bearish Leg, we see a short-term bounce possibly up to August quite likely based on the previous major Bearish Leg. As you see, the current setup resembles the April 13 023 Low after which the price rebounded short-term just above the 0.786 Fibonacci level, only to get rejected later and complete the bottom on the 1.1 Fib extension.
Even the 1W RSI sequences between the two fractals are identical. Therefore, before diving below 96.000, we believe a 100.000 test is quite likely.
-------------------------------------------------------------------------------
** Please LIKE 👍, FOLLOW ✅, SHARE 🙌 and COMMENT ✍ if you enjoy this idea! Also share your ideas and charts in the comments section below! This is best way to keep it relevant, support us, keep the content here free and allow the idea to reach as many people as possible. **
-------------------------------------------------------------------------------
💸💸💸💸💸💸
👇 👇 👇 👇 👇 👇

DXY Eyes Key Long-Term Support from 2008The U.S. Dollar Index (DXY) is currently trading near three-year lows, reflecting concerns over economic fragility and heightened geopolitical tensions.
If price action holds below 97, the DXY could face additional pressure, potentially descending toward the lower boundary of a long-term channel that has held since the 2008 lows. Key support levels at 96 and 94 may offer potential rebound zones.
Monthly RSI reflects more downside potential towards oversold conditions last seen in 2021. To reverse the current bearish momentum, the index would need to regain and hold above the 100-mark, which could shift sentiment back toward a bullish rebound outlook against the markets.
- Razan Hilal, CMT

GBPJPY I Expect a Rally from the Buy Zone in the 1H Time FrameDescription:
I'm viewing the 195.116–194.845 range on GBPJPY as a strong buy zone. My target is 196.088. Once the trade setup becomes active or the target is reached, I’ll be sharing an update here. Stay tuned!
I meticulously prepare these analyses for you, and I sincerely appreciate your support through likes. Every like from you is my biggest motivation to continue sharing my analyses.
I’m truly grateful for each of you—love to all my followers💙💙💙

Dollar In Fifth Wave-Reversal In Trend May Not Be Far Away.The Fed will announce its latest policy decision later, and expectations are that Powell will keep rates on hold, especially after last week's slightly higher inflation print and still solid US jobs data. We can see some stabilization in the US dollar ahead of this event, but we have to keep an eye on geopolitical tensions in the Middle East, which coudl also play a key role in driving safe haven flows.
Meanwhile, the stock market continues to trade sideways, and I don't expect any major breakouts or strong moves ahead of the Fed. Also, tomorrow is a holiday in the US, so that could contribute to slower market conditions into the end of the week, unless, of course, the situation in the Middle East gets worse.
Looking at the DXY waves structure, I see athree-wave move from the most recent lows, so the fourth wave I highlighted a few days ago could now be approaching completion near this week’s key resistance around the 99 level. That’s definitely a level to watch for a potential fresh, but possibly final sell-off toward new lows around 97, maybe even 96.
That’s where the DXY could stabilize, as ending diagonal pattern signals that we are likely in the late stages of wave five, meaning this bearish cycle could soon come to an end.

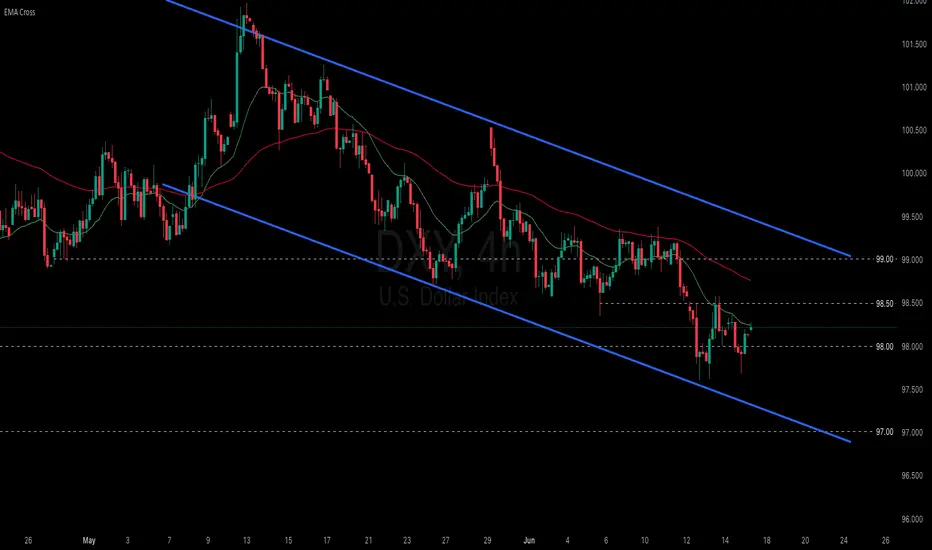
DXY June 18 2025We believe that Trump's tariffs and the downward trend in U.S. interest rates will continue to put pressure on the dollar, leading to further depreciation.
Monthly Target: 95.445-101.977

Tariff uncertainty keeps weighing on the dollar.
Geopolitical risks in the Middle East have eased slightly amid signs of potential negotiations, prompting markets to shift their focus back to the upcoming FOMC and tariffs. Following talks with Canadian Prime Minister Carney, President Trump stated that a trade deal with Canada could be reached within weeks, and also confirmed that a trade agreement with the UK has been signed.
Meanwhile, markets are almost certain that the Fed will keep rates unchanged at the upcoming FOMC, with the probability priced at 99.8%. Wells Fargo expects the inflation outlook to rise due to the delayed impact of higher tariffs, projecting that the year-end median federal funds rate will climb by 25bps to 4.125%.
DXY is consolidating within the 97.50–98.50 range, remaining below both EMAs, which suggests a potential continuation of bearish momentum. If DXY breaks below the support at 98.00, the index may retreat to 97.50. Conversely, if DXY breaches above the resistance at 98.50 and the descending trendline, the index could gain upward momentum toward 99.00.
BTC update!!Good day traders, here is another update on BTC and I have adjusted my narrative but my overall bias is still remaining bearish…


DXY Ready to Reload? Eyes on 99.100 as Tariff Tensions Ease!!Hey Traders, In tomorrow's trading session, we're closely monitoring the DXY for a potential buying opportunity around the 99.100 zone. After trending lower for a while, the dollar index has successfully broken out of its downtrend and is now entering a corrective phase.
We’re watching the 99.100 support/resistance area closely, as it aligns with a key retracement level making it a strong candidate for a bullish reaction.
On the fundamental side, Friday's NFP data came in slightly above expectations, which is typically USD-positive. In addition, recent Trump-led de-escalation in U.S.-China tariff tensions is another supportive factor for the dollar.
Trade safe, Joe.

DXY ready for free fall?DXY at 99.39 strong liquidity grab then rejected back to the support level then following a head and shoulder, price completely has broker out of the support with CPI, it has finally managed break out of consolidation.
As the impulse has volume, we may see further drop to the monthly support 97.93 and may potentially break below as there is FVG which may slide the price further down.

DXY Monthly Analysis | Smart Money Concept + CHoCH BreakdownPair: US Dollar Index (DXY)
Timeframe: 1M (Monthly)
Strategy: Smart Money Concept (SMC) + Market Structure + Demand/Supply Zones
Bias: Bearish (Mid to Long-Term)
Breakdown:
Price reacted strongly from the monthly supply zone (110–104), showing signs of exhaustion.
Clear CHoCH (Change of Character) visible at the top structure, confirming loss of bullish intent.
Internal structure printed a liquidity sweep + FVG (Fair Value Gap) ➝ BOS ➝ lower low.
Current PA (price action) is targeting the first demand zone near 92–94, but major interest lies at the macro demand zone (85.100–84.900).
This level aligns with unmitigated historical demand and potential long-term accumulation range.
---
📅 Projection:
Expecting a continuation to the downside after retesting minor imbalance zones.
Potential multi-year bearish leg forming Wave 3 (macro view).
Ideal accumulation/buy zone: 85.100–84.900 – if structure supports.
---
📌 Key Levels to Watch:
Supply Zone: 110.800 – 104.600
CHoCH Level: ~102.300
Short-Term Demand: 92.000 – 94.000
Long-Term Demand (Institutional Interest): 85.100 – 84.900
---
💡 Conclusion: Smart Money has exited from premium pricing, and the macro structure aligns with a bearish transition. As long as price respects current lower highs, we may see a deeper correction or possible trend reversal near 85 levels.
---
🧠 #DXY #SmartMoney #CHoCH #ForexAnalysis #SupplyAndDemand #PriceAction #Forex #Month

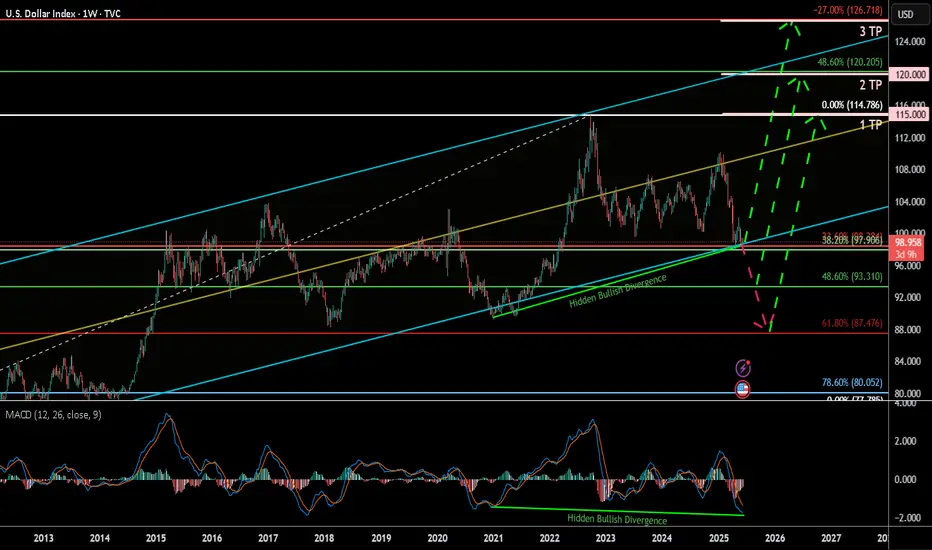
U.S. Dollar Index (DXY) Weekly 2025Summary:
The U.S. Dollar Index (DXY) has corrected down to the key 38.60% Fibonacci retracement zone and is currently showing signs of a potential bullish reversal, bolstered by a clear hidden bullish divergence on the MACD. This may signal a renewed rally toward key upside targets, especially if the 93.3–99.9 support Zone holds.
Chart Context:
Current Price: 98.864
Key Fib Support: 38.60% @ 99.906, 48.60% @ 93.310, 61.80% @ 87.476
Support Zone: 93.3–99.9 USD
Hidden Bullish Divergence: Observed both in 2021 and now again in 2025 on the MACD
Trendline Support: Long-term ascending trendline holding since 2011
Fib Extension Targets (Trend-Based):
TP1: 115.000
TP2: 120.000
TP3: 126.666
Key Technical Observations:
Fibonacci Confluence: DXY is bouncing from a strong Fib cluster between 93.310 and 99.906, historically acting as a reversal zone.
Hidden Bullish Divergence: Suggests potential upside despite price weakness.
Downtrend Retest: Price may revisit 93.3–87.4 before confirming full reversal.
Breakout Pathway: Green dashed arrows outline the likely recovery trajectory toward 114–126 range.
Indicators:
MACD: Showing hidden bullish divergence and potential signal crossover.
Trendline Support: Holding intact from 2021 low.
Fib Levels: Used for retracement and trend-based extension.
Fundamental Context:
Interest Rate Outlook: If U.S. inflation remains controlled and Fed signals future hikes or sustained high rates, DXY strength may persist.
Global Liquidity & Recession Risk: If risk aversion returns, the dollar may rise as a safe haven.
Geopolitical Risks: Conflicts, trade tensions, or BRICS dedollarization efforts may create volatility.
Our Recent research suggests the Fed may maintain higher-for-longer rates due to resilient labor markets and sticky core inflation. This supports bullish USD bias unless macro shifts rapidly.
Why DXY Could Continue Strengthening:
Robust U.S. economic performance & monetary policy divergence
U.S. GDP growth (~2.7% in 2024) outpaces developed peers (~1.7%), supporting stronger USD
The Fed maintains restrictive rates (4.25–4.50%), while the ECB pivots to easing, widening the policy and yield gap .
Inflation resilience and Fed hawkishness
Labor markets remain tight, keeping inflation “sticky” and delaying expected rate cuts; market-implied cuts for 2025 have been pushed into 2026
Fed officials (e.g. Kugler) emphasize ongoing tariff-driven inflation, suggesting rates will stay elevated.
Safe-haven and yield-seeking capital flows
With global risks, capital favors USD-denominated assets for yield and stability
Why the Dollar Might Face Headwinds
Fiscal expansion & trade uncertainty
Ballooning U.S. deficits (~$3.3 trn new debt) and erratic tariff policy undermine confidence in USD
Wall Street’s consensus bearish position.
Major banks largely expect a weaker dollar through 2025–26. However, this crowded bearish sentiment poses a risk of a sharp rebound if data surprises occur
barons
Tariff policy risks
Trump's new tariffs could dampen dollar demand—yet if perceived as fiscal stimulus, they could unexpectedly buoy the USD .
Synthesis for Our Biases
A bullish DXY thesis is well-supported by:
Economic and policy divergence (U.S. growth + Fed vs. peers).
Hawkish Fed commentary and sticky inflation.
Safe-haven capital inflows.
Conversely, risks include:
Deteriorating fiscal/trade dynamics.
Potential Fed pivot once inflation shows clear decline.
A consensus that could trigger a short squeeze or reversal if overstretched.
Philosophical / Narrative View:
The dollar remains the world’s dominant reserve currency. Periodic dips often act as strategic re-accumulation phases for institutional capital—especially during global macro uncertainty. A return toward 120+ reflects this persistent demand for USD liquidity and safety.
Bias & Strategy Implication:
1. Primary Bias: Bullish, contingent on support at 93.3–99.9 holding.
2. Risk Scenario: Breakdown below 93.3 invalidates bullish thesis and targets 87.4–80 zones.
Impact on Crypto & Gold and its Correlation and Scenarios:
Historically, DXY has had an inverse correlation to both gold and crypto markets. When DXY strengthens, liquidity tends to rotate into dollar-denominated assets and away from risk-on trades like crypto and gold. When DXY weakens, it typically acts as a tailwind for both Bitcoin and gold.
Correlation Coefficients:
DXY vs. Gold: ≈ -0.85 (strong inverse correlation)
DXY vs. TOTAL (crypto market cap): ≈ -0.72 (moderate to strong inverse correlation)
Scenario 1: DXY Rallies toward 115–126 then, Expect gold to correct or stagnate, especially if yields rise. Crypto likely to pull back or remain suppressed unless specific bullish catalysts emerge (e.g., ETF flows or tech adoption).
Scenario 2: DXY ranges between 93–105 then Gold may consolidate or form bullish continuation patterns. Then Crypto may see selective strength, particularly altcoins, if BTC.D declines.
Scenario 3: DXY falls below 93 and toward 87 Then Gold likely to rally, possibly challenging all-time highs. Crypto could enter a major bull run, led by Bitcoin and followed by altcoins, fueled by increased liquidity and lower opportunity cost of holding non-USD assets.
Understanding DXY’s direction provides valuable insight for portfolio positioning in macro-sensitive assets.
Notes & Disclaimers:
This analysis reflects a technical interpretation of the DXY index and is not financial advice. Market conditions may change based on unexpected macroeconomic events, Fed policy, or geopolitical developments.
GBPJPY UPDATE!!Good day traders, I am back again with an update and this time it's on GBP/JPY. On the 1st of June I posted a setup but I mentioned that I will explain it later because I will be able to make my point clearer and easy to understand.
When this setup was posted I had that daily order block in mind, only because I needed to see it revisit the order block for the last time before price could make a run for that internal liquidity resting inside an unfilled FVG(BISI). We can also use that thought as confluence when looking for short term reversals or partial exits. Just by taking a look on the chart I posted again I will put it in the description below, you can see in the sell side of the chart we have a lot of equal lows and ICT teaches us that price looks for relative lows/equal lows and old lows.
On the daily TF price is currently inside a bearish order block and what we do not wanna see is price going over the wick of that wick of a candle that was booked on the 29th of May. We are also inside the premium zone of the wick meaning we can expect to run from there to our objectives below. As always my first objective is always the internal liquidity and that is only because that internal liquidity are my LTF | Highs/Lows.
On the 4H price is inside a balanced price range again that's in my favour meaning I have to note it. ICT teaches that we always wanna trade towards the direction where all our PD arrays are lining up and in this case, it's in the sellside, I believe we are in the starting phase of ICT's sell model.
My name is Teboho Matla but you...you don't know me yet!!

NQ tumbles?Good day traders, I don't know why but I get a bit scared when it comes to analyzing NQ. I always doubt myself with it.
On the weekly TF price is trading inside an order block and for the past two weeks price has visited the order block two times. In the two times that price revisited the order block it failed to close above the midpoint indicating the strength of the order block, going into the new week I am going to use the discount zone of the OB+ as my resistance.
On the daily TF before I say much, THERE IS A GAP, and price did not trade to it since opening high on the 12th May. That gap is my target and I want to see price go and fill that volume imbalance as ICT calls it.
Still on the daily TF...when you read price for past two weeks on NQ, you'll quickly come to a realization that price has been expanding higher since Tuesday 3rd June, but expanding to where?...well liquidity resting above the high of the candle booked on the 29th of May.
Now on the 4 hour TF things are opening up and price is becoming clearer and it goes to show the importance of multi time frame analysis. The lows of Tuesday and Thursday make the relative equal lows that are shown on the chart. The internal liquidity shown below is my short term target or TP1. The red triangle represents that 4H inverse FVG and once price is trading below the inverse any movement inside that inverse should show weakness!

Bitcoin plummets!!Good day traders, I am back with yet another update on BTC/USD. My last update on bitcoin what I was expecting price to do unfortunately did not happen as price was very weak, I had a FVG(SIBI) that I really wanted price to revisit and the two price levels that make up the SIBI are 107752 and 107149.
Now that both our sellside liquidity were taken does that mean price is now gonna look for the buyside liquidity? My honest opinion is I don't think because I said 97k is insight and I believe it can still happen and it will according to my HTF perspective.
On the daily TF we have clear sight of relative highs that we wanna see price take and that might happen today but my short term objective is the high that was booked on Tuesday. That Tuesday's candlestick has a very large wick and from my time learning with ICT's content, wicks contain a lot of price data that can be used either for entries or exits.
4H- Here we had a shift in market structure lower on Thursday but price has been bullish ever since the shift happened. On this respective TF we have equal highs too, and ICT teaches us to always focus our attention on them mainly because price looks for liquidity and imbalances on the 4 hour TF...should we look closely on the left of our screens or chart, there is an order block from the wick I mentioned above. Again what are the rules of an order block?..
FROM TOMORROW PRICE WILL START TO PLUMMET!!

The Unraveling of an Empire: How Bitcoin Could Break the DollarFor decades, the U.S. dollar has reigned supreme, an undisputed king in the global financial arena. It is the world's primary reserve currency, the bedrock of international trade, and the safe-haven asset investors flock to in times of turmoil. This dominance has afforded the United States what has been called an "exorbitant privilege," allowing it to borrow cheaply and exert significant influence over the world economy. But the ground beneath this financial empire is beginning to shift. A confluence of mounting debt, shifting geopolitical sands, and the rise of a revolutionary technology is creating the conditions for a challenger to emerge. That challenger is Bitcoin.
Born from the ashes of the 2008 financial crisis, Bitcoin represents a radical departure from the centrally controlled monetary systems that have governed economies for centuries. It is a decentralized, digital currency, free from the whims of governments and central banks. While initially dismissed as a niche interest for tech enthusiasts and a tool for illicit activities, Bitcoin has steadily gained traction, evolving into a trillion-dollar asset class that is now capturing the attention of institutional investors, corporations, and even nation-states. The question is no longer whether Bitcoin is a fleeting fad, but whether it possesses the power to fundamentally disrupt, and perhaps even break, the long-standing hegemony of the U.S. dollar.
A Hedge Against a Failing System
One of the most compelling arguments for Bitcoin's ascendancy lies in its inherent properties as a store of value, particularly in an era of unprecedented monetary expansion and soaring national debt. Unlike the U.S. dollar, which can be printed at will by the Federal Reserve, Bitcoin has a finite supply capped at 21 million coins. This predictable scarcity is a powerful antidote to the inflationary pressures that erode the purchasing power of fiat currencies. As governments around the world, and particularly the United States, continue to accumulate staggering levels of debt, the temptation to devalue their currencies through inflation grows. The U.S. national debt, now standing at tens of trillions of dollars, raises serious questions about the long-term sustainability of the dollar's value. In this environment, Bitcoin's unalterable monetary policy makes it an increasingly attractive safe haven for those seeking to preserve their wealth.
The trend of "de-dollarization" is already underway, with several countries actively seeking to reduce their reliance on the U.S. dollar in international trade and reserves. Geopolitical rivals like China and Russia have been at the forefront of this movement, but even traditional allies are beginning to explore alternatives. The weaponization of the dollar through sanctions has further accelerated this trend, prompting nations to seek financial systems that are not subject to the political whims of a single country. Bitcoin, being a politically neutral and borderless currency, offers a compelling solution. It allows for direct, peer-to-peer transactions across the globe without the need for intermediaries, thereby circumventing the traditional, dollar-dominated financial system.
The Rise of a New Reserve Asset
The ultimate test of a global currency is its acceptance as a reserve asset by central banks. While this may have seemed like a far-fetched idea just a few years ago, it is now a topic of serious discussion in financial circles. A handful of nations have already taken the pioneering step of adding Bitcoin to their reserves, signaling a potential paradigm shift in how countries manage their sovereign wealth. For central banks, the appeal of Bitcoin lies in its potential for diversification. By holding an asset that is not correlated with traditional stocks and bonds, they can better hedge against various economic and geopolitical risks. As more central banks begin to explore this option, even a small allocation to Bitcoin could have a significant impact on its price and legitimacy.
The development of a robust financial ecosystem around Bitcoin is also paving the way for its broader adoption. The emergence of regulated exchanges, custody solutions, and investment products has made it easier for institutions to gain exposure to the asset class. This growing infrastructure is crucial for building the trust and liquidity necessary for Bitcoin to function on a global scale.
The Hurdles on the Path to Dominance
Despite its disruptive potential, Bitcoin faces a number of significant challenges that could hinder its ability to supplant the dollar. The most frequently cited concern is its price volatility. Wild swings in value make it a difficult medium of exchange for everyday transactions and a risky asset for conservative central banks to hold in large quantities. While volatility may decrease as the market matures, it remains a major obstacle to widespread adoption.
Scalability is another critical issue. The Bitcoin network can currently only process a limited number of transactions per second, making it unsuitable for the high volume of payments required of a global currency. While second-layer solutions are being developed to address this, they have yet to be proven at a massive scale.
Furthermore, the regulatory landscape for cryptocurrencies is still in its infancy. Governments around the world are grappling with how to approach this new technology, and the lack of clear and consistent regulations creates uncertainty for investors and businesses. The U.S. government, in particular, is unlikely to cede its monetary authority without a fight, and could impose stringent regulations that stifle Bitcoin's growth.
Finally, no currency in history has achieved global dominance without the backing of a major economic and military power. The U.S. dollar's reign is underpinned by the strength of the American economy and its military might. Bitcoin, by its very nature, is decentralized and lacks the support of any single nation-state. This could be both a strength and a weakness. While it provides neutrality, it also means that there is no central authority to backstop the currency in times of crisis.
A New Financial Order
The notion that Bitcoin could completely break the U.S. dollar and become the sole global reserve currency in the near future remains a speculative one. The dollar's incumbency advantages are formidable, and the challenges facing Bitcoin are substantial. However, to dismiss the potential for a seismic shift in the global financial order would be to ignore the powerful forces at play.
What is more likely than a complete replacement is a gradual transition to a more multipolar currency world, where Bitcoin coexists alongside the dollar, the euro, and other major currencies. In this scenario, Bitcoin could serve as a neutral reserve asset, a check on the inflationary tendencies of fiat currencies, and a parallel financial system for those who are excluded from or wish to opt out of the traditional one.
The rise of Bitcoin is a clear signal that the world is yearning for a more resilient, equitable, and decentralized financial system. Whether it ultimately breaks the dollar or simply forces it to become more disciplined, one thing is certain: the future of money will look very different from its past. The quiet revolution that began with a single whitepaper is now a global movement, and the foundations of the old financial empire are beginning to tremble.

THE FLEX SETUP (EURGBP)Good day traders, I'm back with another setup and it’s only an update that I believe can really provide insight into what to expect from price in the upcoming weeks.
Like I always say that I always want to see price take out a previous week high/low as I use that as a confirmation in term of the power of 3 that I use to try and avoid manipulation, but this doesn't mean I don't get on the wrong side of price moves. Looking at the HTF's overall structure we can see that we in a very bullish structure but... There's a bearish flow in price!! On the weekly TF price left a large FVG(BISI), showing how strong the bullish structure is and now that price is trading on top of this BISI I'm mentioning. If we go one TF lower to the daily TF than on the daily the weekly BISI is a balanced price range and normally how I look at Gaps after been balanced, I treat them like classic support/resistance, but they have to confluence with another PD array first than for me the rules of 'support/resistance' come into play. If you look close into the daily TF, we have relative equal highs inside the volume imbalance created on the 12th of May.
Let's look at how price delivered since opening with a gap lower on the 12th, on that same day price repriced that gap but did not close above it. Why do we want it to close above it? Well ICT teaches more on volume imbalances and the rules or pros and cons. If price closes above the volume imbalance than it becomes balanced once price retests the closure above/below obviously depending on the gap opening. On the 4HTF we saw price shift structure higher and the first thing I see is the candle that had a broken lower high because it also became our breaker. And a FVG inside it making that zone stronger again we can use all the PD arrays together.
