#DXY The dollar has reached the reversal zone#DXY
The dollar has reached the reversal zone (Harmonic Enlightenment pattern)
The decline prediction fails with a daily close above 108.14. Otherwise, we wait for the green targets
The "Butterfly" pattern is a technical analysis pattern used in trading, including cryptocurrency trading. It is a specific type of harmonic pattern that traders use to identify potential reversal points in the price of an asset. The Butterfly pattern is characterized by several price points that form specific geometric shapes on a price chart. Here's a brief explanation of the Butterfly Bearish Harmonic Pattern in crypto:
1. **Initial Move:** The pattern begins with a significant price move, which could be either an uptrend or a downtrend, depending on whether it's a bearish or bullish Butterfly pattern.
2. **X-A Leg:** This is the first leg of the pattern and represents the initial move's retracement. It's labeled as "X" and is usually the point where traders first identify the potential pattern.
3. **A-B Leg:** This leg is the next move in the opposite direction of the initial move, labeled as "A." It retraces a portion of the X-A leg.
4. **B-C Leg:** The B-C leg represents a move in the direction of the initial X-A leg and is labeled as "B."
5. **C-D Leg:** The final leg, labeled as "D," is the most critical part of the pattern. It extends beyond the X-A leg and typically ends near a Fibonacci extension level of 1.618 or 2.618 of the X-A leg.
The Bearish Butterfly pattern suggests a potential reversal to the downside. Traders look for this pattern to anticipate that the price may start declining after completing the D leg. It's important to note that not all identified patterns result in price reversals, so traders often use additional technical indicators and risk management strategies to make informed trading decisions.
Remember that cryptocurrency markets are highly volatile, and trading based solely on technical patterns carries risks. It's crucial to conduct thorough research and consider other factors before making trading decisions in the crypto market or any financial market.
Dollarindex

DXY back to 105.400DXY index will go green again after testing 103.700 level this week.
Yesterday unfortunately dollar was red.
But probably it will go up again today.
Follow To Get More Signals.
If you’re trader and looking for professional technical analysis for your trades, Send us your case and we will serve you.
Don’t be hesitate to contact us.
Best Regards.

USD could "pullback" untill 103.50 +/-. 14/Nov/23DXY / Dollar Index could have a further decline until 103.50 +/-. Which is a confluence zone of :- 1) Order Block 2) Fibo 50% 3) Parallel line of pitchfork.

Dollar Index Weakness!DXY!
N.B!
- DXY price might not follow drawn lines . Actual price movement may likely differ from the forecast.
- Let emotions and sentiments work for you
- ALWAYS Use Proper Risk Management In Your Trades
#dxy
#dollarindex

DXY 2 senario with detailhi dear trader
this price action for dxy with detail
It is near the end of the year, institutions want to put a stop to the money for the Christmas celebration and take it out now... be careful.... My personal opinion is that he may not pay attention to the conversation this year, but this year he will fill the conversation with news of a war with something, but in any case, two scenarios should be considered... My personal opinion is that he will complete scenario 1 later. From the diamond pattern
good luck
mehdi

DXY D1 - Short SignalDXY D1
This week, our perspective on the USD remains consistent with last week's analysis. The dollar demonstrated a bullish W1 close, while remaining firmly within the confines of the breakout and reversal structure on the lower timeframes (LTF).
The 106 resistance level continues to stand its ground, and we maintain an optimistic outlook for USD pairs this week, which includes XAUUSD. Anticipating further upside potential in the days ahead.

#DXY #dollarindex will bite incoming weeks#dxyindex formed a megaphone channel. What does this mean?
This is bullish for the index aaand... bearish for all risky assets like stock markets, crypto, commodities etc.
This process may take weeks, just saying beware.
NOT FINANCIAL ADVICE.

DXY - Intraday Analysis (ICT)My DXY interest for today.
Assuming the last dump was to trap shorts, with the confluence of trading into a Monthly Bisi and Monthly Breaker (Body) and New Month Opening Gap. I am interested to see if this can now move higher.
It also traded off a Daily Bisi then broke higher, again playing around a 4h Sibi, and now seems to be moving lower. There is a 1h Balanced Price Range inside a Breaker on this timeframe at OTE of that range. I would like to see it react off of there, go higher, use the 4h gap as support, then move higher to target an actual liquidity void above.

DXY$ Shorts from 105.800 down towards 105.200As expected our last week scenario (A) played out perfectly like we anticipated which was seeing a bullish reaction from the 4hr demand. For this week's bias we are still temporarily bearish with the dollar as it's approaching a clean 14hr supply zone. As soon as it gets tapped in I will be waiting for my lower time frame confirmation i.e. a Wyckoff distribution schematic and a clean CHOCH to the downside.
I would preferably wait for the asian high to get swept inside the zone before looking for a drop in the dollar index. I am bullish long term but, as price has broken structure a few times to the downside I would like to catch sells down towards the next demand at least.
My confluences for DXY$ Shorts are as follows:
- Price approaching a 14hr supply zone that has broken structure the downside.
- Imbalances have fully been filled and momentum has slowed down (good sign for a reversal)
- Huge trend line left way below that price would want to grab and theres also lots of liquidity below to target as take profit levels.
- In order for price to keep pushing up it will need to enter a level of demand, so as of now we will be trying to catch sells down towards a demand.
P.S. Only if my extreme 7hr supply zone gets violated, we will then know if price wants to continue in its bullish trend or not. But as of now I see price dropping more due to the perpetual BOS's. Also, as the dollar is a direct negative correlation to most of my pairs, the bias will suggest a bullish move to take place for EU, GU and gold If DXY$ decides to continue bearish.

WTI TO 73.40$WTI oil is going to continue downtrend to 73.40$ this month.
We will wait to test the level then review price moves.
Follow To Get More Signals.

Dollar Index (DXY): Top-Down Analysis & Trading Plan 💵
Dollar Index is currently approaching a solid horizontal resistance.
The market formed a head and shoulders pattern formation on that on a 4H time frame.
Monitor the reaction of the price to its neckline.
If a 4H candle closes below 105.43, a bearish movement will be expected.
Targets will be 105.16 / 104.97
❤️Please, support this video with like and comment!❤️

The Alarming Volatility of the US Dollar – A Call to Action
The recent turbulent fluctuations witnessed in the strength of the US Dollar have left experts bewildered and traders on edge. As we navigate through these uncertain times, it is crucial that we take a moment to pause and reevaluate our trading positions before potentially exposing ourselves to unnecessary risks.
The unprecedented volatility of the US Dollar has sent shockwaves across the global financial markets, stemming from a multitude of economic, political, and social events. These complexities have made it exceedingly challenging for even the most experienced traders to predict or decipher the future direction of the dollar accurately. The sudden shifts and erratic movements have destabilized not only its inherent value but also significantly influenced the correlation with other major currencies.
Given the circumstances, I implore you all to reflect upon your current dollar trading strategies. It is paramount that we reassess the potential risks and rewards associated with trading the US Dollar in the present climate. As responsible traders, it is vital to exercise caution and adjust our positions accordingly, considering the magnitude of uncertainty that envelopes the dollar's market stability.
I strongly encourage you to undertake a thorough analysis of your portfolios, taking into account the potential consequences of sustained volatility and the possible ripple effects on other currencies and financial assets. It is prudent to diversify your holdings, exploring alternative investment options that may help mitigate the potential risks associated with the current dollar turbulence.
In these challenging times, it is crucial for us to remain vigilant, responsible, and adaptable in our approach. By taking a pause and reevaluating our dollar trading strategies, we can safeguard our investments and insulate ourselves from sudden and adverse market movements. Remember, preserving capital is equally as important as pursuing profits.

Reading multi timeframe Secrethello everyone, this is my first video tutorial on this website. I hope I explained everything properly if I didn't let me know so I can make improvements...
I did have some people who contacted me how to trade, they liked my analysis so I made this video for them and also for people new to trading.. Or people who are already pro this will give a nice upgrade on there skills
for this tutorial I used DXY which is the most important index in trading and I think it's a good start for new traders so they can use DXY to trade major currencies..
please let me know how the video was?
thank you

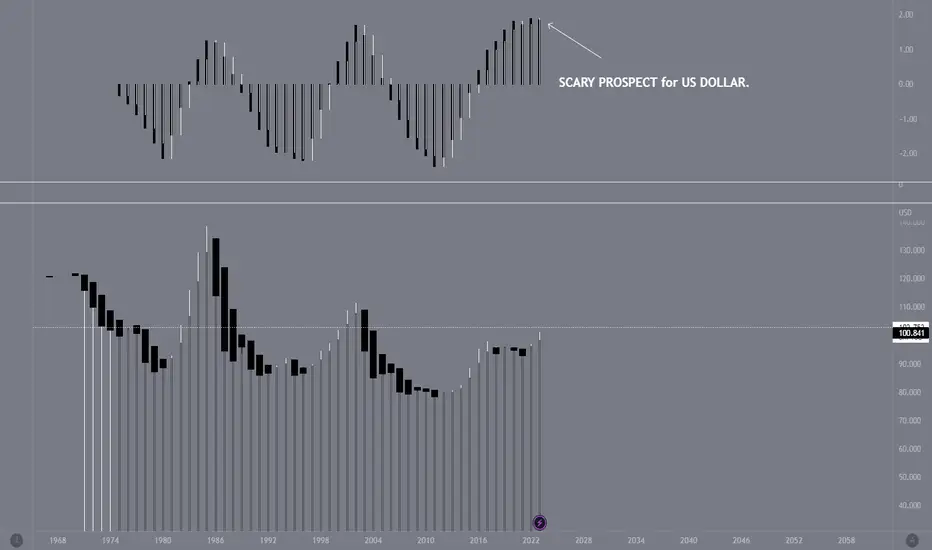
US DOLLAR 12MONTH CHART -- SCARY PROSPECT.Here's a look at DXY US DOLLAR INDEX on a 12 month chart. This year, it's the second time it signalled a big shift on the upper histogram, last time it did was 2021. Is this the start of the big fall for the USD.
This may last for a few years -- worse a decade.
Again it may or it may not happen, but the 12-month chart doesn't change mind often. I guess we'll see..
DXY up in Z and then starts to slide?The Dollar index is in its last stages of the up move and should be expected to tumble as soon as it completes the wave c of Z in this counter trend bounce we are witnessing after an impulsive move to the downside(sept 2022)
The index is expected to move towards 94-93$ mark after the new downside impulse begins.

Dollar Index IdeaGood morning, traders! Here's a quick update on the Dollar Index. It appears to be experiencing a substantial selloff, and indications point toward a repricing into lower liquidity levels.
Interestingly, in contrast, we're observing rallies in other dollar pairs, including EUR/USD. We made an attempt to take a swing position lower in EUR/USD yesterday, but as we've seen, sometimes recognizing when a trade is moving against you is an art in itself. We promptly closed that trade with zero profit, demonstrating the importance of swift decision-making.
This situation underscores the significance of monitoring correlation between currency pairs. Understanding these relationships can be instrumental in making informed trading choices.
As for the Dollar Index, it's worth noting the presence of a single-print level at 104.897, often referred to as a "liquidity void" in modern trading vernacular. This is a particularly attractive target for algorithmic trading, and it will be intriguing to see how events unfold.
Wishing you all a day of successful investing, dear traders.

DXY Peaks as Leverage Combined Positions for USD Index RiseIt is with great concern that I bring to your notice the recent surge in leverage combined positions for the USD index, coinciding with the apparent peak of the Dollar Index (DXY). This convergence of events has prompted us to urge you to exercise caution and consider pausing your USD trading activities.
Over the past few weeks, we have witnessed the DXY reaching new heights, bolstered by a series of positive economic indicators and widespread optimism. However, it is crucial to recognize that such prolonged upward trends tend to have limitations, often leading to market corrections or reversals.
The mounting leverage combined positions for the USD index indicate an increasing number of traders speculating on the dollar's continued ascent. While this may seem enticing, history has shown us that excessive optimism and overleveraging can be precursors to market downturns. As responsible traders, it is our duty to approach these situations with a level-headed perspective.
Therefore, we strongly advise you to pause and reevaluate your USD trading strategies, taking into account the current market conditions and the potential risks associated with the DXY's peak. Consider diversifying your portfolio, exploring alternative currency pairs, or even temporarily shifting your focus to other assets that exhibit more favorable risk-reward ratios.
By exercising prudence during this phase of heightened optimism, you can better protect your capital and avoid potential losses. Remember, trading is a marathon, not a sprint, and preserving your financial stability is paramount.
In conclusion, we urge you to approach USD trading with caution, recognizing the potential risks associated with the DXY's current peak and the surge in leverage combined positions. Take this opportunity to reassess your strategies, diversify your portfolio, and consider alternative trading options. By doing so, you will be better positioned to adapt and thrive in the ever-evolving world of trading.

EURUSD has revers to a bullish sentiment after the tap on the demand zone and a strong shift of 4H momentum candle that show strength of the buyers and weakness of the seller hence expecting a rise to 1.06941.

Can The Dollar Push Higher? Hey traders, welcome back.
The dollar is increasing heavily to the upside as I make this video.
Now we don't know how price will close but it is important to watch how she closes today.
If price continues this could affect the major currency pair market in a mighty way.
All Base dollar pairs could continue to increase while Quote dollar pairs could continue to decrease.
It's a patience game right now, but may be one to play if you have the right hand.

Dollar Index (DXY): Detailed Technical Outlook 💵
Multiple time frame analysis for Dollar Index.
Price action & important key levels.
Directional bias & thoughts.
Trading plan explained.
❤️Please, support this video with like and comment!❤️

Prediction of the dollar index in the long term (weekly)The dollar index has moved on the path of July 11 so far and the scenario has not changed for now
According to the left of the chart and the completion of the technical model of liquidity provision, the long-term correction of the dollar index has been completed and it has started its main movement. This break of the dollar in 2023, in my opinion, was like the rest of a sheep before going to the slaughterhouse.
2023 was a break before the slaughter of all markets and 2024 is the beginning of the fall of markets.
This is confirmed by the dollar index with targets of 114 and 121.
Of course, markets like crypto are still alive and we can see price growth in them, but soon they will also approach the crash market.
The whales are currently resting.

US-DXY SELL AFTER BREAKOUT !!!HELLO TRADERS ,
Double-Top Patterns Indicate Market Rally Could Be Nearing End
as i can see the chart DXY is holding a support zone and trading under the trend line so
outer middle east tensions are increasing day by day no ceasefire happen soon in coming days war is spreading to other nations that not good for $ it had still not touch 107.40 level in this volatility this just an idea i personally enter in sell if it break the support as it is drawn in chart with a small risk and higher rewards
Stay tuned for updates on chart

How New Dollar Highs Affect The MajorsHi my trading friends,
Have you been following the dollar and what she has been doing over this past week? If not, I got you. The dollar made a new high after pulling back in a slight downtrend over the last few weeks.
We now need to see if price can hold that high position or fall.
Let me know in the comment section below what your next move will look like!
Like this post to boost it. Reply to let me know you care.
