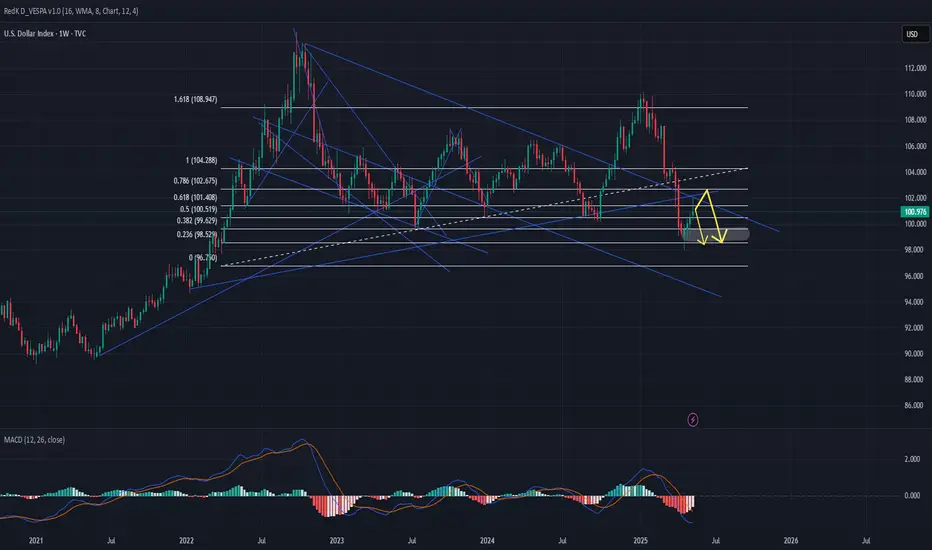
DXY Update..PWL takenGood day traders I’m back yet again with another update but this this it’s DXY(dollarindex)).
Price has taken previous week’s low, and for me that’s the manipulation phase in the power of 3 because my bias is bullish on the dollar and bearish on foreign currencies. Price has taken the PWL in a zone/area where we saw price react higher in that BPR zone/area. For the rest of the week I personally believe we can expect higher prices on DXY, Atleast till the midpoint of that gap above price. ICT teaches more on the importance of that halfway/midpoint of gaps and other PD arrays.
Since we are in a discount zone we can expect price to move higher into the premium range of the daily TF dealing range and our first liquidity (internal) is also inside the premium zone.
Dollarindex

Final BTCUSD update..Good day traders, here is my final update on BTCUSD and I like how price has been respecting our PD arrays. Keep in mind traders price moving in waves and what again😂😂🏃🏾♂️, point is today is the last trading day for the week and my thoughts is that we can expect BTCUSD to start going higher today and tomorrow maybe till Tuesday …sorry I’m being too sure but if you focus on time and price you start to KNOW(ledge) things or maybe I should say secrets?!🤨🤔
I always expect price to manipulate higher if my bias is shorts, ICT’s power of 3 works wonders when it come to this thought process.
Watch how price reacts to the FVG where price is trading now, it’s not a signal just watch out price moves always from it for the rest of today.
We only going high to shoot lower…keep that in mind!!🤯

$USPCEPIMC -U.S Core PCE (April/2025)ECONOMICS:USPCEPIMC
April/2025
source: U.S. Bureau of Economic Analysis
-The core PCE price index in the US, which excludes volatile and energy prices and is Federal Reserve's chosen gauge of underlying inflation in the US economy,
went up 0.1% from the previous month in April of 2025.
The result was in line with market expectations.
From the previous year, the index rose by 2.5% to slow from the 2.7% jump from March, the softest increase since March of 2021.

GBPJPY update!!Good day traders, I’m back with yet another beautiful setup on GJ and I really wish we can all monitor how price plays out and learn more about price signature.
For this setup I’ll explain more about it after the fact because it’ll help me make my point clearer and easily understandable.
Yet another gift..🎁🧧

Euraud final forecast!!Good day traders, I’m back with yet another update on EurAud and this time we wanna see price shoots!!

Dollar At Resistance; Will Lower CPI Cause New Drop? We had a volatile start of a new trading week.
The dollar moved higher across the board as the US and China appear to be moving toward lowering tariffs, suggesting progress toward a potential trade deal. As a result, stock futures are also trading to the upside. However, keep in mind that sharp moves on Monday can easily be reversed through the rest of the week, possibly even today, after US CPI came out lower than expected, which can cause some weakness on yeilds, and possibly FED will be ready to cut rates after-all.
So, I think that USD can still come under pressure, especially if we also consider that rise on DXY is in three legs and that a lot fo gaps from this weekend are still unfilled.

AudCad..PWL taken!!Good day traders, I’m back with another setup on AudCad and I like that previous week low was taken. We can now look at the power of 3 with higher TF in mind.
On the 4H TF price has been bearish but we can see that price left very “smooth” highs(relative equal highs) but ICT teaches us that price will always go back to make the smooth highs, smooth cries(liquidity sweep).
Before price took our low it left a FVG that’s we wanna see turn into an inverse.
The first target has to be our internal liquidity than the external liquidity that also has relatively equal highs too.

GBPAUD…being the best is a mindset!!Good day traders, I am back again with another great setup and again another opportunity to learn something new.
On the daily TF on GBpAUD we still in a bearish structure and if we use the 2022 model, we had a structure shift lower and now that price is retesting the OTE entry levels we can now expect price to shoot lower, before you asked about the recent FVG on 4H TF. That newly formed BISI is that candle that created the BPR and from what I’ve learned is that price normally shoots past BPR’s.
My poll of liquidity is resting below(weekly), that Ray line makes weekly represents previous week’s low which we want to see the market get to. Just on top of that ray line we have a FVG that price left open, we also wanna see price fill that FVG fully.

US Dollar Index - Classic Bearish PatternUS Dollar index has successfully broken down from the previous support which held strongly in the past, after support broke we saw successful retest of the support as the new resistance and got rejected from the resistance, now its heading towards the next support
Follow Our TradingView Account for More Technical Analysis Updates, | Like, Share and Comment Your thoughts.
Cheers
GreenCrypto

DXY Local Short! Sell!
Hello,Traders!
DXY is making a bullish
Rebound but a horizontal
Resistance is ahead at 100.300
Level so after the retest a
Local bearish correction
Is to be expected
Sell!
Comment and subscribe to help us grow!
Check out other forecasts below too!
Disclosure: I am part of Trade Nation's Influencer program and receive a monthly fee for using their TradingView charts in my analysis.

Gold is Giving up Set ups this week! Lets get it!Nice run up yesterday. Looking for it to continue. Want to see a nice pull back to give us entry for it to continue. Its a waiting game to wait for the killzones for best entries!

U.S. Dollar Index Set for Bearish Continuation The U.S. Dollar Index (DXY) has completed a five-wave impulse decline (labeled (1) through (5)) from the top of the descending channel. This downward move suggests a completed impulsive bearish leg. Following that, we’ve seen a complex corrective structure – a WXY double zigzag correction – now complete.
Price action shows a rejection from the upper trendline resistance near wave (2), confirming the bearish structure remains intact. The bounce into the corrective high (wave (2)) failed to break above key resistance, and we are now potentially entering a new impulsive move down labeled as wave (3) of the next larger degree impulse.
Primary Impulse Decline: Wave (1) to (5): Classic 5-wave move down ending late April.
Corrective Phase: Complex WXY correction (with subwaves A-B-C in both W and Y).
Current Wave in Play: Wave (3) of a larger impulsive sequence is initiating.
T1: 99.172
T2: 98.013
SL: 101.259
If price closes above 101.265 the current bearish impulse scenario would be invalidated.

Market Analysis For DXY: Week of May 19thThe DXY has an interesting weekly chart with some key levels that could support further bearish price action.

DXY - Dollar Index AnalysisThe U.S. Dollar Index (DXY) remains in a bearish zone, as indicated by the current weekly chart. There is potential for further downside movement toward the 99.70 level, which serves as a strong support area. If this level is breached, the next key support could be found near 98.56.
Alternatively, the index may experience a short-term correction to the upside. A breakout above 101.40 could trigger a move toward the 102.40 resistance level. However, this upward movement is likely to be limited, and the broader trend suggests a probable return to bearish momentum, potentially driving the index back down toward 98.56.
DXY Bullish Rebound Expected! Buy!
Hello,Traders!
DXY is making a local
Bearish correction towards
The horizontal support level
Around 100.200 but we are
Locally bullish biased so
After the retest we will be
Expecting a local bullish rebound
Buy!
Comment and subscribe to help us grow!
Check out other forecasts below too!
Disclosure: I am part of Trade Nation's Influencer program and receive a monthly fee for using their TradingView charts in my analysis.

Gold had Swept Lows and Filled Bullish Gaps! Reversal next?This is price action that I was patiently waiting for. Now that we have that sweep lows Im looking for signs price want to turn around. It can remain bearish for now. But Im expecting to see something clear by the time we get inside of the killzone.

DXY Sell this rally. Bearish until end-of-year.The U.S. Dollar index (DXY) has been trading within a Channel Down since the September 26 2022 High and is currently on a medium-term Bearish Leg. The last 3 weeks however have been a short-term rebound (all 1W candles green), but the price is still below both the 1W MA200 (orang trend-line) and the 1W MA50 (blue trend-line).
This doesn't alter the bearish trend as this is not the first time we've seen this price action. More specifically, DXY also made a short-term rebound during the first Bearish Leg of the pattern and rebounded on January 30 2023 back to the 1W MA50. This delivered a strong rejection which eventually completed the Bearish Leg with one last round of selling to complete a -13.30% Bearish Leg in total.
Before that, we also saw the same pattern (also on 1W RSI terms) in 2020, when on August 31 2020 the price again had a short-term rebound only to resume the bearish trend and finish the sequence again at -13.40% from the top.
As a result, as long as the price remains (closes) below the 1W MA50, the last sell signal is given when the 1W RSI breaks above its MA (yellow trend-line) and then we can expect the Bearish Leg to complete a -13.30% decline with a 96.000 Target.
-------------------------------------------------------------------------------
** Please LIKE 👍, FOLLOW ✅, SHARE 🙌 and COMMENT ✍ if you enjoy this idea! Also share your ideas and charts in the comments section below! This is best way to keep it relevant, support us, keep the content here free and allow the idea to reach as many people as possible. **
-------------------------------------------------------------------------------
💸💸💸💸💸💸
👇 👇 👇 👇 👇 👇

Bearish revrsal off pullback resistance?US Dollar Index (DXY) is rising towards the pivot and could reverse from this level to the 1st support.
Pivot: 101.78
1st Support: 98.90
1st Resistance: 103.41
Risk Warning:
Trading Forex and CFDs carries a high level of risk to your capital and you should only trade with money you can afford to lose. Trading Forex and CFDs may not be suitable for all investors, so please ensure that you fully understand the risks involved and seek independent advice if necessary.
Disclaimer:
The above opinions given constitute general market commentary, and do not constitute the opinion or advice of IC Markets or any form of personal or investment advice.
Any opinions, news, research, analyses, prices, other information, or links to third-party sites contained on this website are provided on an "as-is" basis, are intended only to be informative, is not an advice nor a recommendation, nor research, or a record of our trading prices, or an offer of, or solicitation for a transaction in any financial instrument and thus should not be treated as such. The information provided does not involve any specific investment objectives, financial situation and needs of any specific person who may receive it. Please be aware, that past performance is not a reliable indicator of future performance and/or results. Past Performance or Forward-looking scenarios based upon the reasonable beliefs of the third-party provider are not a guarantee of future performance. Actual results may differ materially from those anticipated in forward-looking or past performance statements. IC Markets makes no representation or warranty and assumes no liability as to the accuracy or completeness of the information provided, nor any loss arising from any investment based on a recommendation, forecast or any information supplied by any third-party.

USDJPY Set to Rise as Support Holds and Dollar Finds TailwindsUSDJPY looks poised for further upside following a period of consolidation and a successful retest of strong support around the 140.50 level. The weekly chart reveals a clear triple bottom pattern, reinforcing the strength of this support zone and suggesting renewed bullish momentum.
The US Dollar is starting to regain strength after a period of weakness, supported by improving U.S. economic data, sticky inflation, and a less dovish stance from the Federal Reserve. In contrast, Japan is unlikely to change its ultra-loose monetary policy in the near term, keeping rate differentials wide and favoring a stronger Dollar.
With the Bank of Japan expected to hold rates steady for the foreseeable future, capital is likely to continue flowing out of the yen. Carry trade flows remain intact, adding to the upward pressure on USDJPY.
Momentum indicators are turning higher, and price action is forming a steady base for another leg up. The market could target the 150 zone in the coming weeks, where the 50-week moving average may act as initial resistance.
As long as 140.50 holds, dips could offer attractive buying opportunities. A sustained move above 145.00 could trigger fresh bullish momentum and accelerate gains.

DXY Rebounds on Fed Pause and Trade Deal Hopes.Macro approach:
- DXY edged higher, recovering earlier losses as the Fed held rates and Powell was cautious.
- Jun cut hopes faded, though markets expect three cuts this year, potentially lifting DXY short-term.
- A potential US-UK trade deal also helps ease bearish sentiment on the dollar.
Technical approach:
- DXY is hovering around the key resistance at around 100.200, confluence with EMA21, indicating a potential short-term correction.
- If DXY closes above the resistance at 100.200, the price may continue to claim to retest the following resistance at 101.800.
- Conversely, closing below the current trendline may lead DXY to retest the swing low at around 98.000.
Analysis by: Dat Tong, Senior Financial Markets Strategist at Exness

Bullish bounce?US Dollar Index (DXY) is falling towards the pivot and could bounce to the 1st resistance.
Pivot: 99.61
1st Support: 99.36
1st Resistance: 100.03
Risk Warning:
Trading Forex and CFDs carries a high level of risk to your capital and you should only trade with money you can afford to lose. Trading Forex and CFDs may not be suitable for all investors, so please ensure that you fully understand the risks involved and seek independent advice if necessary.
Disclaimer:
The above opinions given constitute general market commentary, and do not constitute the opinion or advice of IC Markets or any form of personal or investment advice.
Any opinions, news, research, analyses, prices, other information, or links to third-party sites contained on this website are provided on an "as-is" basis, are intended only to be informative, is not an advice nor a recommendation, nor research, or a record of our trading prices, or an offer of, or solicitation for a transaction in any financial instrument and thus should not be treated as such. The information provided does not involve any specific investment objectives, financial situation and needs of any specific person who may receive it. Please be aware, that past performance is not a reliable indicator of future performance and/or results. Past Performance or Forward-looking scenarios based upon the reasonable beliefs of the third-party provider are not a guarantee of future performance. Actual results may differ materially from those anticipated in forward-looking or past performance statements. IC Markets makes no representation or warranty and assumes no liability as to the accuracy or completeness of the information provided, nor any loss arising from any investment based on a recommendation, forecast or any information supplied by any third-party.

US INDEX (DXY) TIME TO BUY !!!HELLO TRADERS
As i can see this chart created a harmonic pattren and it crystal clear showing the levels till it hold above our design Stop Loss Trade War Talks and NFP results with slowing down the inflation shows us that $ will recover from this zone if not break SL make a proper research befor taking any trade we appriciate your cooments and support us Stay Tuned for more updates ...

EURUSD Outlook: Head & Shoulder or Bear Trap?Mirroring the DXY, the EURUSD appears to be holding below the neckline of a head and shoulders pattern formed from the 1.1570 highs.
However, it still requires confirmation with a sustained move below 1.1270 to extend the forecast toward 1.1140 and 1.1040.
On the upside, if the 1.1270 support holds, EURUSD may reverse course, confirming a failed pattern and potentially rebounding toward 1.1420, 1.1470, and 1.1570.
From a monthly perspective, the EURUSD is pulling back above the upper boundary of the long-respected channel extending from the 2008 highs, currently holding near the key 1.1270 support. This may signal a short-term trend reset before markets regain directional clarity.
Written by: Razan Hilal, CMT
