GOLD is bullish, but is it giving a Entry?Extremely bullish on Gold but looking for the safe entry before getting in for the run. It looks like they want to pull back. Just have to wait it out and see if it lines up inside of the killzone.
Dollarindex

Dollar scenario 17/03/2025English : According to our analysis, we anticipate a BULLISH scenario.
Morocan Darija : kanchofo d'apres l'analyse dyalna antsanaw TLO3
ATENTION : I only share my ideas, not signals.

DXY biasSorry for my absense these days, to an extent, I still seeing Dollars going up, but with this intermediate bias, I suggest that assets or currencies against dollar will still go up, while dollars would likely drop following last friday.

Sit on hands! Wait for Gold to reveal its move!Letting monday play out. We should get a better, clear move on Tuesday after price has moved to establish a low for the week. not trying to be to early to the party so we wait for now.

DXY Dollar Index Market Bearish Heist Plan🌟Hi! Hola! Ola! Bonjour! Hallo!🌟
Dear Money Makers & Robbers, 🤑 💰🐱👤🐱🏍
Based on 🔥Thief Trading style technical and fundamental analysis🔥, here is our master plan to heist the DXY Dollar Index Market. Please adhere to the strategy I've outlined in the chart, which emphasizes short entry. Our aim is the high-risk Green Zone. Risky level, oversold market, consolidation, trend reversal, trap at the level where traders and bullish thieves are getting stronger. 🏆💸Book Profits Be wealthy and safe trade.💪🏆🎉
Entry 📈 : "The heist is on! Wait for the breakout (37800) then make your move - Bearish profits await!"
however I advise placing Sell Stop Orders below the breakout MA or Place Sell limit orders within a 15 or 30 minute timeframe. Entry from the most recent or closest low or high level should be in retest. I Highly recommended you to put alert in your chart.
Stop Loss 🛑: Thief SL placed at 38500 (swing Trade Basis) Using the 4H period, the recent / swing high or low level.
SL is based on your risk of the trade, lot size and how many multiple orders you have to take.
Target 🎯: 36500 (or) Escape Before the Target
🧲Scalpers, take note 👀 : only scalp on the Short side. If you have a lot of money, you can go straight away; if not, you can join swing traders and carry out the robbery plan. Use trailing SL to safeguard your money 💰.
📰🗞️Fundamental, Macro, COT, Sentimental Outlook:
DXY Dollar Index Market is currently experiencing a Bearish trend., driven by several key factors.
⚡Fundamental Analysis
Fundamental factors driving DXY focus on U.S. economic conditions, Fed policy, and global currency dynamics.
Interest Rates:
U.S. Federal Reserve: Rates steady at 3-3.5%, down from 2024’s 4.5-5%. Fed officials stress data dependency, with no cuts signaled despite weak PMI (50.4) and jobless claims (219,000 vs. 215,000 forecast). Real yields (10-year Treasury at 3.8%, ~1% inflation-adjusted) support USD.
Other Countries: ECB at 2.5%, BoJ at 0.25-0.5%, BoE at 4-4.5%—U.S. yield advantage persists, though narrowing.
Impact: Bullish for DXY, tempered by global easing.
Inflation:
U.S.: PCE at 2.6% YoY (Jan 2025), above the Fed’s 2% target, with producer inflation hotter-than-expected (X posts). Inflation fears linger, supporting USD.
Other Countries: Eurozone at 2.8%, Japan at 2.5%, UK at 2.5-3%—global inflation pressures USD rivals less.
Impact: Bullish, as U.S. inflation sustains Fed hawkishness.
Economic Growth:
U.S.: Mixed signals—PMI at 50.4 (near stagnation), jobless claims up, but ADP jobs beat at 183,000 (Jan 2025). Tariffs add uncertainty.
Other Countries: China at 4.5% (slowing), Eurozone at 1.2%, Japan at 1%—U.S. outperforms peers.
Impact: Mildly bullish, U.S. resilience aids USD.
Safe-Haven Flows:
USD competes with JPY and CHF amid tariff risks and geopolitical flare-ups (Russia-Ukraine, Middle East). Recent yen strength (X posts) pressures DXY.
Impact: Mildly bearish, global risk-off challenges USD dominance.
Trade Balance:
U.S. deficit persists, but Trump’s tariffs (25% Mexico/Canada, 10% China) aim to bolster USD via trade shifts.
Impact: Bullish long-term, short-term neutral.
⚡Macroeconomic Factors
U.S.-focused with global context:
U.S. Policy: Fed’s tighter stance vs. global easing (ECB, BoJ) favors USD. Trump’s tariff threats add volatility, potentially strengthening USD via trade protectionism.
Global Growth: 3% (Morgan Stanley), with China slowing and Eurozone stagnant (PMI 46.2). U.S. relative strength supports DXY.
Commodity Prices: Oil at $70.44 pressures import-heavy peers (Japan), mildly weakening JPY vs. USD.
Currency Dynamics: Yen strength and EUR softness (EUR/USD below 1.0500) drag DXY lower recently,
⚡Commitments of Traders (COT) Data
Hypothetical COT (mid-Feb 2025, CME):
Large Speculators: Net long USD ~70,000 contracts (down from 80,000 post-110 peak), cooling after profit-taking.
Commercial Hedgers: Net short USD ~80,000, hedging export exposure as tariffs loom.
Open Interest: ~150,000 contracts, stable, reflecting U.S. trader engagement.
Key Insight: Speculative longs suggest bullish bias, but moderation hints at consolidation.
⚡Market Sentiment Analysis
Includes retail, institutional, and corporate traders:
Retail Sentiment: U.S. retail traders likely 60% short DXY at 106.000 (hypothetical broker data), betting on yen/CHF gains. Contrarian upside risk if shorts unwind.
Institutional Traders: U.S. funds (e.g., Citi, HSBC) mixed—bearish short-term (DXY to 96.87, Citi Hong Kong), bullish long-term (WalletInvestor to 119.193). Sentiment leans cautious.
Corporate Traders: U.S. exporters hedge at 106.50-107.00, neutral as tariffs loom; European firms favor EUR weakness.
Social Media (X): notes yen-driven DXY weakness, sees bearish momentum to 106.15—trending bearish.
Broker Data: U.S. IG sentiment ~55% long—balanced positioning.
⚡Quantitative Analysis
Moving Averages: 50-day SMA (106.30), 200-day SMA (105.50)—price below 50-day, above 200-day, neutral signal.
RSI: 45 (daily), bearish momentum fading, room for reversal.
Bollinger Bands: 105.80-106.80 range, 106.000 at midpoint—consolidation likely.
Fibonacci: 38.2% retracement from 110.00-102.50 at 105.62—key support holds.
Volatility Model: Implied volatility (1-month) at 7%, suggesting 0.75-point monthly range (±0.7%).
⚡Intermarket Analysis
USD/JPY: At 150.00, yen strength pressures DXY; drop to 145 could accelerate declines.
EUR/USD: Below 1.0500, EUR weakness supports DXY mildly.
Gold: XAU/USD at 2940 (risk-off proxy) inversely pressures USD.
Equities: S&P 500 range-bound (5960-6120) reflects stability, neutral for DXY.
Bonds: U.S. 10-year yield at 3.8% vs. JGB at 0.9%—yield gap aids USD.
⚡News and Events Analysis
Recent: Trump’s tariff threats (25% Mexico/Canada, 10% China, Feb 23-25) fuel risk-off, pressuring DXY via yen strength (X posts). Weak U.S. PMI and jobless claims offset by PCE at 2.6% (Jan 2025).
Upcoming: U.S. PCE data (Feb 28) critical—hotter data could lift DXY, softer data bearish. Fed rhetoric pending.
Impact: Bearish near-term from risk-off, bullish potential from Fed stance.
⚡Overall Summary Outlook
DXY at 106.000 balances U.S. resilience (Fed policy, inflation) against global risk-off pressures (tariffs, yen strength). Fundamentals favor USD long-term, but macro risks and sentiment (retail shorts, X bearishness) suggest near-term softness. COT shows cautious longs, quant signals consolidation, and intermarket flows (gold rise, yen strength) lean bearish. Short-term dip to 105.50-105.91 likely, medium-term range-bound with a bullish tilt if Fed holds firm.
⚡Future Prediction
Bullish Case: DXY to 108.00-110.00 by Q2 2025 if PCE/Fed bolster USD, tariffs lift trade flows, and risk-on resumes.
Bearish Case: Drop to 103.50-105.00 if yen/CHF surge, tariffs falter, or Fed dovishness emerges.
Prediction: Mildly bearish short-term to 105.50, then bullish to 108.00 by mid-2025, driven by Fed policy divergence.
⚠️Trading Alert : News Releases and Position Management 📰 🗞️ 🚫🚏
As a reminder, news releases can have a significant impact on market prices and volatility. To minimize potential losses and protect your running positions,
we recommend the following:
Avoid taking new trades during news releases
Use trailing stop-loss orders to protect your running positions and lock in profits
💖Supporting our robbery plan will enable us to effortlessly make and steal money 💰💵 Tell your friends, Colleagues and family to follow, like, and share. Boost the strength of our robbery team. Every day in this market make money with ease by using the Thief Trading Style.🏆💪🤝❤️🎉🚀
I'll see you soon with another heist plan, so stay tuned 🤑🐱👤🤗🤩

$DXY: Dollar Strength or Dollar Dip?(1/9)
Good afternoon, everyone! 🌞 DXY: Dollar Strength or Dollar Dip?
With the DXY at 103.732, is the dollar flexing its muscles or ready to stumble? Let’s break it down! 🔍
(2/9) – PRICE PERFORMANCE 📊
• Current Price: 103.732 as of Mar 14, 2025 💰
• Recent Move: Near recent levels, down from 110.18 peak (web data) 📏
• Sector Trend: Forex markets volatile, with trade and policy shifts 🌟
It’s a wild ride—dollar’s dancing on the edge! ⚙️
(3/9) – MARKET POSITION 📈
• Role: Measures USD vs. euro, yen, pound, and more 🏆
• Influence: Drives forex and commodity prices globally ⏰
• Trend: Balancing U.S. policy and global demand, per data 🎯
King of currencies, but not without challengers! 🚀
(4/9) – KEY DEVELOPMENTS 🔑
• Trade Tensions: U.S.-China tariff talks ongoing, per data 🌍
• Rate Cut Bets: Markets eyeing Fed moves, per posts on X 📋
• Market Reaction: Holding steady at 103.732 amid mixed signals 💡
Navigating a storm of global pressures! 🛳️
(5/9) – RISKS IN FOCUS ⚡
• Rate Cuts: Could weaken dollar if Fed acts, per X sentiment 🔍
• Trade Wars: Tariffs disrupting supply chains, per data 📉
• Global Growth: Slowdowns hitting demand for USD ❄️
It’s a tightrope—risks aplenty! 🛑
(6/9) – SWOT: STRENGTHS 💪
• Reserve Status: USD’s global dominance holds firm 🥇
• U.S. Economy: Still a powerhouse, supporting dollar value 📊
• Safe Haven: Attracts flows in uncertain times, per trends 🔧
Got muscle to flex when it counts! 🏦
(7/9) – SWOT: WEAKNESSES & OPPORTUNITIES ⚖️
• Weaknesses: Vulnerable to rate cuts, trade spats 📉
• Opportunities: Strong U.S. data could lift it higher, per outlook 📈
Can it hold the line or break out? 🤔
(8/9) – POLL TIME! 📢
DXY at 103.732—your take? 🗳️
• Bullish: 105+ soon, dollar rallies 🐂
• Neutral: Steady, risks balance out ⚖️
• Bearish: 100 looms, dollar dips 🐻
Chime in below! 👇
(9/9) – FINAL TAKEAWAY 🎯
The DXY’s 103.732 shows it’s steady but tested 📈. Trade wars and Fed moves could swing it either way—dips are our DCA gold 💰. Buy low, ride high—time’s the key! Gem or bust?

Indian market cannot go bullish until RUPEE becomes strong !a lot of analysts saying Dollar is going to week vs rupees but seeing technical chart, dollar is traded above 50 EMA and never come to touch since October. currently Dollar completed Symmetrical Pattern showing any upcoming momentum may happen, either bullish or bearish is just could say after seeing breakout/breakdown this pattern. To gain strength in Rupee it is required to give USDINR 50EMA breakdown or bearish crossover. Till then the rupee will remain weak and Indian stock market also.

Confirmed Breakout!!! wait for the pullback on Gold!The price action I was looking for yesterday didnt happen till mid London session after i stopped looking. Now that we have confirmed bullish im looking for a pull back inside of a gap before taking any entry.

The Dollar Index has reversed upward.Hey everyone!
Looks like a solid entry for a DXY long and a good time to start ditching EUR and Gold (yes, I do think gold is heading down).
On the daily chart, we can see that we've completed five waves down and are now forming a reversal.
EUR/USD and GOLD/USD have already started reacting, Index Dollar (DXY) hitting the 61.8% Fibonacci retracement level.
Now the climb begins, with the first target around 125 for the Dollar Index.
The potential peak?
144, though we’ll likely see corrections along the way.
Buckle up—volatile times ahead... 🧐🧐🧐

DXY in 1 H timeframeDXY Analysis on RTM Style
Here’s an analysis of the **U.S. Dollar Index (DXY) on the 1H timeframe** based on the **RTM (Read The Market) style** and your drawn arrows:
Previous Trend & Break of Structure (BoS)**
- The market has been in a strong downtrend, forming **Lower Lows (LL) and Lower Highs (LH)**.
- After breaking the **105.485 level (0.5 Fibonacci retracement)**, the bearish momentum continued down to the **103.5 support zone**.
Liquidity Zones & Potential Reversal**
- The price is currently consolidating around **103.5**, indicating a possible reaction from buyers.
- A **Higher High (HH)** is marked, suggesting a potential shift in market structure.
Possible Scenario Based on the Arrows**
- A short-term **accumulation phase** is expected between **103.5 - 104**.
- If the price breaks above **103.998**, bullish momentum may drive it toward the **105.5 - 106.7 zone (Fibonacci 0.5 & 0.786 retracement levels)**.
- If this resistance is broken, the final target could be **107.27**, a strong resistance level.
- The market is at a **key support level** and may form a bullish structure.
- Confirmation of a **Higher High** and a break above **103.998** could trigger an upward move.
- **Re-Accumulation** is expected before a strong bullish continuation.
- **Bearish Alternative**: If the **103.5 support** fails, the price may drop further to **102.1**.
This analysis is suitable for publishing, but I recommend adding an alternative scenario in case the support fails, giving a more well-rounded outlook.

Dollar Index(DXY) Rebounds from Key Support–Is a New High Cominghello guys.
Let's see what happened for us index and what will happen:
Uptrend Support:
The price has been respecting a long-term ascending trendline since 2011, indicating a strong bullish structure.
Recent price action suggests that the index retested this trendline and bounced off it.
Key Resistance & Breakout Potential:
The index is in a consolidation phase after reaching a local high.
If the price holds above the trendline and breaks the previous high (~13,250-13,400), it could trigger further upside movement.
The next potential target is near 13,500-13,800 based on historical price action and Fibonacci extensions.
-------------------------------------------------
Possible Scenario:
Bullish Case: If the price holds above the trendline and breaks the current range resistance, it could continue toward new highs.
Bearish Case: A breakdown below the 12,800 support level could lead to a deeper correction toward 12,400-12,000.
-------------------------------------------------
Consequences of This Move:
For USD Strength:
A bullish continuation in the Dollar Index means a stronger USD, which could negatively impact commodities (gold, oil) and emerging market currencies.
Forex pairs like EUR/USD and GBP/USD could decline as the USD gains strength.
For Global Markets:
A weaker DXY (if the support breaks) would typically support equity markets and commodities like gold and Bitcoin, as a weaker dollar makes them more attractive.
-------------------------------------------------
Conclusion:
The chart suggests bullish momentum, but confirmation is needed with a breakout above 13,250-13,400.
As long as the price respects the trendline and Fibonacci support, the uptrend remains intact.
Keep an eye on macroeconomic events (e.g., Fed rate decisions, inflation data), as they can impact this movement significantly.

Waiting for GOLD to Act right!Looking for a bullish play but waiting for price to get the shakes out. It is stuck inside of rotational value on a much larger scale. Need to see it break outside of that Value.

The US index is at support level for again pull backThe US index is at support level; just mark the news of Dollars today and wait for confirmations on the H4 level to take the good trades.
Keep in mind!!!!!
If the US index gains some strength from the said level (103.84–103.10) and starts bullish, then the major pairs like EURUSD, GBPUSD, and XAUUSD start falling.

DXY ( US dollar ) $ In my opinion, the index will continue to fall from 101.474 to 100.938, and then start to move up from that area to 107.255.

Dollar IndexWe are expecting Dollar to go up slowly, if CPI is planning top drop dollar in the later part of the week.

DXY Will Go UP! Buy!
Hello,Traders!
DXY keeps falling down
But the index will soon
Hit a horizontal support
Level of 103.610 and
After the retest a local
Bullish correction
Will be expected
Buy!
Comment and subscribe to help us grow!
Check out other forecasts below too!
Disclosure: I am part of Trade Nation's Influencer program and receive a monthly fee for using their TradingView charts in my analysis.

CLOSED MARKET Review on Upcoming Week for Gold!Taking the time to empty out my thoughts as we get ready for another week. NFP last week held up a lot of price action that could of happened. now that we are past it we should get some significant moves. just have to wait for the killzones.

Falling towards overlap support?US Dollar Index (DXY) is falling towards the pivot and could bounce to the 1st resistance.
Pivot: 103.53
1st Support: 102.36
1st Resistance: 105.62
Risk Warning:
Trading Forex and CFDs carries a high level of risk to your capital and you should only trade with money you can afford to lose. Trading Forex and CFDs may not be suitable for all investors, so please ensure that you fully understand the risks involved and seek independent advice if necessary.
Disclaimer:
The above opinions given constitute general market commentary, and do not constitute the opinion or advice of IC Markets or any form of personal or investment advice.
Any opinions, news, research, analyses, prices, other information, or links to third-party sites contained on this website are provided on an "as-is" basis, are intended only to be informative, is not an advice nor a recommendation, nor research, or a record of our trading prices, or an offer of, or solicitation for a transaction in any financial instrument and thus should not be treated as such. The information provided does not involve any specific investment objectives, financial situation and needs of any specific person who may receive it. Please be aware, that past performance is not a reliable indicator of future performance and/or results. Past Performance or Forward-looking scenarios based upon the reasonable beliefs of the third-party provider are not a guarantee of future performance. Actual results may differ materially from those anticipated in forward-looking or past performance statements. IC Markets makes no representation or warranty and assumes no liability as to the accuracy or completeness of the information provided, nor any loss arising from any investment based on a recommendation, forecast or any information supplied by any third-party.

The US Dollar Index is Decreasing - Positive for Cryptocurrency#DXY #Analysis
Description
---------------------------------------------------------------
+ The Dollar Index has breached its support level and is now trading below it, moving toward the next support zone around $100.
+ This development is positive for Bitcoin and the broader cryptocurrency market, as the US Dollar Index typically declines during a bull run.
+ In the long term, I anticipate further declines, potentially reaching the $90 range.
---------------------------------------------------------------
Enhance, Trade, Grow
---------------------------------------------------------------
Feel free to share your thoughts and insights. Don't forget to like and follow us for more trading ideas and discussions.
Best Regards,
VectorAlgo

DXY SWING LONG|
✅DXY is approaching a demand level of 103.500
So according to our strategy
We will be looking for the signs of the reversal in the trend
To jump onto the bullish bandwagon just on time to get the best
Risk reward ratio for us
LONG🚀
✅Like and subscribe to never miss a new idea!✅

DXY will likely bounce here.#dxy the USD Index has dumped , oversold and looks likely wants to bounce here. Bouncing here will give the bullish retest to TVC:DXY .
While #VIX the Volatility Index is very strong now, an impulsive move of #dollarindex will surely damage markets sooner or later. This' not a very short term strategy but short / mid term one. Lowering risky positions will be for your goodness.
Not financial advice. Stay safe.

US Dollar Index Short Term Sell IdeaH4 - Strong bearish momentum
Lower lows
Until the two strong resistance zones hold my short term view remains bearish here.

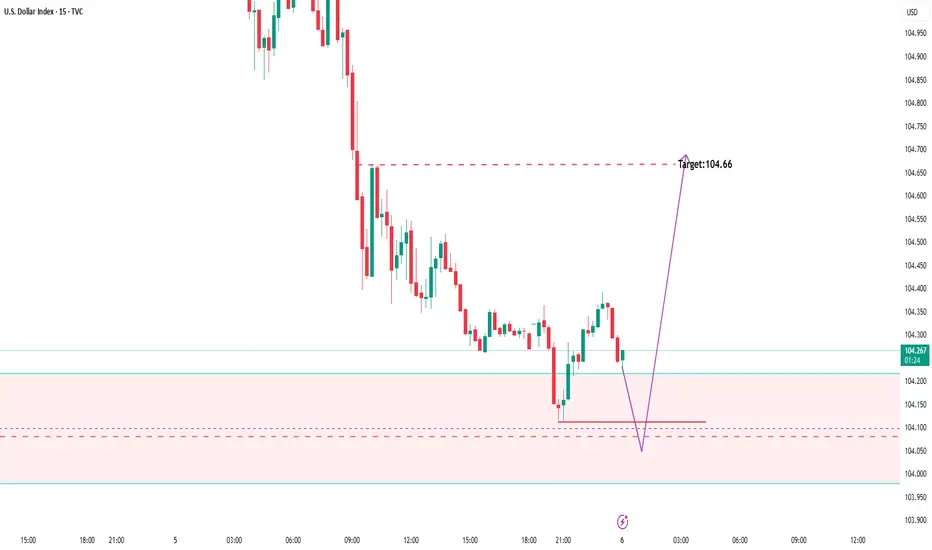
DXY, About to rally upwardHello guys,
A short quick update on dollar index, we are going to see a temporary upward rally in the dollar index, I am just posting the low hanging fruit target which is very high probability to achieve. and we will defiantly see the momentum changing from bearish to bullish.
NFP protocol: Keep the risk low