FREE ANALYSIS ON USDJPY - keep an eye outFREE ANALYSIS ON USDJPY
Welcome to SiriusTrading
-
1 HOUR Chart
USDJPY could make one more bullish run to around 106.255 or even higher at 106.600. From then we should see more move to the downside. Watch That top for more downside
Support us with your likes and comments
Dollaryen

USDJPY Ascending Trend Line BreakoutIn the hourly time frame we see price pushed up to an important level of resistance and then reject below breaking out of its respected uptrend. The Market is showing us that price can begin consolidating at the key swap level price is at right now and this breakout could be an exhaustion for the bulls before they come back in with another impulsive push up breaking our resistance or this can be a breakout, pull back and price pushes down to our key support level.

Dollar yen double top UJ looking like a double top so
my
entry: 108..02
profit: 107.42
stop loss right above that liquidity pocket at the highs
108.67 or so

USDJPY After Double BottomRecently the Dollar/Yen had activity near the 107.200 zone.
Breaking the last bearish structure with this pattern, its time to wait for a pullback to the nearest support (blue rectangle and continue bullish to 110.600.

4 - USDJPY - FX Majors | Reversal & Impulse | July 2019USDJPY labeled within a Complex Bearish Triple Three pattern in Intermediate (B) (blue).
Patterns:
- Minor Z (purple) - Regular Flat
- Minute a (red) - Three Swings sequence
- Minute b (red) - Double Three
Minor Z (purple) is expected to resume for the down-trend with Minute c (red), in an impulsive manner.

USDJPY - Selling at the top of the channelTrade Idea
Trading within a Bearish Channel formation.
Bespoke resistance is located at 108.10.
There is scope for mild buying at the open but gains should be limited.
Preferred trade is to sell into rallies.
Further downside is expected although we prefer to set shorts at our bespoke resistance levels at 108.20, resulting in improved risk/reward.
We look to Sell at 108.20
Stop: 108.50
Target 1: 107.10
Target 2: 106.50

USDJPY - FX Majors | Patterns & Waves | June-July 2019
USDJPY labeled within a Complex Bearish Triple Three pattern in Intermediate (B) (blue).
Minor Z (purple) is expected to resume for the down-trend, in an impulsive manner.


Looking for a rally and then??Looking at the bigger picture on USDJPY, I am expecting to see a rally over the coming months which should see price reach 118 comfortably and possibly as high as 120. From that point I will be waiting for a reversal to confirm where there will be a significant move to the downside being the second impulse after the correction is complete.

USDJPY Bearish ReversalTrade Background:
Price broke off a bullish trend channel last week on May 23th. Since then price has been trading in a bearish channel. Now price is testing final resistance level again.Which gives us traders a good opportunity to short this pair with limited risk. In addition, with the global equity market nearing correction territory, it could give the Yen a bullish push.
Trade Idea:
Positioning: Short
Time frame: 1H
Length of Trade: 1 day to 3 days
Entry: Between 109.350 to 109.450
Stop: 109.500
Exit: 109.150

Yen Still Strong Versus DollarGood morning traders.. As you see on the chart H4 above, this pair USD JPY still has negative momentum and will be continue bearish. Bearish intermediate impuls wave 3 can be support this projection..

UJ - 30/4/19Been looking at this downtrend, once price hits that trendline, I'm selling as long as price respects the trendline.
If you are part of my free telegram channel, you would have seen that I have been anticipating the sell at 112 area (black arrow pointing down). However, we had a 39 pip draw down in which small accounts may have been stopped out (fakeout). As you can clearly see price has sold and if you entered when I sent that trade, you would be in 50 pips profit. To join my free telegram channel, head over to my twitter (in bio) and click the link in my pinned tweet.

NeutralUSD/JPY is in a flat correction where it has completed the leg A and B, now to finish the remaining C leg, it has to come down in 5 waves but after then it will either reverse to the downside or continue the bullish trend to the upside

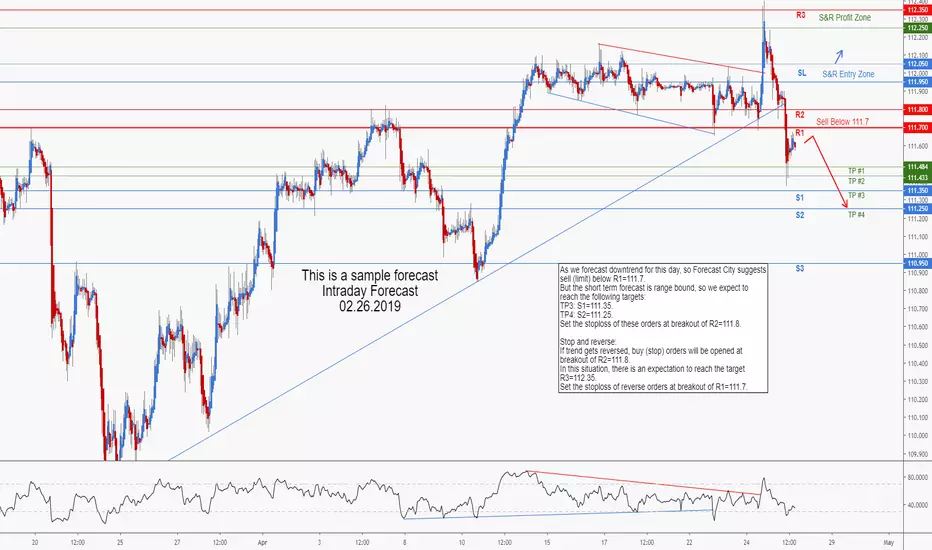
USDJPY Intraday ForecastAs we forecast downtrend for this day, so Forecast City suggests sell (limit) below R1=111.7.
But the short term forecast is range bound, so we expect to reach the following targets:
TP3: S1=111.35.
TP4: S2=111.25.
Set the stoploss of these orders at breakout of R2=111.8.
Stop and reverse:
If trend gets reversed, buy (stop) orders will be opened at breakout of R2=111.8.
In this situation, there is an expectation to reach the target R3=112.35.
Set the stoploss of reverse orders at breakout of R1=111.7.
If you would like to trade in the next 24 hours , the intraday forecasts of ForecastCity will show you the most accurate and the most likely actions and swings of the market. Our intraday forecasts are available before those of all the other sites. Our intraday forecasts are available very early in the day. It is one of ForecastCity’s glorious and positive qualities. This quality has made us the first forecaster that forecast tomorrow for you!
USD JPY Waiting For A Dragon Pattern H4As you see on the chart H4 above, USD JPY still bullish but weak power, wait and see the correction moment.....

USDJPY Long-Term Short, Resistance Range Too Strong to SurpassThe conversation on the Japanese yen is as much about the US economy as much as it is about the Japanese economy. This is mainly due to the fact that the Japanese yen acts as a safe haven asset during times of downward volatility, even if that volatility stems from Japan such as the natural and nuclear disasters that rocked the archipelago nation in 2011. Moreover, while the more common tools of prediction like ordinary least squared models can provide a bit of accuracy in price action, it clearly lacks a precise target. This is especially the case given technical resistance and support levels even though the Pearson’s R statistic suggests a high degree of model fitness.
Nonetheless, the macroeconomic trends suggest that while there is a 95 percent probability that price action moves to a range of 111.705 and 112.157 by the end of April, observers should not be surprised if price action moves towards the lower end of the 95 percent confidence interval towards a range of 109.595 and 109.771. These primarily include the continued downgrading of global economic growth by the EU, the IMF, the OCED, and the World Bank. Truly, there is now a global growth slowdown of the major world economies including the EU, China, and increasingly the United States.
In the United States, the USD side of USDJPY, the FOMC will release its meeting minutes later in the day explaining to investors why the Fed made a 180 turn from hawkish monetary policy to dovishness which inspired traders during the day this policy position came out to retreat from equity markets. This was mainly due to the fact that investors believed the FOMC knew something they didn’t, specifically that the FOMC had data pointing to an increase in a US slowdown (a negative for USDJPY). We will find out the degree in which this is true later. While CPI figures that came out this morning were quite promising coming in at 2 percent, sentiment figures from the University of Michigan come out on Friday which are forecasted to be worse than last month’s figures.
Aside from a slowdown in global growth and the potential of a recession in the upcoming year, there are many more overarching thematic trends in the global economy that would suggest the Japanese yen may in the longer-term become stronger against the US dollar. This includes primarily the uncertainty surrounding Brexit and the desire of US President Donald Trump to continue his trade wars with the world. Both of these issues, if not managed properly by central figures, could spiral out of control and have a dramatic negative effect on global markets potentially spiraling into something more than what they intrinsically inherent.
Overall, there are many more reasons to be bearish than what there are to be bullish on USDJPY. This trend could reverse as the world could currently merely be in a trough of a global growth slowdown. However, these trends tend to not reverse as quickly as other trends such as forex price action. Because of this, my long-term view remains the same from months prior which is primarily that observers should be careful this late in the cycle. Foreign exchange markets will be some of the first to react to any realization of volatility while equities tend to be more knee-jerk reactionary. Since this is the case, it will remain key to keep an eye on safe haven assets such as USDJPY in order to maintain a finger on the pulse of global financial markets.

The Dollar Against the Yen Really Wants to Stay Above 111The US dollar has rallied significantly during the trading day on Thursday this week, reaching towards the ¥111.50 price level. Resistance range from this level goes all the way to the ¥112 meaning it will be very interesting to see whether or not the market can break out above that 50 pip range. If in fact it does, that could send this market significantly, at least to the ¥113.50 level. But its important to keep in mind as well that there are several trend lines of resistance I am tracking and only one of them, the one which only stems back to late 2018, has been broken. However, there is little follow through and a bit more action to the upside is required in order to determine that this resistance is no longer meaningful.
On the other side, if price action breaks down below the lows of the Wednesday bar, then traders are probably going to look towards the ¥110.75 level, and then possibly even further lower to the level of around ¥110. That said, it’s not until we get the jobs reports numbers that traders can put serious money to action due to the fact that quite bluntly the possibility for an increase in variance, beta, or volatility (pick your terminology) is extraordinarily high given the significantly low levels of volatility traders have suffered from over the past few months across asset classes. This pair tends to be very sensitive to jobs figures, so therefore we need to be very cautious and recognize that we need to give the market at least a couple of hours after that announcement. With that being the case, there isn’t much to do between now and then. However, we need to recognize how the market reacts to those figures once the machines get done trading and traders start to digest the announcement.
Quite bluntly, it is most likely the best tactic to be patient and wait until Monday morning to determine if the trade is ready to be executed and to see where price action rests from overnight trading. On the other hand, for those of you who want to trade a little more rapidly, traders could take the chance to wait until 12 PM on the Street in which quite often they will see what the market is going to end up doing anyway.

USDJPY Sideways Because it Likes Less Steep SupportWhile the Japanese yen had been trading on an upward short-term support line, last week it broke this line. Interestingly enough though, it found another level of support similar to the previous level of support, but just with a bit of a less steep slope. Clearly there is much evidence to suggest that the Japanese yen should be taking a nosedive. Compelling evidence for the contrary as well. But if we are just looking at short-term movement, its clear that for the moment USDJPY prefers a more sideways move as opposed to a strictly long or short move.

USDJPY Short Because Technicals Flash Overbought, Yen Safe HavenUSDJPY has a number of trends going against it to force price action downwards. Technicals and fundamentals are not on the dollar's side against the yen. Traders can see a number of oscillators and MAs suggesting USDJPY is overbought and due for a reversal. Moreover and probably more impactful are the fundamentals of the global economy which suggest major growth centers (Europe and China) are slowing down. US treasury yields suggest we are heading towards a recession and US GDP growth is probably going to be less than previous quarter for the second quarter in a row. Because of this, the yen will be heavily invested into which will partially be a result of institutional hedging, partially Japanese capital flows returning to Japan. While the dollar will also benefit from this, it will probably not benefit as much as the yen in the short term since the US economy is still strong and many in the US still want to be exposed to risk-on assets like equity markets.
In spite of this, sentiment indicators suggest the yen is set for a bullish move, but this can quickly reverse. You can find that data here www.dailyfx.com and you can find more analysis of currencies and indexes here www.anthonylaurence.wordpress.com

USDJPY Sidesways Because BoJ Ineffective, Traders Indecisive Trend trading would indicate via EMAs that we should see some lower levels. Moreover, short-term resistance and short-term support are form a symmetrical triangle and given the steep degree of the angles of the wedge, it seems as though some dramatic fundamentals would be required to force this pattern into either an upside or downside follow through of the wedge. For central bank fundies, the BoJ is clearly the most ineffective central bank in using monetary policy to impact its markets. Any move then by the central bank is probably going to be responded with a collective shrug. In the end, this pair is mostly driven by event risk of which recently is fairly weak. Equity markets (Nikkei 225 and Nifty) are getting crushed. My inclination is that this will trend lower since we are in an extended cycle and the yen is a safe haven asset. However, this may not be for some time since traders are relatively indecisive on whether or not the pair can continue its short-term uptrend or if the bears in other asset classes will take over causing a more longer-term extension lower.

USDJPY Breaks Short-Term Resistance, But Short Trade OvercrowdedWe've seen a huge risk-off shift in sentiment over the past few trading days stemming back from last Friday that saw many safe haven assets like the Japanese yen strengthen. There's many reasons why this is including ongoing concerns of a global growth slowdown, signals of recession such as the yield curve inversion, and thematic concerns lurking in the background such as the ongoing trade war between the United States and primarily the Chines but really with the rest of the world. Short-term support was broken with the yen on Friday and no rebound occurred yesterday or as of yet today in trading to get back above that line. Moreover, our bull/bear market indicator suggests the yen is now trending bearish while price action continues to fluctuate below the 200 day moving average.
However, there are signs that a short-term uptrend could occur. This evidence mainly lies in two oscillators and a bit in sentiment. First, CCI asserts that we are fairly close to oversold territory. However, this signal was stronger on Monday morning and has since receded. More convincingly, the sentiment indicator from Madrid suggests we are in an overcrowded sold environment. Contradicting this is data from IG via DailyFX also suggests that traders are net long and that the contrarian trade is already a bit overdone with signals that sentiment is mixed. Here's that data: www.dailyfx.com
Overall, this is difficult trading territory fundamentally and technially. While a good amount of evidence suggests we are a bit overdone in shorting dollar/yen technically, the fundamentals and the potential continued trend of global growth slowdown suggest that in the medium- to long-term that price action will flirt with much lower price levels than what investors are currently witnessing. For price targets, 105 remains a psychological barrier to overcome that the flash crash of January tested. Movement to this level is clearly not in the cards in the short- or medium-term as fluctuations between 108.50 and 111.90 are much more realistic.
For more analysis on the yen and other related issue, check out www.anthonylaurence.wordpress.com

USDJPY - Bearish Minute 3 - March Wave Counts - Part 7If you like my work, please support me with a like.
More details in my signature.
Many pips ahead!
