is AltSeason Started ????"The altcoin season has likely begun! We're currently witnessing Bitcoin's dominance chart breaking down at a critical juncture, and this cycle may surpass even our most optimistic expectations. The technical signals are remarkably clear and verifiable for most seasoned traders. In these market conditions, the wisest strategy is to hold strong with conviction – maintain your positions and trust in the assets you've carefully accumulated. This could very well be the start of an extended altcoin rally that rewards patience and strategic positioning. #AltSeason #CryptoMarket #BTCDominance #HODLStrategy"
Dominancebtc

Dominance breaking down signals Altseason is here !!There is no doubt in my mind that an Altseason is now in progress !
The May2025 low has been taken out.
Now things will start accelerating.
We could have a backtest of the resistance at 63.13 % (dotted fuxia line).
But we also could not !!
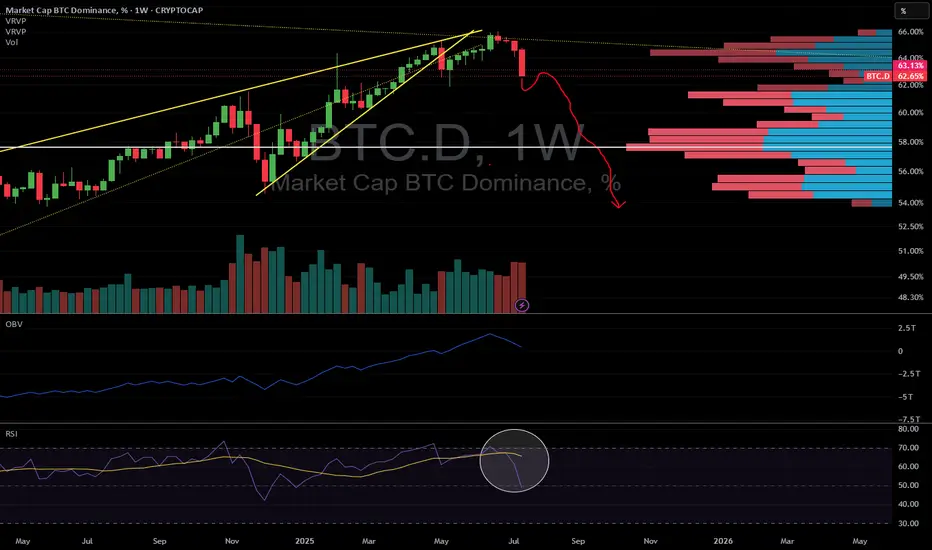
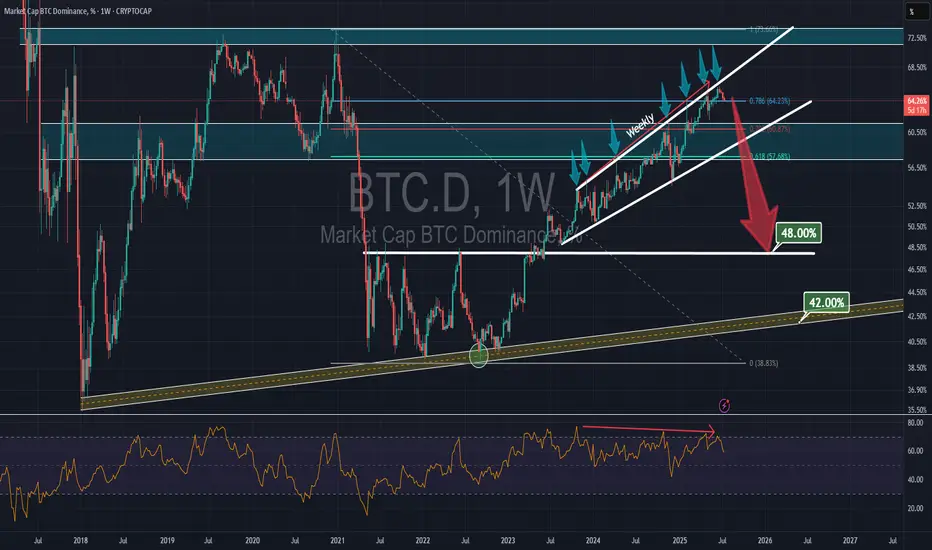
Bitcoin DOMINANCE dropssssBTC dominance has been within a rising channel since October 2023, showing a significant bearish divergence on the weekly RSI. After the seventh rejection from the channel's top, it may drop to the major support at 48%.
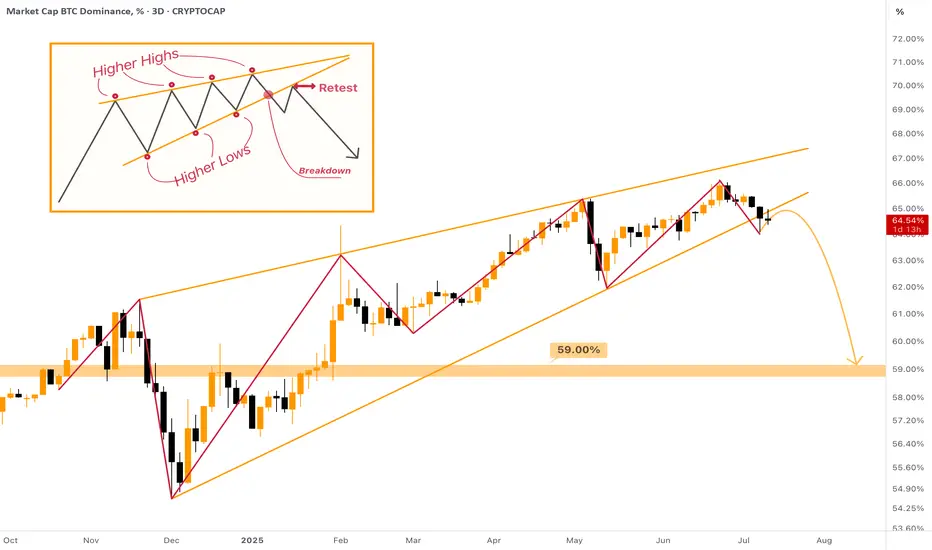
Rising Wedge on Bitcoin Dominance - [BROKEN DOWNWARDS] The MASSIVE Rising Wedge on Bitcoin Dominance was broken downwards during the past week, most likely the 1W candle will also close below the support of the wedge.
What does it mean? The dominance will dump from 64% to at least 59%. This move can already provide us with the huge Altcoin Season! After this there more likely be a small correction towards 60%, and then we can freely dump further towards 54% zone.
I expect not only small cap, but major altcoins to be sent to new highs as well. Mark my words & be prepared for the last opportunity of this bull cycle!
BTC Dominance (BTC.D) — Weekly Failed AuctionChart Context
• Instrument: CRYPTOCAP:BTC.D
• Time-frame: 1-Week
• *Key vLevels (dashed):
• 68 % – 2021 supply pivot
• 66-68 % zone – recorded a Weekly Failed Auction (wick above, close back below)
• 62.50 % – mid-range support / prior breakout shelf
Failed Auction at the Top
Price wicked into the 66-68 % vLevel but closed lower.
On a weekly chart that pattern often marks exhaustion; bulls couldn’t maintain control.
First Support = 62.50 %
If BTC.D trades < 62.50 % and closes a weekly bar there, odds rise that capital rotates out of BTC and into alt-coins.
Historically this breakdown triggers the early stages of alt-season (see 2021 analogue).
Invalidation
Weekly close > 68 % negates the failed auction and points to renewed BTC strength (alts lag).
How I’ll trade / allocate
Spot BTC bias – overweight BTC while dominance holds > 62 %.
Alt-coin rotation – shift 20-35 % into high-conviction alts only after a confirmed weekly close < 62 % and follow-through below 60 %.
Risk checks – trim alt exposure back to cash/BTC if dominance reclaims 62 % after a breakdown (failed alt-season).

BEARISH DOM + BULLISH CAP = ALT SEASONsimple TA analysis with simple arithmetic operation :
decline of bitcoin Dominance with the rise of market capitale = the season of altcoins and price explosions.
the year 2025 will be profitable, enjoy the summer
CRYPTOCAP:BTC.D CRYPTOCAP:TOTAL BINANCE:BTCUSDT INDEX:BTCUSD BITFINEX:BTCUSD COINBASE:BTCUSD

BTC.D (Dominance at Critical Fibonacci Confluence) 2025 Weekly
**Summary:**
Bitcoin Dominance (BTC.D) is testing a major Fibonacci confluence near the 66% level. This zone historically acts as a major pivot and may signal either a continued dominance rally or a potential reversal setting the stage for altseason. We use three layered Fibonacci retracements to outline dominant trend zones, key resistances, and projected targets.
**Chart Context:**
This chart uses **three distinct Fibonacci retracements** to map the historical and projected behavior of BTC dominance:
1. **Primary Fib** (100% to 0%): Captures the macro move from BTC.D \~100% down to its 0% level at \~0%, which aligns with the first altseason (2018–2019).
2. **Secondary Fib** (100% to 38.88%): Maps the first bearish wave to identify potential recovery levels. BTC.D retraced up to the 61.8% (\~73.68%) but failed to break further.
3. **Third or the Current Fib** (73.68% to 38.88%): Maps the latest bearish fall in BTC.D. As of now, BTC.D is hovering at the 78.6% retracement level of this move, indicating heavy resistance.
**Key Technical Observations:**
* **1st TP (Resistance):** 66% — Strong Fibonacci confluence zone:
* Fib2 48.6% ≈ Fib3 78.6%
* Major reversal zone historically
* **2nd TP (Support):** 52.25% — Multi-Fib confluence:
* Fib1 48.6%, Fib2 61.8%, Fib3 38.2%
* **3rd TP (Ultimate Support):** 38.88% — Historical BTC.D bottom, aligned with the first altseason.
* Intermediate Fibonacci confluences between 48%–60% serve as layered support during decline phases.
**Indicators:**
* No external indicators used; pure multi-frame Fibonacci confluence.
* Price action structure and historical patterns highlight potential market rotation zones.
**Fundamental Context:**
The current phase of the market reflects increasing speculative activity in altcoins while Bitcoin consolidates. Historically, high BTC.D correlates with Bitcoin-led rallies, while a sharp drop often triggers altseason.
* Growing inflows into ETH, SOL, and possible now XRP, and mid-cap alts suggest capital rotation.
* If BTC.D faces rejection from 66%, the market could enter a new altseason phase.
* Macro tailwinds (e.g., easing monetary policy, risk-on sentiment) support altcoin performance in the medium term.
**Philosophical or Narrative View:**
BTC.D acts as a barometer of market risk preference. As confidence expands beyond Bitcoin, money flows into altcoins—like tributaries branching off the main river. The rejection from major confluences signals this psychological shift, marking phases of creative decentralization.
**Related Reference Charts:**
* TOTAL3 Fibonacci Setup (Altcoin market excluding BTC & ETH):
* TOTAL2 Correction Probabilities:
**Bias & Strategy Implication:**
* **Primary Bias:** Bearish rejection from 66% followed by correction to 52% and potentially 38.88%.
* **Alternative Scenario:** Brief breach above 66% before reversal.
* Traders may consider rotating into altcoin exposure if BTC.D confirms reversal at the confluence zone.
**Time Horizon:**
* Mid to Long Term (1–6 months outlook)
* Weekly timeframe tracking
**Notes & Disclaimers:**
* This analysis is for educational purposes. Market conditions may evolve rapidly.
* Use proper risk management when acting on dominance signals.

Phoneix is coming backdoes not include financial advice.
the graph is back to its 2019 appearance
let's see if he can spread his wings this time

Dominance is currently engaged in a battle to move downward.Bitcoin dominance is currently in a strong downward battle, facing increasing pressure from altcoins which are gaining momentum. Despite some resistance trying to push dominance higher, the overall trend suggests a weakening grip of Bitcoin over the crypto market. This decline indicates growing investor interest in alternative cryptocurrencies, especially as sector-specific tokens and new projects start to outperform BTC. If this downward movement continues and breaks key support levels, we could see a more significant rotation into altcoins, fueling a broader rally across the market.

BTC.D is started to melting downThe MARKETSCOM:BITCOIN dominance bounced off a very critical level. It seems that the altseason is just started. The upcoming altseason will be face melting. Fill your bags with valuable alts ...

Bitcoin Dominance - the two scenarios!Bitcoin dominance continues to rise after breaking out of a rising wedge pattern on the weekly chart. It has now also broken through the 0.786 Fibonacci level.
Next stop is Rectangle 1, where Bitcoin dominance is expected to reach 68% — and most likely, this will mark the top of dominance before it starts to drop, triggering a historic altcoin season.
Scenario 2:
Dominance keeps pushing higher toward Rectangle 2, potentially surpassing 70%. At that point, many altcoins may form new lows, and weak projects could get wiped out.
Fear in the market will hit extreme levels —
but that could signal the beginning of an altseason and the collapse of BTC dominance.
Best regards Ceciliones 🎯

BTC DOMINANCEBitcoin dominance could break down at this point, potentially signaling the start of an exceptional altseason.

Bitcoin - The path to 170K
- Still enough NQ correlation to drag BTC
- No new highs unless QE (regime shift)
- Rangebound but stronger "decoupling rally" possible due to global liq etc. Fade unless real QE
- Front runs end of year (early Q4 stocks late Q4)
All of this could change, but one thing the charts keep telling me—
$170K Bitcoin this cycle is still very much a possibility.
Please check out my bear market Bitcoin-to-100K chart.
Thanks, feel free to leave a boost if you have found this helpful.

Dominance the system core- for me it has always been very complicate to explain BTC.D to peoples, because it's complicate ! lol
- it's weird to understand the moves and many factors have to be compared together an alchemy have to happen to see something happening.
- So basically to explain it, i will tell you what "we want to see" or "what we don't want to see" in the future. if the story repeats again.
1/ BTC.D have to grow up, then Altcoins will struggle down trying to find a potential bottom.
- While BTC.D grow up, BTC price have to grow up also or at least stabilize ( this is a good sign )
2 / if BTC price down and BTC.D up, it's bad, it's just the normal way ( No Divergence )
- When BTC price + BTC.D both up together, it's a kind of " inversed divergence ", it means something good gonna happens. ( get it ?)
- Basically also if USDT/USDC Dom Grow and BTC price stabilize and not goes down anymore, it's a good sign.
- Normality the normal way is : BTC up / USDT/USDC.D Down OR BTC Down / USDT/USDC.D up.
- Before we had no reason to check those Stables coins because they had not much DOM in markets, but now have to count with them.
- So While BTC.D is growing, altcoins will just make some weak moves.
- When BTC will reach is next Dominance's ATH ( witch have to be lower than last years because more concurrence )
- BTC.D will crash and ALT SEASON will start.
- it took me many years to understand that, but it's pure logic ( Fibonacci is working perfectly on it )
- again it's not easy to get it.
- if you have any questions feel free to add a comment.
Happy Tr4Ding !

BTC.D BITCOIN DOMINANCE near trendlineBTC.D is near the trendline.
Will we see a bounce right of the trendline? If so we could get the altseason we all are waiting for. However due too the massive growth in the number of altcoins and the many rugpulls in the meme sector and even liquidations as in CRYPTOCAP:OM for example, we could be in for a complete other scenario.
BTC could also keep the higher levels of dominance due to new ETF inflows and reserves by country's and the negative new in the alts. FUD could build up on the alts. So will we see an alt season in that case.... Even CRYPTOCAP:ETH is dropping so low.....
If we will see an altseason it will be different. Other bullruns there were just a few hundred altcoins so it was easy to pump them all. New we have milions of coins and the money supply is limmited. The inflows in BTC are stuck there in ETF's and reserves... So that looks nice but it won't flow back into alts in my opinion.
So what can we expect from the so called altseason.... Well i believe we will see rotation from narrative to narrative. The mass (retail) will first jump on the train with trading the pairs they know. In taht case we will see the first pumps in the bigger MEME's and DINO coins (coins that have survived several bullrun cycles like XRP, LTC, ADA, ETH, BNB, LINK).
Why DINO coins will pump? Because retail knows these coins and all the new coins are just too many to deal with. They just won't understand. Off course we will see projects like SOL, SUI, HBAR, ATH and several others pump with the coins but not every coin has the same visibility.
After these two narratives the rest could follow. A few a quite certain. Like AI, RWA, DeFi and a few others. But also in these narratives it will be cherry picking the good and proven projects.
So choose your darlings with care and don't mary your coins! All alts will drop 90% in the bearmarket!

[UPDATE BTC.D] RANGE ?? 69-46-88??We either going to front run (red scenario) or go for a last crash end of Q2 then up only until the end of the year/beginning of Q1 2026. Then down until the end of the decade.

BTC dominance hinting at one last push?Hello everyone
We all are looking for a way how the BTC dominance can go down to 40% area. If we somehow can predict it correctly then we can make some money in the process.
Here is a (maybe not so) wild idea for medium term.
We are on a weekly chart.
Let's check some facts first:
- Stoch RSI is currently high (near 100).
- RSI is at 68
- Chart is making a new higher high - keep in mind previous dominance high (Feb 3rd) was a result of a flash crash of the market so I am referring to previous high as Nov 18th
So we are witnessing a bearish divergence (RSI making lower highs while chart is making higher highs). Hence drop in BTC dominance should just be a matter of time.
What if the universe aligns and following happens:
We are in economically unstable times. Markets are volatile, politicians are unpredictable so further drop in Crypto space is not impossible. BTC drops less then ALTs, BTC dominance reaches top somewhere between now and 67-68% area. In the meantime traditional markets also crash some more. After that the economic situation stabilises, we get Quantitative Easing and this drives price of ETH up, followed by other ALTs.
For reference: ETHBTC has reached strong support between 0.002300 and 0.001700 Satoshi, RSI is at 24 (same level as Sept 2019 when ETHBTC was at a longterm low).
This scenario would ignite Altseason, bringing BTC dominance down for a reset and start of a new cycle.
There are other bearish scenarios as well, keep that in mind. So trade safe and smart.
I am not predicting any of this, I am not even mentioning any possibilities for this to happen. I am just giving you some food for thought.
Good luck!

BTC.DThe Bitcoin dominance is currently at this level, and we might see higher targets. I don't anticipate a decline in Bitcoin's value. Please share your thoughts in the comments.

BTC-DOM- BTC dominance can't keep rising indefinitely.
-If we see a BTC dip, BTC dominance could climb to around 66% (71.8% Fibonacci), but in my opinion, that’s likely the maximum.
- If BTC surges too quickly and too high, altcoins will be suppressed, causing BTC dominance to potentially rise also to around 66%. However, once again, I believe that's would be the max.
- After any of both cases, altcoins will start to moon fly.
- 36-bar, 1096-day uptrend on the BTC dominance chart. That’s a significant duration from 2018 to 2021. The timespan from 2022 to 2025 could mirror the previous one.
- Take note also on the Bearish Divergence between the trend and the RSI. ( i will post weekly graphic also to show a more clear view ).
- An uptrend of this length indicates strong, sustained interest in BTC compared to altcoins. However, long-term trends like this are prone to exhaustion.
For now, just hold your alts and practice golden patience.
Happy Tr4Ding !

Bitcoin Dominance (BTC.D) Technical Analysis – March 12, 2025
Trend Overview:
- BTC dominance is currently at 62.18%, approaching a critical resistance level.
- BTC dominance has been in an uptrend since early 2024, indicating that Bitcoin has outperformed altcoins during this period.
Key Levels to Watch:👁👁
- Resistance: ~62.5% (horizontal resistance level)
- Support: ~60% (previous breakout zone)
-Major Breakdown Target: ~54.5% (potential altseason trigger)
Technical Indicators & Patterns:⚖️
1. A breakdown below 60% would confirm a bearish trend for BTC dominance and lead to an altcoin pump.
2. In late 2024, BTC dominance rejected at a similar level (~61%), followed by a sharp decline. The same pattern may repeat, leading to altcoins outperforming BTC.
3. If BTC dominance breaks above 62.5%, it could extend towards 64-65%, delaying an altseason.

If This Happens For BTC Dominance, Shakeout Is CancelledHello, Skyrexians!
As you remember we have the previous analysis on CRYPTOCAP:BTC.D where we pointed out the target at 66% and the shakeout. But we were sure that it will happen in the upcoming week, but Dominance retraced again below 61% and current wave doesn't look like the wave 5. This move increased probability of more positive scenario for altcoins.
Let's take a look at 12h time frame. We can see that candles were able only to touch the 62.5% and then retested the recent low. It gives us an idea that the probability that this is wave 5 decreased. Here we have two scenarios. The first one is that we are in wave 4, which is more complicated that we supposed and candles will finally reach 66%.
But the second scenario now has even more than 50% probability. This pump could be already shortened wave 5. Unfortunately, Bullish/Bearish Reversal Bar Indicator can't catch such waves, but Awesome Oscillator tells us that wave 4 has been finished and we can see the divergence, which could already happened if dominance touch 66%. Now AO is reversing and this is the sign that this impulse to the upside will not continue. The clear breakdown of 60% will confirm this idea.
Best regards,
Skyrexio Team
___________________________________________________________
Please, boost this article and subscribe our page if you like analysis!

BTC.D Swept Previous High'sAs you can see on the chart, we have already swept recent Daily close and got rejected, now we will kinda test lower stuff, if we get weak reaction then we gonna break below this
CRYPTOCAP:BTC.D

USDT Dominance Weekly Chart Analysis !!The chart shows USDTDominance in the Ukrainian market for several years, indicating distinct trends and patterns.
Trend Line Support:
A visible upward significant line has been established since 2021. This suggests a fundamental base level from which USDT dominance has historically bounced back.
Heads & Shoulders Pattern:
The chart item includes the Heads & Shoulders number, indicating a bearish reversal pattern. This means the upward momentum may slow down, and a downward shift may occur.
Current Dominance Level:
The current level of around 4.53% is significant. A break below this level and a decline may occur, possibly targeting the projected supported area around 2.00% in the long term.
Take a look at the support and resistance separation on the chart. The interaction between Trend Travelers and Heads & Shoulders Trend Travelers will be important in predicting the future of USDT dominance. Anticipating a downward movement may be prudent,
If you found this analysis helpful, hit the Like button and share your thoughts or questions in the comments below. Your feedback matters!
Thanks for your support!
DYOR. NFA
