#BTC.D (BTC-DOMINANCE) - Cheat sheet#BTC-DOMINANCE
The asset has many strong features to achieve its goal.
This text does not contain recommendations on financial transactions or investments.
Dominancetrends

TMGH Trend Analysis TMG Holding trend is still in its neutral zone, reflecting bearish dominance over the bullish. In case of rising, it's expected to reach the resistance line 53.198, the second resistance line 53.228, then the third at 53.47 points. In case of falling, it is expected to reach the support line 52.956, the second support line 52.775, then third support line 52.684, but fundamentally it's a far expectation because of TMGH Q1 net profit after tax is EGP 4.42 Billion versus EGP 4.14 Billion year ago. Secondly, revenue was EGP 9.43 billion versus EGP 6.79 billion a year ago. Thirdly, outstanding real estate sales of EGP 77.2 billion. Fourth, the group's backlog amounted to EGP 350 billion.

BTC.D is started to melting downThe MARKETSCOM:BITCOIN dominance bounced off a very critical level. It seems that the altseason is just started. The upcoming altseason will be face melting. Fill your bags with valuable alts ...

BTC DOMINANCEBitcoin dominance could break down at this point, potentially signaling the start of an exceptional altseason.

Plan DOGE - spring sessionRight now, is probably a good moment to open short positions.
The price reached the level I was pointing to, just perfectly!
It's incredible how accurately rules, norms and relationships are working. I am amazed every time when see in action the power of the principle.
Hope you were in time to open short positions. My base scenario - I am anticipating Dogecoin at 0.118 - 0.085 USD now and well bounce after this. Be careful, we will have the reverse confirmations upon usdt.d consolidates above 5.20%.
Consolidation below 5% will indicate a massive uptrend continuation.
PS: one more important observation is - I had my doubts whether price could go out of trend, within 2 & 4 waves. Within this formation we see a strong test, but not a break (as of now). This shows that a simple forecasting tools are one of the most reliable.

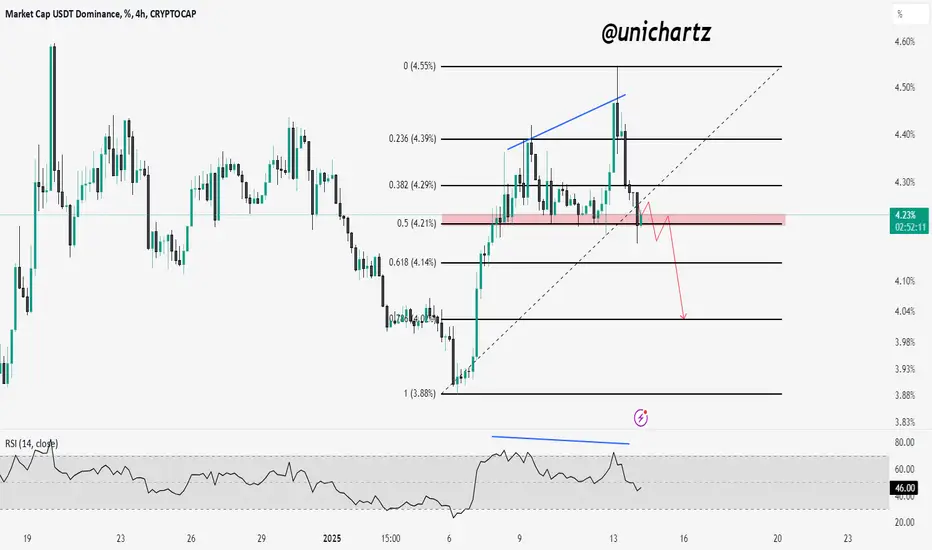
Market Shift Incoming! USDT Dominance Nears Critical Turning PoiThe USDT Dominance (USDT.D) chart is currently testing a strong resistance zone, where price action is showing signs of exhaustion. A bearish RSI divergence has formed, indicating potential weakness and a possible correction. The rising support line has provided multiple bounces, but a breakdown from this structure could trigger a larger downside move.
If USDT dominance falls, liquidity will likely shift into altcoins, potentially fueling a bullish rally in the altcoin market. Conversely, if USDT dominance continues to rise, it could signal increased market fear, leading to further weakness in altcoins.

USDT Dominance Weekly Chart Analysis !!The chart shows USDTDominance in the Ukrainian market for several years, indicating distinct trends and patterns.
Trend Line Support:
A visible upward significant line has been established since 2021. This suggests a fundamental base level from which USDT dominance has historically bounced back.
Heads & Shoulders Pattern:
The chart item includes the Heads & Shoulders number, indicating a bearish reversal pattern. This means the upward momentum may slow down, and a downward shift may occur.
Current Dominance Level:
The current level of around 4.53% is significant. A break below this level and a decline may occur, possibly targeting the projected supported area around 2.00% in the long term.
Take a look at the support and resistance separation on the chart. The interaction between Trend Travelers and Heads & Shoulders Trend Travelers will be important in predicting the future of USDT dominance. Anticipating a downward movement may be prudent,
If you found this analysis helpful, hit the Like button and share your thoughts or questions in the comments below. Your feedback matters!
Thanks for your support!
DYOR. NFA

Timing the End of the Altcoin Bull MarketHello,
BTC dominance is currently around 55%. From my analysis, the altcoin bull market typically ends when BTC dominance drops to the 47%-40% range. At that point, it’s wise to prepare for selling altcoins, while also monitoring the total market cap for signs of a decline. For now, the bull market remains active.
As always, remember to stick to risk management.
BR,

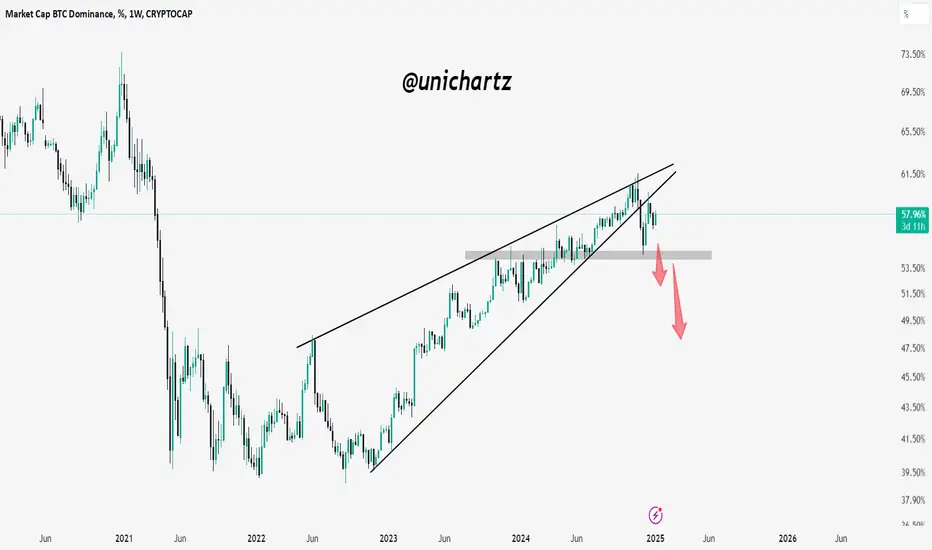
DOMINANCE - the manipulation!The weekly chart clearly shows a confirmed breakdown of the rising wedge pattern.
Everyone was waiting for a retest to buy in, expecting dominance to drop and altcoins to rally—but that never happened.
Why?
Because when everyone expects a move, the market does the opposite.
What actually happened?
-The market shocked everyone with a parabolic dominance surge to 64%.
-Over $182 billion was drained from the market in just two days.
-Altcoins suffered a brutal crash, with some dropping over 50%.
-Most assets hit extreme lows, forcing mass panic selling at heavy losses—which we predicted a week in advance.
-A sharp altcoin rebound happened the same day, while dominance dropped from 64% to 61%, stabilizing at this level.
What’s next?
The rising wedge pattern is still in play, but its targets won’t be hit without manipulation.
I expect heavy market manipulation in the coming days, with dominance fluctuating between 60% and 63%, designed to drain traders’ portfolios—especially futures traders.
The expected price action is outlined in this chart. Take a look, and you'll clearly see how manipulation operates in this market.
Best regards Ceciliones🎯

DOMINANCE - retesting almost done!The market is experiencing a terrifyingly bearish phase, and the start of the week is concerning. However, everything will be fine soon.
We can see this through the dominance chart.
On the weekly timeframe, the pattern has broken downward, and a retest is now in progress.
This current pressure on altcoins aligns with the dominance chart retesting its breakdown.
It’s expected that dominance could rise to a maximum of 61% before altcoins break free from this nightmare and finally deliver the long-awaited profits.
Personally, I’m still holding onto my altcoins and strongly advise against selling. Everything will improve in the coming weeks.
Altcoins are currently at bargain lows that are worth buying.
Best regards Ceciliones🎯

USDT.D at Key Support: Will Altseason Ignite?USDT.D Weekly Analysis:
Key Zone: USDT.D is trading at a critical support zone, with a successful retest of the broken trendline confirming bearish momentum.
Bearish Potential: A breakdown could lead to a 48% drop in dominance, paving the way for an altseason as funds rotate out of stablecoins.
Bullish Risk: If the support holds, bearish momentum could stall, delaying the altcoin rally.

USDT.D at Key Support: Altcoin Bull Rally Ahead?USDT.D has repeatedly bounced off the marked red support zone, a strong Fibonacci level at 0.5. This support has been tested multiple times, and based on my experience, I anticipate USDT.D may break below this zone. If it does, it could trigger a bullish rally in altcoins.
I believe this is the final shakeout phase, so stay strong and focus on accumulating fundamentally solid coins. Remember to maintain discipline and practice strong money management.
USDT Dominance Rises: A Warning for Long Positions on AltsStay cautious with your long positions as USDT Dominance (USDT.D) is gaining strength, which is a bearish signal for altcoins

BTC Dominance Breakdown: Altcoins Poised for a Rally?BTC dominance has broken below a rising wedge and is retesting the 57.80% resistance.
If rejected, dominance could drop to 53.50% or 50.00%, signaling potential capital flow into altcoins.
USDT Dominance Approaching Key Resistance – A Breakout or RejectA breakout above 4.40% could suggest a bearish shift for altcoins as funds move into stablecoins.
However, rejection at this level may lead to another test of the 4.00% support, which could boost altcoin performance.
Traders should watch for volume confirmation and RSI behavior for clearer direction.
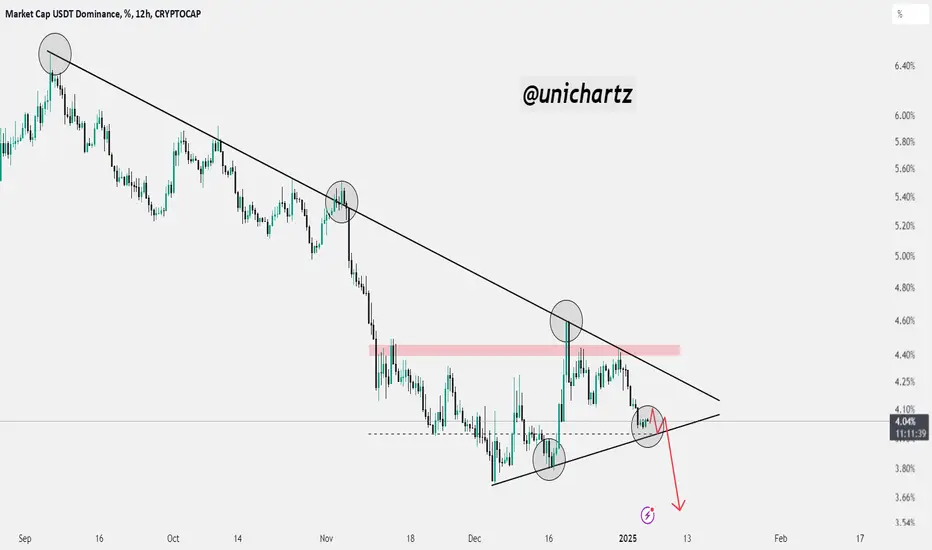
USDT.DOMINANCE CHART UPDATE ;-USDT.DOMINANCE CHART UPDATE!
Descending Channel: Dominance is trading within a well-defined descending channel, indicating a controlled downtrend.
Resistance Zone: It is currently approaching the upper boundary of the channel and a horizontal resistance zone near 4.30%-4.32%. This confluence zone could act as a rejection point.
Potential Downside: Failure to break this resistance zone could lead to a downward move toward the lower boundary of the channel, around 3.80%-3.90%.
Bearish Bias: Dominance remains under bearish pressure as long as it remains within the descending channel.
If there is a breakout above 4.32%, it could temporarily turn the sentiment bullish, indicating a reversal or a temporary halt to upward momentum.
Let me know if you’d like further assistance or adjustments!
DYOR. NFA

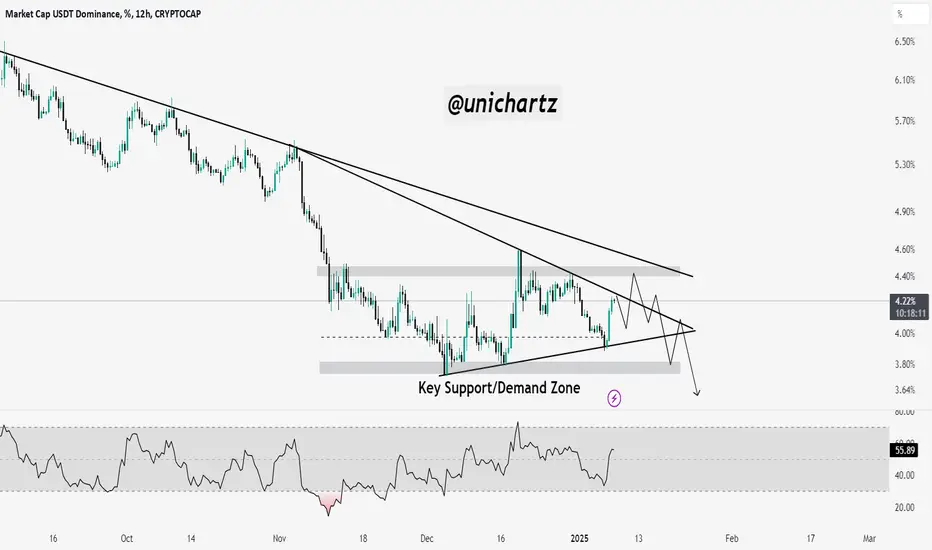
USDT Dominance at Make-or-Break Zone – Watch for Altcoin Moves!The chart shows a clear descending triangle pattern in the USDT dominance (USDT.D), with the dominance steadily declining and forming lower highs along a downward trendline.
This indicates weakening demand for stablecoins, which often correlates with increased risk appetite in the market as investors shift their funds from stablecoins to altcoins.
Bitcoin Dominance vs. AltcoinsBitcoin dominance is an extremely important parameter for traders and investors.
It marks the beginning or end of altcoins season!
CRYPTOCAP:BTC.D
Bitcoin dominance is an important metric for understanding the overall health of the cryptocurrency market. As the most dominant cryptocurrency, it's an indication of the strength and popularity of the asset, and can be used as an indicator of the overall market sentiment. Therefore, investors need to monitor Bitcoin dominance to gain insights into the current state of the market.

Will USDT.D Rejection Spark an Altcoin Rally?USDT dominance is nearing a key resistance trendline while holding above critical support.
A rejection here could signal increased capital into altcoins, boosting their prices. However, a breakout above the trendline may pressure altcoins further.
Watch closely for the next move!
DYOR, NFA

USDT.D Testing Critical Resistance: Breakout or Pullback?USDT.D has recently broken out of a falling wedge pattern, indicating a potential shift in momentum. The price is currently testing a critical resistance zone near 4.30%. A breakout above this level could signal further dominance for USDT, suggesting risk aversion in the crypto market.
If the resistance holds, a pullback toward the 4.20% support zone is likely. However, a confirmed breakout could lead to a continuation of the upward trend, potentially targeting the 4.40% level.
DYOR, NFA

BITCOIN DOMINANCE - Clear chart , Clear dataYour trading struggles are summarized in this chart
weekly chart displays breakout a massive rising wedge pattern and now retesting...
Everything is fine as long as you’ve bought your coins at good prices.
All this struggle is simply summarized in this retest.
What’s expected is strong price fluctuation until mid-January, after which things should settle down.
If you’re out of the market and looking to enter, try to do so during the next correction

USDT.DOMINANCE UPDATE !The chart shows that USDT dominance is moving within a well-defined descending channel.
The price has recently moved closer to the upper boundary of the channel, marked by the orange resistance area around 4.60%.
4.60% (orange area): This resistance has rejected price action several times before, which suggests strong selling pressure.
Any failure to break above this level could result in another downward move.
4.00%–3.80% (green area): This is the crucial support area within the channel. A break below this could push dominance further down, potentially towards 3.60% or lower.
The surge in volume during previous rejections at the upper boundary suggests strong bearish momentum.
Disclaimer: This analysis is for informational purposes only and does not constitute financial advice. Always conduct your research and consult a financial advisor before making investment decisions.
For updates on other coins or personalized insights, feel free to reach out via DM.
@Peter_CSAdmin

USDT Dominance Chart Analysis !4.50%–4.60% (orange zone): This level represents a crucial resistance zone, where previous upward moves have stalled. A breakout above this level will signal bullish momentum in USDT dominance, increasing risk-off sentiment in the market.
Primary Support: 4.10%–4.20%
This zone acts as a near-term support level. A breakdown below this could lead to a further decline in USDT dominance.
Secondary Support: 3.80%–3.90%
This is a crucial demand zone, where buyers have historically come forward. If the price reaches this zone, it could signal a reversal.
The 21-period MA (thin line) and 200-period MA (thick green line) are important indicators to watch. USDT dominance is trading near the 21 MA, while the 200 MA is below, indicating potential support.
Symmetrical Triangle Formation:
USDT dominance is consolidating within a triangle pattern. A break on either side (up or down) will determine the next significant move.
Upside Breakout: This could lead to a retest of the 4.50%-4.60% area.
Downside Breakout: This could lead to a decline towards the 4.10%-4.20% support, with a possible continuation towards the 3.80% area.
DYOR, NFA
@Peter_CSAdmin
