Dominancetrends
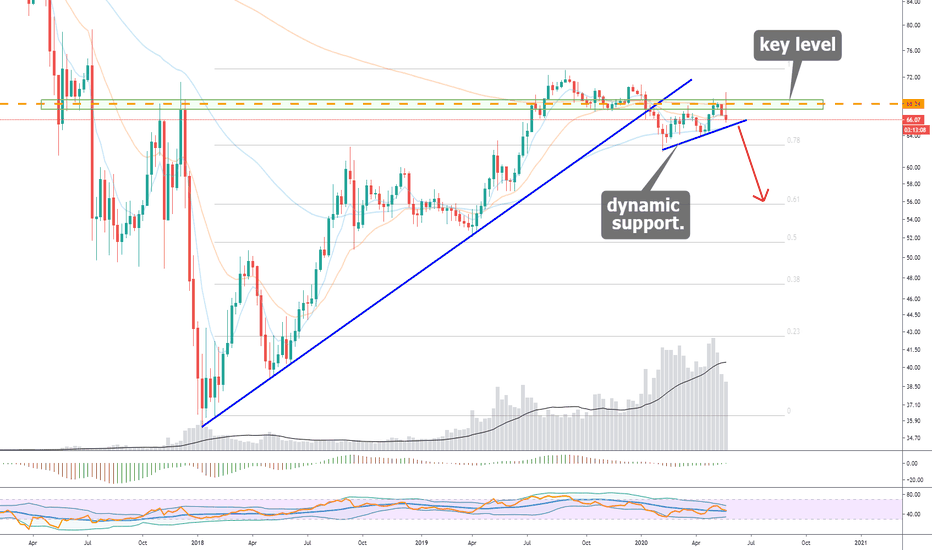
BTC.D - Alt SeasonBitcoin's dominance is dropping.
We've now stopped at an average moving 66%.
On 1d timeframe shows a downtrend.
Alt season is already happening.
I laid out a lot of posts with altcoin.
if we go back to 70, I would be surprised)
Push ❤️ if you think this is a useful idea!
Before to trade my ideas make your own analysis.
Thanks for your support!
#DOMINANCE IS AT CRITICAL ZONE. Don't miss this!Hello guys. This is the most important Dominance chart that you need to. understand if you're invested in alts.
Halving is just after few days and people are holding
BTC max in their portfolio.
Coming to this Chart
Dominance is at the most critical Zone now,
Break above this TRENDLINE would lead to 10 to 20% more dump in BTC and will eventually get rejected from the upper trendline Resistance. Dropping from that resistance which is around 68.10 we could see a mini Alts season i.e., a 100 to 300% Rise in Potential Alts which are trading currently at the bottom with strong fundamentals in the end of second quarter.
Yes It's true read it again!
Now if it follows S1 (Scenario 1) in which it fails to break above the current critical Red Dot resistance point where two line of Resistances coincide with each other we can see it dropping to the downside to 62 level.
Caution for Alts: If dominance follows S2 and breaks through the resistance of the giant falling wedge channel. There will be massacre in the Alt MARKET.
If you ask me my personal call would be a drop from here but still need to be vigilant.
So we wait for few days to see how the resistance breaks to the upside or downside.
I would personally hold maximum portion of my portfolio in BTC.
#Thanks again for reading.
If you like my ideas and the hard work I put into the charts please hit the LIKE BUTTON and Follow me for the latest Updates.
Stay safe
I wish good health to your families
#Peace
Bitcoin Dominance Chart Altcoin Pumping Time or More REKT ALT..?BITCOIN Dominance Chart:
Now Bitcoin Dominance is 68%.
Last post on Trading view I told you when BTC dominance crossed 67% then you can exit from altcoins.
Who followed me now saved huge Fund.
who not followed now holding Altcoins in loss.
so
What Next: Now BTC Dominance Struggle at Resistance level of 68%-69%.
so if this Resistance breakout upward then Altcoins blood bath coming soon.
so guy Very important level is 69% ( Tradingview Dominance ).
if This Resistance Rejected then 65% is very Strong support for hold at this level.
but keep an eye if 65% dominance also breakdown then Altcoins will pump very hard.
soon keep an eye on two level:
69% Resistance and 65% Support level.
What can we do now..?
Now I will accumulate Good potential coins.
And waiting for more dip.
I will buy more every dip.
but but guys
If BTC Dominance level is Breakout upward 69% Resistance Level then I will Exit from all Altcoins.
and wait for next Confirmations.
because 69% breakout then Altcoins Bloodbath coming soon.
So dont trade Blindly and Like Gambling.
Trade after good Confirmations.
Resistance Level: Now BTC Dominance at 68% so this is very Good Resistance Level of 85 Day Moving Average.
and if breakout this Then Very long term Resistance trend line Resistance is 69%.
so both is very important level.
now I take risk and buying altcoins.
if breakout upward I can expect minor loss but if breakdown then I will book huge profit.
Support: Now 65% is very good support in 3 day or as well as 1 Day chart.
But if this breakdown then you can enjoy with your altcoins holding.
so next Support is 55%.
Support: 65% / 60% / 55%
Resistance: 68% / 69%
Guys Please Click The #LIKE button and Appreciate me for my Hard work.
Hearty Thank you so much for your Love like a Family.
So guys Dont Forget to Click Like Button.
ADAZ19 Structures & Trendlines & TargetsCardano traded into a structure. I drew the trendlines from wick to wicks, and took a trend fib extention measurement from the low to the high and back down to the low. We entered the trade once the 4hr 20ma was breached and held on a test of support. I set my target aiming for the 0.618 extention, which is above the trendline. Once the trendline is breached, I will trade the break aiming for the 1:1 trend extention, of course depending on what dominance is doing. I placed my stop below the trendline, which was also
Another reason I took this trade is because of declining dominance. Must keep an eye on dominance and this falling wedge structure it has been forming. If it breaks bullish out of this falling wedge, alts will take a hit. If it breaks bearish out of this wedge, well then it's go time on alts.
I'm changing the format of my channels back to a major focus on education - mostly risk management, and trade setups. Here on tradingview I will not be posting signals, only educational material based on past trades as I have done with this trade. I Had lost a little clarity and was focusing too much on trades and setups, and not explaining much. However, I came back from an amazing vacation focused and clear-minded. Now I'm going to give it all away for the benefit of those interested in learning how to trade, and how to manage their risk properly.
Original Signal:
#ADA/Z19
Exchanges: Bitmex
Signal Type: Regular (Long)
Leverage: 5
Entry Zone: 482-485
Take-Profit Targets: 490-500-510-520-530
Stop Targets: 470
Risk: 14.45%
Reward: 57.85%
Rate: 483
BitMEX
#ADA/Z19 Take-Profit target 1 & 2
Profit: 16.7%


