Breaking: Domino's Pizza Reports Weaker-Than-Expected Q1 RevenueShares of Domino's Pizza (NASDAQ: NASDAQ:DPZ ) moved lower in premarket trading Monday after the pizza delivery giant reported weaker-than-expected first-quarter revenue and U.S. same-store sales.
The Ann Arbor, Mich.-based company posted earnings per share (EPS) of $4.33 on revenue that increased 2.5% year-over-year to $1.11 billion. Analysts polled by Visible Alpha expected $4.04 and $1.13 billion, respectively.
Same-store sales among Domino's U.S. locations fell by 0.5% year-over-year, worse than the 0.22% bump analysts had forecast. International same store sales excluding foreign currency impacts were up 3.7%, topping the 1.88% growth analysts were expecting.
CEO Russell Weiner said the company continues to operate in a "challenging global macroeconomic environment," but said Domino's is continuing to gain market share in the U.S. and internationally.
Earlier this month, Domino's announced a new partnership with DoorDash (DASH), with the pizza chain's food set to be available through the latter's app beginning in May, once its exclusive agreement with Uber (UBER) Eats expires. Domino's has said it believes the third-party delivery market could eventually generate $1 billion in sales.
Domino's shares, which entered Monday up 16% in 2025, were down 2% shortly after the report was released.
Technical Outlook
As of the time of writing, NASDAQ:DPZ shares are down 1.66% in Monday's premarket session, albeit the earnings missed. With the RSI at 64, NASDAQ:DPZ is strong enough to hold the current resistant point. However, should selling pressure increased, shares of NASDAQ:DPZ could retraced touching the $399 support zone.
Similarly, the $500 resistant point is still in play, should the bulls take over.
Dominos

Papa Johns Pizza | PZZA | Long at $37.00Warren Buffett goes for Dominos ( NASDAQ:DPZ ), but I'm here for Pappa Johns $NASDAQ:PZZA.
Pros:
Earnings are forecast to grow 10.92% per year
Revenue grew from $1.8 billion in 2020 to $2.1 billion through Q3 of 2024 - expected to continue to rise through 2027
Free cash flow expected to improve
5.1% dividend
A lot of options awarded to insiders in 2024 and limited selling
Technological advancements in AI/ordering/processing may reduce long-term costs
Technical analysis shows stock may be coming out of a downtrend in low $30's (but exercise caution - very early)
Cons:
Debt is not well covered by operating cash flow
Dividend is not well covered by free cash flows
May have some near-term struggles due to weakening economy
Technical analysis shows possible drop to the $20's if bad earnings/outlook are revealed (another personal buying opportunity)
While there may be some near-term economic headwinds, I like the stock and the future of companies like NASDAQ:DPZ and NASDAQ:PZZA as AI is integrated to reduce costs. Thus, at $37.00, NASDAQ:PZZA is in a personal buy zone.
Targets
$45.00
$50.00
$60.00
$100.00+ (very long-term outlook to close the existing price gaps on the daily chart)

Domino’s Pizza Q3 Earnings Report: Revenue Misses, Earnings BeatDomino's Pizza Inc. (NYSE: NYSE:DPZ ), the largest pizza chain globally, has released its Q3 2024 financial results, revealing a mixed performance that left investors somewhat disappointed. Despite beating analyst expectations on earnings, Domino’s missed revenue estimates, causing the stock to slip. The company remains focused on its "Hungry for MORE" strategy, but the latest report underscores the challenges Domino's is facing in a pressured global marketplace.
Fundamental Overview
In Q3, Domino’s reported adjusted earnings per share (EPS) of $4.19, exceeding analyst projections of $3.63 by a significant margin. This 15.2% earnings beat reflects the strength of Domino's operations, particularly its cost management and international growth. However, revenue came in at $1.08 billion, falling short of Wall Street’s $1.1 billion estimate. This revenue miss highlights the broader industry challenges, particularly a competitive market and shifts in consumer spending.
Key Financial Metrics:
- Revenue: $1.08 billion (5.1% YoY growth, but 1.6% below expectations)
- EPS: $4.19, beating the $3.63 consensus
- Global Retail Sales Growth: 5.1% YoY, excluding currency impacts
- Same-Store Sales: U.S. up 3.0%, International up 0.8%
- Operating Income Growth: 5.7%, excluding FX impacts
- Net Store Growth: 72 new locations globally in Q3
While the growth in same-store sales and net store expansion demonstrates Domino’s resilience, the revenue shortfall suggests there may be limitations to growth in a highly competitive fast-food market. Additionally, rising operating costs and fluctuations in foreign exchange rates have impacted Domino’s international operations.
2024 Guidance and Future Outlook
Domino’s maintained its full-year 2024 guidance, projecting approximately 6% global retail sales growth and 8% growth in operating income. These targets align with the company’s consistent expansion strategy, which includes adding 800 to 850 new stores globally by year’s end. For 2025, the company expects sales and income growth to be broadly in line with 2024 projections, signaling confidence in its long-term strategy.
However, the revenue miss, combined with the challenges of maintaining growth in mature markets like the U.S., has caused some investors to reassess Domino’s trajectory. Domino’s already boasts 21,002 locations globally, making incremental growth more challenging.
Technical Outlook
From a technical perspective, Domino’s stock has entered a bearish zone following the release of its Q3 earnings. As of the time of writing, NYSE:DPZ has dropped 2.52%, with the Relative Strength Index (RSI) sitting at 35, approaching the oversold region. This signals that the stock could be nearing a critical support level but is not yet undervalued enough for a bullish reversal.
Key technical indicators point to further weakness:
All major moving averages depict a bearish tone, with the stock trading below its 50-day and 200-day moving averages. This suggests downward momentum in the short to medium term.
The daily price chart shows a gap-down pattern that has yet to be filled, creating a technical overhang that could pressure the stock further.
NYSE:DPZ is also trading within a falling wedge channel, a pattern often associated with continued downward momentum until a breakout occurs. A dip towards the $355 pivot could lead to a significant selloff, potentially triggering a broader decline if support levels fail to hold.
If Domino's stock fails to find support at current levels, it could face further downside, especially given the broader headwinds in the fast-food sector, including inflationary pressures and changing consumer preferences.
Conclusion
While Domino's continues to execute its growth strategy effectively, as evidenced by strong EPS growth and net store expansion, the revenue miss in Q3 signals challenges ahead. The stock's current technical outlook suggests caution is warranted, particularly as NYSE:DPZ nears critical support levels. Investors should watch for a potential bounce if the stock hits oversold territory, but the risk of further downside looms if the broader market sentiment remains negative.
In the long term, Domino’s focus on expansion and operational improvements may help it navigate current headwinds, but short-term technical signals and the revenue shortfall indicate that the stock could face more turbulence before recovering.

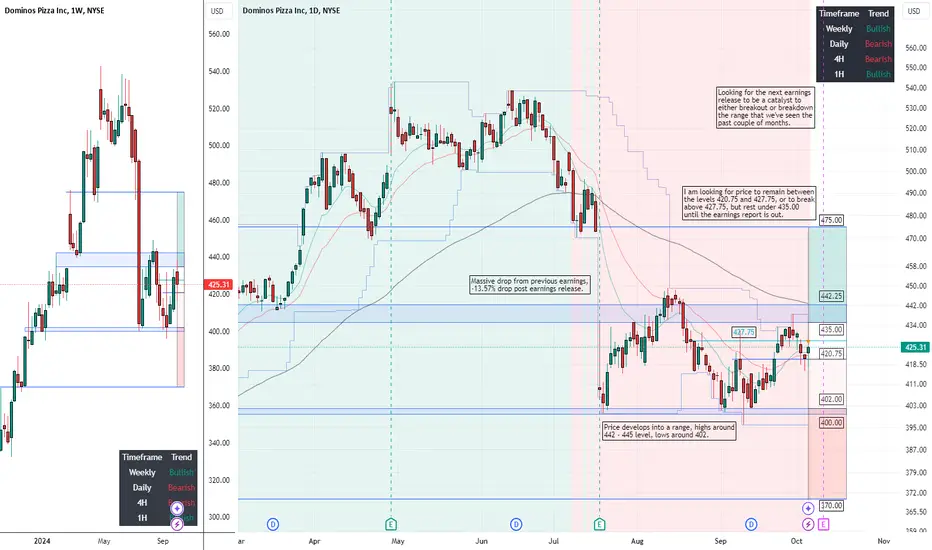
DOMINOS PIZZA $DPZ | RANGE BREAKOUT AFTER EARNINGS? - Oct 06 '24DOMINOS PIZZA NYSE:DPZ | RANGE BREAKOUT AFTER EARNINGS? - Oct 06 '24
BUY/LONG ZONE (GREEN): 435.00 - 475.00
DO NOT TRADE/DNT ZONE (WHITE): 420.75 - 435.00 (can be extended to 402.00 - 435.00)
SELL/SHORT ZONE (RED): 370.00 - 402.00 (can be extended to 370.00 - 420.75)
Weekly: DNT
Daily: Bearish
4H: Bearish
NYSE:DPZ saw a massive drop from previous earnings, -13.57% drop post earnings release. Price then develops into a range, highs around 442 - 445 level, lows around 402. I am looking for the next earnings release (Oct 10, pre market) to be a catalyst to either breakout or breakdown the range that we've seen the past couple of months. I am looking for price to remain between the levels 420.75 and 427.75, or to break above 427.75, but rest under 435.00 until the earnings report is out.
This is what I would personally look at before entering trades, everything is subject to change on a daily basis and as I analyze different timeframes and ideas.
ENTERTAINMENT PURPOSES ONLY, NOT FINANCIAL ADVICE!
trendanalysis, trendtrading, priceaction, priceactiontrading, technicalindicators, supportandresistance, rangebreakout, rangebreakdown, rangetrading, chartpatterntrading, chartpatterns, spy, sp500, s&p, fed, federalreserve, dominos, dominospizza, dpz, NYSE:DPZ , dominosearnings, earningsplay, earningstrade, dominospizzaearnings, dominospizzarange, rangetrade, earningssetup, dominospizzatrade, dominostrade, dpztrade, dpzearningsrelease, dominosiv, dominosoptions, dpzoptions, dpziv,
DPZ Domino's Pizza Options Ahead of EarningsIf you haven`t bought the dip on DPZ:
Now analyzing the options chain and the chart patterns of DPZ Domino's Pizza prior to the earnings report this week,
I would consider purchasing the 490usd strike price Puts with
an expiration date of 2024-7-19,
for a premium of approximately $12.85.
If these options prove to be profitable prior to the earnings release, I would sell at least half of them.

DPZ Domino's Pizza Options Ahead of EarningsAnalyzing the options chain and the chart patterns of DPZ Domino's Pizza prior to the earnings report this week,
I would consider purchasing the 380usd strike price Calls with
an expiration date of 2023-12-15,
for a premium of approximately $9.65.
If these options prove to be profitable prior to the earnings release, I would sell at least half of them.
Looking forward to read your opinion about it.

Time to sell Domino's and buy yourself a chicken kebab.Almost 2 months ago, I created a post about this stock, which was a follow up on a previous post. In those posts, I made it clear (hopefully) that a reversal for the stock was comming.
Now I want to make a post where i say its time to sell the stock to take profits and close the swingtrade for those who took it.
I am still bullish on the stock market for the long term, so holding doesn't seem like a bad option IF you were early enough. But this is the point where I would sell.

DPZ - MyMI Option Plays - CallsAfter announcing their partnership with UberEats and others, we had an explosive breakout this morning to $409.47 this morning, breaking above the $394.99 Level of Resistance before pulling back below and hitting the 50% Retracement Level ($378.50) before starting to retest that $394 Level.
I'm looking for a potential $419 retest at least, if not higher those $443 Levels of Resistance that never became support.
While showing a longer timeframe to show all Fib Retracement Levels that we're watching.

What goes up comes downI am just not sure what has caused this extraordinary price drop, when apparently it was looking like it was just recovering from down trend - if anyone knows please comment .
May be it’s just natural price correction in market, looking at today’s price action, buyers were able to take it up in first two hours up to $125.84, till that time it’s was all buyers hardly any sellers but later it’s was all sellers and price couldn’t hold and closed below opening price altogether 18.40% down.
If this is just some weird correction without any fundamentals changing, then I think price should come down to round $105 range.
Keeping a watch on this stock, leaving my notes here for community discussion.
Please note it’s not a trading advise by any means, please do your own research.

Dimonos Pizza's Bullish DivergenceA couple of months ago, I posted an analysis of Domino's Pizza. At that moment, a double bottom was formed. At this moment, a slightly lower low was formed, creating a bullish divergence on the weekly rsi. We also spoke about the buy singal on the Fetch Buy And Hold Indicator , which was the first one since 2008
I was also talking about a sideways period for the stock. I would love to see it happen around these prices. This would cause Dominos Pizza to go sideways at the horizontal support level, while staying above the two support trend lines of the channel.
Basically, the stock is seeing two bullish signals on the weekly chart, at a great discount.

Dimonos Pizza's Amazing ChartWhat is so amazing about a chart that fell roughly 50% in 1 year?
What we're seeing right now is a textbook falling channel structure. In general a falling channel consists of 1 resistance line and 1 support line in which the price oscilates between.
There are 4 lines on my chart. I'd like to add an extra support and resistance line in order to create more clarity for short term trading. This basically creates a channel within a channel.
One other property of the channel is that the price oscilates down until it hits an important support. At that point the price goes sideways untill it breaks out of the channel.
Now intrestingly enough, DPZ created a double bottom. That double bottom fell at the support of the inner channel. This means that the last support hasn't been touched, indicating a new sideways period.
Lastly, the FETCH Buy And Hold Indicator fired off a buy singal at the first bottom. This is the first buy signal since the bottom of 2008.
Fore more information about the indicator, visit this page.

The Two Scenario's Of Domino's PizzaMy last two posts were about the SPX and AMD and their falling channels, which are my favorite patterns to trade.
They follow an easy concept: They stay in their channels, untill they go sideways on an important support level, preferibly on a bullish rsi on the daily or weekly chart. I spotted one on the DPZ weekly chart, so I had to make a post about it.
I can see two likely scenario's for this stock, both of which, are going down. The only difference is where they decide to go sideways.
The first scenario is indicated by the green arrow. The support zone is at 175-300usd. The second one, which is indicated by the orange arrow, finds its support at 220-240.

Can Dominos survive the Downtrend? Sign of Bearish Trend
- Candlesticks moving below MA200 , possible challenge MA200 soon.
- If we take a look at ichimoku indicator, candlesticks moving back into the cloud & lagging span moving at similar level as candlesticks(failing to establish bullish revesral)
-Downtrend line B which form Lower low (LL2) has reach expectation of 1:1 of Line A, with a lower downtrend momentum (mixed)
Some Signs of reversal
-Candlestick moved above cloud for short period of time since the Top of 56X.
-Retracement line R2 retrace approximately 0.75fib of Line B, much stronger than retracement R1.
Expectations:
-Downtrend will continue after mini double top being formed and breached
- However Downtrend line C might not be able to meet 1:1 downtrend expectation of line C due to more signs of reversal such as stronger retracement R2>R1.
-Price level 370-390 will be interesting to watched:range where most tradings occur for the past 800 bars/days.

JUBILANT FOODWORKS - Base formationThe stock had seen quite a fall in the past few months.
Now it looks like it is forming a base around 2750 -2700 levels.
Immediate Resistance is at 2870 levels, not strong enough to resist prices for long.
Hence holding 2700 levels, the stock is most probably getting ready for a reversal.

Dominos dropping more?Looking at the M shaped curve for Dominos, it seems like it is setup for a symmetrical drop down to 350$ range.
Couple in inflation costs, labour shortages and supply chain issues this drop can be as fast 3 months.

Dominos - Master Splinter is fed up!-Domino’s Pizza on Thursday reported that its U.S. same-store sales climbed 3.5% in its latest quarter, despite tough comparisons to its skyrocketing sales during lockdowns last year.
-Shares of the company rose more than 11% in morning trading.
-Here’s what the company reported compared with what Wall Street was expecting, based on a survey of analysts by Refinitiv:
Earnings per share: $3.12 adjusted vs. $2.87 expected
Revenue: $1.03 billion vs. $972.3 million expected
-The pizza chain reported fiscal second-quarter net income of $116.6 million, or $3.06 per share, down from $118.7 million, or $2.99 per share, a year earlier.
-Currently, we have a hold position on this boy. Needs to cool down a little bit before continuing the rise.
-The estimate stock price by analysts for Dominos was standing at $625 (high), $535 (median) and $410 (low). Currently Dominos is super close to the high $625 price target where a strong resistance can be found. We expect the Dominos to rise to $600-620 levels and drop from there to more reasonable levels for the later rise.

DPZ (Domino's Pizza) Short: Bearish divergence and upwicks #0003Weekly: Closed lower, after upwick, impulse is blue (meaning MACD-H ticking down). Latest top diverging with previous local top. Often times, the 2.5 ATR level is a turning point for tops.
Daily: A nice set of divergences, on MACD lines, MACD-Histogram, and EFI. Even there is a divergence on Stochastic RSI, as well as ATR lines, showing an ATR channel divergence (see the two purple arrows). .
We can also see 2 long upwicks, supporting the idea that bulls run out of steam and the selling pressure comes in, as these price levels are rejected, and end of day closes close to the open price.
The entry can be either here, but I will wait the market open first, to see how it opens. I will post a chart on how I think I can enter, on a shorter Timeframe
Stoploss will be place somere halfway the upwick of the previous candle, around 465,1
Entry: 457
Target 1: 444,1
Target 2: 439,1
SL: 465,1
R/R ratio: 1:1.6, 1:2.1

#btc.d #daily #bitcoindominance #btcdominanceHi guys..its the latest analyze chart of #btc.d in daily time frame(folowers Requested analysis) .if you are interested any crypto that you want analyze with me and any questions please do not hesitate and comment below the chart!
if u like it press like-comment and folow me.thx

#BTC.D #4H #dominance #bitcoindominanceHi guys..its the latest analyze chart of btc.d in #4H time frame(folowers Requested analysis) .if you are interested any crypto that you want analyze with me and any questions please do not hesitate and comment below the chart!
if u like it press like-comment and folow me.thx

#btc.d #weeklyHi guys..its the latest analyze chart of #BTC.D in weekly time frame(folowers Requested analysis) .if you are interested any crypto that you want analyze with me and any questions please do not hesitate and comment below the chart!
if u like it press like-comment and folow me.thx


DOMINOS PIZZA LOOKS WEAK - IMPORTANT LEVELS
Targets: 331, 300, 375
Every pullback must be seen as an opportunity to sell.
Long should be opened only above 390.
Use appropriate quantity and risk-reward ratio.
Always use a stop loss.
Always risk a maximum of 1-2% of your capital.
P.S: This is NOT investment advice. This chart is meant for learning purposes only. This is my personal journal. Invest your capital at your own risk.

DPZ - Dominos Pizza - WEEKLY Setup - Buyzone w/ CAD + TargetsDPZ
Entry = 380
Cost Avg Down (CAD) = 352
1st Target = ATH (434)
2nd Target = 485
HODL Target = 516+
______________________________________________________________________________________________________________________
This content is for informational, educational and entertainment purposes only. This is not in any way, shape or form financial or trading advice.
Good luck, happy trading and stay chill,
2degreez
