DOT/USDT: Potential Breakout from Falling Wedge?Hey everyone!
If you're enjoying this analysis, a thumbs up and follow would be greatly appreciated!
DOT/USDT looks good in the daily time frame. Forming a falling wedge-like structure here and trying to break it out. A successful breakout will take the price to bear ATH. Buy some here and add more in the dip.
Entry zone:- $6.04-$6.48
Targets:- $7.4/$8.8/$10.5
SL:- $5.7
What are your thoughts on DOT's current price action? Do you see a bullish pattern? Share your analysis in the comments below!
DOT

POLKADOT ... ready for next movehello dear traders and investors
this price action for polkadot with usdt pair … this is very strong supourt zone on the 5.28 $ … after price rejected from 6$
In order for the price to rise further, it needed liquidity, and when it reached the $5.3 area, it took that liquidity and now it is ready to rise...
this is lower time frame The price forming a bullish patern :
In my opinion, the next price station is (13.58 ) the prz area of the harmonic pattern that you can see in the chart...
good luck

There is a high likelihood of continuing to fall!!!KUCOIN:DOTUSDT is forming a descending channel on weekly timeframe.
Looking for a move upside if we do break out and confirm the pattern.
✨Traders, if you liked this idea or have your opinion on it, write in the comments, We will be glad.
_ _ _ _ __ _ _ _ _ _ _ _ _ _ _ _ _ _ _ _ _ _ _ _ _ _ _ _ _ _ _ _
✅Thank you, and for more ideas, hit ❤️Like❤️ and 🌟Follow🌟!
⚠️Things can change...
The markets are always changing and even with all these signals, the market changes tend to be strong and fast!!

DOT/USDT Price Update in Daily TimeframeHello everyone, I’m Cryptorphic.
For the past seven years, I’ve been sharing insightful charts and analysis.
Follow me for:
~ Unbiased analyses on trending altcoins.
~ Identifying altcoins with 10x-50x potential.
~ Futures trade setups.
~ Daily updates on Bitcoin and Ethereum.
~ High time frame (HTF) market bottom and top calls.
~ Short-term market movements.
~ Charts supported by critical fundamentals.
Now, let’s dive into this chart analysis:
#DOTUSDT is currently trading within a well-defined descending triangle pattern with strong support around the $5.5-$6 range.
~ Support Zone: A strong support zone exists between $5.5 and $6, highlighted in green. This area has historically acted as a significant support level, preventing further downward movement.
~ Resistance Levels: The primary resistance levels to watch are $7.6 and the major resistance at $11.58, which aligns with the peak levels from early 2024.
~ Relative Strength Index (RSI): The RSI indicator at the bottom of the chart shows a bullish divergence, with the RSI making higher lows while the price makes lower lows. This divergence often precedes a potential bullish reversal.
If DOT/USDT breaks above the descending triangle, the 100EMA, and the primary resistance levels, the measured move target from the breakout point suggests a potential rally up to approximately $12.
The invalidation point will be a breakdown and close below the $5.5 support level.
DYOR. NFA.
Please hit the like button to support my content and share your thoughts in the comment section. Feel free to request any chart analysis you’d like to see!
Thank you!
#PEACE

Polkadot (DOT): Setting Up for a Bullish ReversalBINANCE:DOTUSD has recently breached the $6 level, forming a bullish divergence, as indicated by the vertical lines on the chart. The exit from the 3.618 Fibonacci time zone should ideally mark the end of Wave 2, though the exact completion of Wave 2 may lie slightly outside this range. It appears that Polkadot has completed its accumulation phase and is now entering the manipulation phase, with potential for expansion to follow.
Given the current situation, we are planning to place an entry at $4.85, with a stop-loss set just below the 100% Fibonacci retracement to protect against a Wave 2 invalidation. Our initial target is $9.30, aligning with the Daily Fair-Value Gap. This strategy aims to capture the potential upward movement as Polkadot transitions from accumulation to expansion.
Yearly VWAP Analysis:
Polkadot is currently holding the 2021 VWAP level perfectly. However, if this level is lost, the price could move down towards the 2021 VAL (Volume Area Low) at $4.55, which might provide significant support. To resume a bullish trend, Polkadot needs to reclaim the 2021 VAH (Volume Area High) at $6.80. Overcoming this level is essential for a sustained bullish move. If these levels are breached, a drop to the 2021 VAL at $4.55 is possible, where we might find strong support. Overcoming the yearly VWAP resistance is crucial for a bullish continuation.
Monthly VWAP Analysis:
Polkadot has lost the April VAL (Volume Area Low) and recently touched the November 2023 VWAP. Holding the November 2023 VWAP is crucial to maintaining a bullish stance, although there is potential for further downside. We anticipate a possible drop to retest the November 2023 VWAP and VAL levels to gather momentum for a bullish reversal. To turn bullish again, Polkadot needs to reclaim the current month's April VAL and VWAP levels, suggesting a stronger bullish outlook.
Conclusion:
If Polkadot fails to hold the November 2023 VWAP, we expect a move towards $4.82. For a bullish reversal, reclaiming the April VAL and current monthly VWAP levels is essential. Until these levels are reclaimed, we remain cautious and anticipate further downside. Our trading strategy involves entering at $4.85, with a stop-loss at $3.55. The take-profit targets are set at $7.76, $9.50, and open for further potential gains.

DOT Coin at Strong Support Potential for 24x Gains in Alt SeasonDOT Coin is currently positioned at a robust support level between $5.1 and $5.4, indicating a significant opportunity for a substantial gain during the upcoming altcoin season. Historically, these support levels have proven to be a launchpad for impressive bullish movements, suggesting that now is an ideal time to consider an investment in DOT Coin.
As we anticipate the altcoin season, the potential targets for DOT Coin are particularly promising. Based on historical data, the minimum target for DOT Coin during a bull run is $122, with a maximum target reaching up to $138. These targets highlight the considerable upside potential for DOT Coin, making it a compelling choice for traders looking to capitalize on the altcoin market.
In conclusion, DOT Coin’s current position and historical performance make it a strong candidate for substantial gains. With solid support levels and ambitious targets, DOT Coin is well-positioned to thrive in the upcoming altcoin season. Traders should consider this opportunity to potentially maximize their returns as the market conditions align favorably for DOT Coin.

Polkadot (DOT) Faces Increased Selling MomentumCritical Support Breach:
The daily chart shows a significant increase in selling momentum, driving Polkadot’s price below the critical $6 support level and out of a multi-month triangle pattern. This breach has triggered a substantial long liquidation event.
Downtrend Indication:
The price displays no signs of recovery on the daily timeframe, indicating the possibility of a continued downtrend.
Temporary Pullback Potential:
A slight and temporary pullback to the broken $6 threshold could occur, confirming the breakout and solidifying the bearish scenario.
Key Levels to Watch:
Primary Target: The substantial support region at $5.
Resistance: The significant resistance at $6.
Market Volatility:
Traders should exercise caution as the market may experience heightened volatility and notable fluctuations in the short term.
Stay alert and manage your positions wisely during this volatile period! ⚠️📉
#Polkadot #DOT #Crypto #MarketAnalysis #TechnicalAnalysis #Cryptocurrency #Trading #Bearish #Volatility

Long idea on DOTok, I need to describe the damn thing, I came in, I just believe in the high season now (I will duplicate the description in coins that I will take)

Long Idea on KSMok, I need to describe the damn thing, I came in, I just believe in the high season now (I will duplicate the description in coins that I will take)

Polka(DOT). Will it Survive?DOT is a long way from its high of $55, back in 2021. And now, currently, price has been struggling to push higher. With the thought the BTC ETFs being a game changer along with the BTC halving, there was the anticipation that Crypto would sky rocket. But this hasn't been the case. With all other coins getting hit by the current environment Crypto is facing, it stands that DOT is no exception. On the daily chart, DOT price is showing a head and shoulders pattern that could spell a push lower to the $5 lvl and maybe even to the $3.50. Since the FED interest rates seem to be the catalyst for the direction of crypto price so far, any data pointing at FED officials wanting to hold rates for longer (being hawkish) will continue to put pressure on Crypto's price.
Well with this said, how is Polkadot going to survive? There is things going for it that can get it through this rough patch:
-There are around 66 interoperability Cryptos and in that sector, DOT is the #1 coin, followed by Chainlink(LINK) and Cosmos(ATOM). DOT boasts close to a $8.5 billion market cap and LINK close to a $8.4 billion market cap (not too far behind), respectively.
-Amongst all the other Cryptos out there, it sits at #14 out of 10,127.
-Staking is currently at 11.78%, which has risen from 2023 when staking was around 9%, which if held for a year would be more then what some hedge funds can make. So not too bad.
-While not as much PR as some of the more prominent coins out there, it does have PR coming out which shows that it is still relevant
What do I think? I think DOT will survive and will likely drop which would be a buying opportunity. The Crypto Market as a whole is taking a drip (sitting at around 2.37 trillion currently, hitting a high this year in March of around 2.64 Trillion, and all time high of around 2.8 trillion back in 2021) and if price does continue to drop, it may test the support around 2.33 trillion. But majority of cryptos are taking a hit and as catalyst start popping up in favor of crypto, it is likely that DOT will join in this.

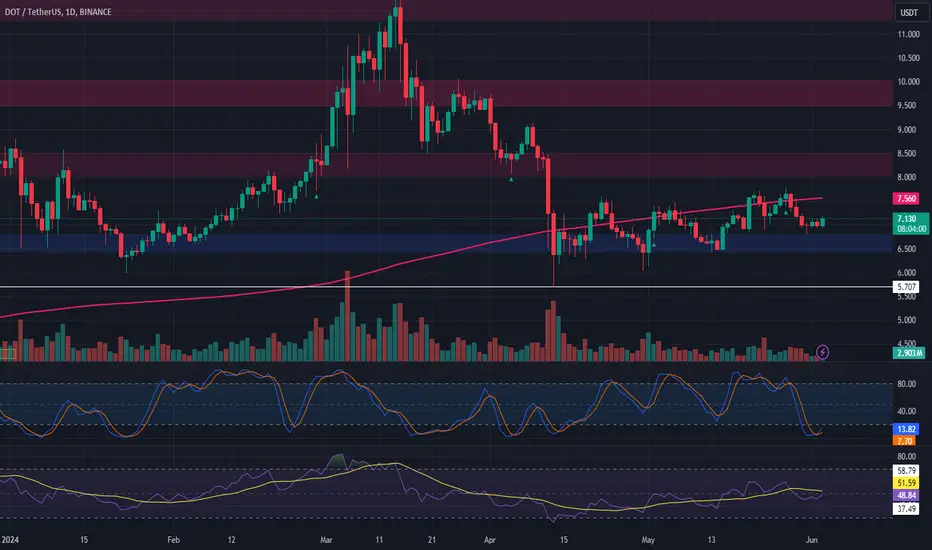
Support around 6.684 is the keyHello, traders.
If you "Follow", you can always get new information quickly.
Please also click "Boost".
Have a nice day today.
-------------------------------------
Unlike the SOLUSDT chart, the DOTUSDT chart is in a reverse arrangement, that is, a downward trend, with the M-Signal of the 1D chart < M-Signal of the 1W chart < M-Signal of the 1M chart.
When trading stocks (coins, tokens) that show this kind of movement, it is recommended to trade in short bursts.
Currently, the BW indicator of the TS - BW indicator is forming a horizontal line at the lowest point, and StochRSI > StochRSI EMA.
And, depending on whether there is support near HA-Low (6.684) on the 1D chart, you can trade.
Therefore, it can be seen that it is in a position where you can trade before the SOLUSDT chart.
However, as I mentioned above, since the price is below the M-Signal indicator on the 1D chart, it is recommended to check whether it breaks through upward and maintains the price.
Accordingly, I think it is more stable to check whether there is support near 7.283 in the box section of the HA-Low indicator on the 1D chart (6.053-7.283) and trade to make a purchase.
Since it has not been long since it turned into a downtrend, if it rises above the HA-High indicator (8.144) on the 1W chart, there is a possibility that it will show a movement to turn into an uptrend, so whether there is support near the HA-Low indicator on the current 1D chart is an important key point.
If it falls below 6.343, you should check for support near the 5.473-5.929 range.
If it rises above 7.319,
1st: 8.144-8.620
2nd: 10.131-10.611
You should check for support near the 1st and 2nd ranges above.
Have a good time.
Thank you.
--------------------------------------------------
- Big picture
It is expected that a full-scale uptrend will begin when it rises above 29K.
The range expected to be touched in the next bull market is 81K-95K.
#BTCUSD 12M
1st: 44234.54
2nd: 61383.23
3rd: 89126.41
101875.70-106275.10 (overshooting)
4th: 13401.28
151166.97-157451.83 (overshooting)
5th: 178910.15
These are points where resistance is likely to occur in the future.
We need to check if these points can be broken upward.
We need to check the movement when this section is touched because I think a new trend can be created in the overshooting section.
#BTCUSD 1M
If the major uptrend continues until 2025, it is expected to start forming a pull back pattern after rising to around 57014.33.
1st: 43833.05
2nd: 32992.55
-----------------

DOT is approaching a potential rebound zoneHello everyone, I invite you to review the chart of DOT in pair with USDT, looking at the one-month interval. We can start by identifying the main downtrend line that the price is currently below. Going further, you can see that we are approaching a very important support zone marked with a red rectangle. In this situation, it will be important to maintain the price in this zone, because it may be a good place for accumulation and a change of direction. However, looking the other way, we can identify four places of resistance that the price will have to face before it moves towards a new high.

Polcadot DOT price chooses the path to the end of the yearWe don't know what's going on in the #Polkadot project fundamentally, but we've heard almost nothing about their sensational parachains.
So let's just write what we see on the #DOTUSDT chart
1️⃣ The #DOT price seems to have drawn an H&S figure and is hovering over an abyss.
If it consolidates below $6, the fall may continue to $4.5, and in the worst case scenario, to $3
2️⃣ But as long as the #DOTUSD price is above $6-6.50, CRYPTOCAP:DOT holders can believe in a miracle and literally pray for a blue scenario.
Its working out to the region of $17-17.50 will allow at least some to exit positions that have been held for 2-3 years.
_____________________
Did you like our analysis? Leave a comment, like, and follow to get more

#DOT/USDT#DOT
The price is moving within a head and shoulders pattern on a 4-hour frame, which is a retracement pattern
Our right shoulder support area bounced after it was completed
We have a tendency to stabilize above the Moving Average 100
We have a downtrend on the RSI indicator that supports the rise and gives greater momentum and the price is based on it
Entry price is 6.45
First target 6.82
Second goal 7.07
Third goal 7.31

Polkadot Next BullRun- Okay now that we got the Bottom ( 4.3$ ish).
- We can try to calculate the highest points for the next bull run.
- i am not in patterns too much but we can see that DOT formed a kind of Cypher Bullish Pattern.
- A resistance was created around 9.80-10$.
- So Polkadot will have to go retest this zone and breakout to climb more.
--------------------------------------------------------------------------------------------------
- TP Zones :
--------------------------------------------------------------------------------------------------
- TP1 : 50$ ish (ATH 2021).
- TP2 : 85$ ish (161.8 Fibo).
- TP3 : 200$ ish (Max Fibo 423.6).
--------------------------------------------------------------------------------------------------
- Like Always :
-- Take your train ticket before the mass.
-- Sell when others rush to buy :D.
Happy Tr4Ding !

Navigating Crypto Bull Run 2024-2025Hello, Skyrexians!
While Bitcoin is locked inside the price range between 60k and 70k, altcoins look dead. While we saw fantastic rally for Bitcoin, Ethereum, Binance coin and other largest altcoins, most of crypto assets are still testing the bottom. This price actions can disappoint even best crypto traders. People usually trading cryptocurrency for profit, but now even if you bought altcoins at the bottom you have a very small profit.
In March 2024 most of crypto trading strategies predicted the further pump, but instead of this we can see -60% drop for most of crypto coins. Even most of trading bot strategies faced with huge losses during last 3 month. During the bullish phase the best decision is to use grid trading bot, but this time price went out from the grid bot trading range, therefore even automated trading bots faced with losses.
In our opinion such shakeout was needed because of excessive optimism on the crypto market. People needs to be disappointed and sell their crypto before the true bull run. Now it’s happening, we will show you our thoughts about crypto market and will try to analyze what is coming next.
Bitcoin analysis
As it usually happens Bitcoin started moving up first. It’s bull run started at the beginning of 2023. We will analyze 1W time frame. Awesome Oscillator and Alligator showing us that Bitcoin is still in global wave 3 because of it’s maximum value. Moreover AO still has not crossed zero line. It means that there are a lot of time before bull market will be finished.
We predict the wave 3 finish in the upcoming 1-2 months with the price target approximately at $80k. Let’s use this target to predict the further scenario. We have the super confident target for the wave 4. It’s inside the range between 0.38 and 0.5 Fibonacci retracement for the wave 3. It’s inside the range $54-61k. Moreover, lower degree wave 4 has been finished there. When price will reach this zone, for bullish reversal bar and AO crosses zero line, it can be the strong sign that global wave 4 is finished.
Assuming that wave 4 will be finished in this zone we can predict the target for the wave 5. We have to take the distance from wave 1 bottom the wave 3 top and measure it from wave 4 bottom. This is the maximum target for the wave 5 and the entire bull run, at $115k. The minimal target is 0.61 from this distance, approximately at $92k. Anyway, this wave shall be printed in conjunction with the AO bearish divergence to kill this bull trend.
Taking into account that wave 4 can be very long in terms of time this bull run will be finished in the middle of 2025.
Bitcoin Dominance
Bitcoin is moving clear, but what with altcoins? The key chart for altcoins is the BTC Dominance chart. Every time we see huge drop on it, massive alt seasons happen.
You can say that this is not a real asset and it’s impossible to predict it’s value, but all these movements is the trader’s psychology. Therefore we can use classical TA tools here. BTC Dominance now is inside the target area 0.5-0.61 Fibonacci. There is a high chance that massive dump will start from here. This time it can break 40% and finally reach 24%. We believe that this time this decrease can be on the real Bitcoin’s dump. Large players have a huge gains on Bitcoin and they need to distribute liquidity to take profit, that’s why alt seasons usually happens. We predict the altseason start in the upcoming 2 months.
Cardano (ADA) analysis
Let’s move on to altcoins analysis and start with the old assets ADA. It has enough history to make a price prediction. Previous bear market bottom was at $0.02, this time it has reached $0.2. You can say it’s 10x from the bottom, how it will go up?
We can conclude that ADA is the uptrend crypto asset because it’s making higher lows from cycle to cycle. Therefore the previous bull run could be just the wave 1. Global wave 2 finished with the bullish divergence with AO on the weekly time frame and after that we have seen this local rally. This rally is just the wave 1 of the new bull run and current dump is just a correction to it. For sure we need more disappointment, that’s why we expect more sideways in the current range. When everybody will be disappointed the huge wave 3 starts. It has two targets: $3.3 and $5.2 if this bull run will be extended.
Cosmos (ATOM) analysis
The main question of the day is why such fundamentally strong asset like ATOM is still at the bottom, while meme coins made 10x. For sure it was a huge mistake, but as we can see now people hate such assets like ATOM. They want to buy Solana or PEPE instead and it’s good sign for ATOM holders. We make our predictions based only on charts and this chart is also telling us about bull run is coming.
ATOM is also making higher lows from cycle to cycle. The main difference with ADA is that Cosmos has printed shortened wave 5. First bullish wave finished in March and now price is finishing wave 2. Wave 3 will start suddenly when nobody believe it that. We suppose in September will be huge gains on fundamental projects. Minimal target is $49, maximum one is $77 according to 1 and 1.61 Fibonacci extensions.
Polkadot (DOT) analysis
The last crypto asset for today is DOT. It has almost the same pattern like previous two assets. Wave 5 of bear market was not shortened here that’s why we have seen rally more than for ATOM.
Previous bear market bottom has been reached much lower that in the current cycle. In our opinion the first wave of the new bull run has been already printed ad current disappointing wave 2 is trying to persuade people to sell their assets.
After 1-2 month of consolidation and may be making lower lows locally we will see the huge push the the upside. The minimal target is $56, maximum equals $89.
Conclusion
Most of altcoins are in the huge accumulation which lasts for almost two years. In the previous bear market was almost the same time before significant gains. For sure this time can be different and may be it’s time to die for altcoins, but Elliott Waves analysis reflects perfectly the crowd’s mood. If now we can see still a lot of optimism, if price will continue sideways they disappoint.
Overall, we can see now two groups of traders. The first one is still bullish, the second one is waiting for new lows below the current consolidation to enter the market. We suppose that both major groups shall be fooled, market maker will not allow assets to dump that much, but at the same time he will not pump it before most of bulls sell their assets.
Best regards,
Skyrex Team

DOT's last bottom before the new ATHCRYPTOCAP:DOT will be ready to target a new ATH from the $4.90 : $4.25 range in my opinion.

DOT - at the beginning of the returnIt seems that Polkadot, the DOT, has made a harmonic pattern. And the downtrend line has broke due to the uptrend wave started by the BTC.
However, be careful since there probably be a retest or pullback down to shake some of the buyers.

DOT/USDTHello everyone, welcome to a quick review of the DOT chart. As we can see on the chart, we are locally moving along a downward trend line. After unfolding the fib retracement grid, you can see the price staying above the strong support level at $7.04, then the support level at $6.73, and then the strong support level at $6.44. Looking the other way, you can similarly identify resistance points. And here we can see the resistance at the level of $7.17, the next important place is $7.40, after which we will be able to see an upward movement towards the resistance at the price of $7.77.

Polkadot (DOT) Daily Chart AnalysisCurrent Situation:
A detailed examination of Polkadot’s (DOT) daily chart reveals a bearish sentiment. The price faced rejection after a period of sideways movement around the critical $7.5 resistance level and the significant 200-day moving average.
Bearish Indicators:
Resistance Rejection: The price was rejected at the $7.5 resistance level, reinforced by the 200-day moving average.
Seller Dominance: Sellers are currently dominating the market, suggesting a bearish retracement towards the $6.5 threshold is increasingly likely.
Key Support and Resistance Levels:
Resistance Level: $7.5
Support Level: $6.5
Market Context:
Despite the bearish sentiment, Polkadot remains confined within a decisive range marked by the $7.5 resistance and $6.5 support. A breakout from this range will likely establish the direction for a sustained trend.
Trade Strategy:
For Bears: Watch for a break below the $6.5 support level for potential short opportunities, targeting lower levels.
For Bulls: A break above the $7.5 resistance could signal bullish momentum, providing opportunities for long trades.
Stay vigilant for a decisive breakout from this range to gauge the next sustained trend direction for Polkadot.
#Crypto #Polkadot #DOT #MarketAnalysis #SupportAndResistance #BearishTrend #200DMA #TradingStrategy #Cryptocurrency #Blockchain
Polkadot: Is it time to buy?DOT is trading almost 87% lower than its previous ATH and is now about to hit its bottom support again, IMO. The $4.75 level is my buy zone for DOT, with a target of $14 for the midterm and an optimistic target of $128 for the long term in case of a super bullish market.

DOT is bullishWe have a bullish CH on the chart and we have higher highs and higher lows.
By maintaining the demand area, it is expected to move towards supply
The targets are clear on the chart
Closing a daily candle below the invalidation level will violate the analysis
Note that the financial market is risky, so:
Do not enter any position without confirmation and trigger.
Do not enter a position without setting a stop.
Do not enter a position without capital management.
When we reach the first TP, save some profit and try to move the stop continuously in the direction of your profit.
If you have any comments please post them, comments will help us improve our performance
Thanks

#DOT_#CRYPTO_#BEARISH_ShortScript still not gettng momentum after continually trading inside the parallel channel, it finally break down and printed new lower lows. Still the momentum is week and looks like it will soon test the levels marked on the chart.
#DYOR (Do your own research)
