ALTCOINS | ALT Season | Buy Zones PART 2💥 SUI / BINANCE:SUIUSDT
SUI ideal buying points, weighing heavier towards the lower zone:
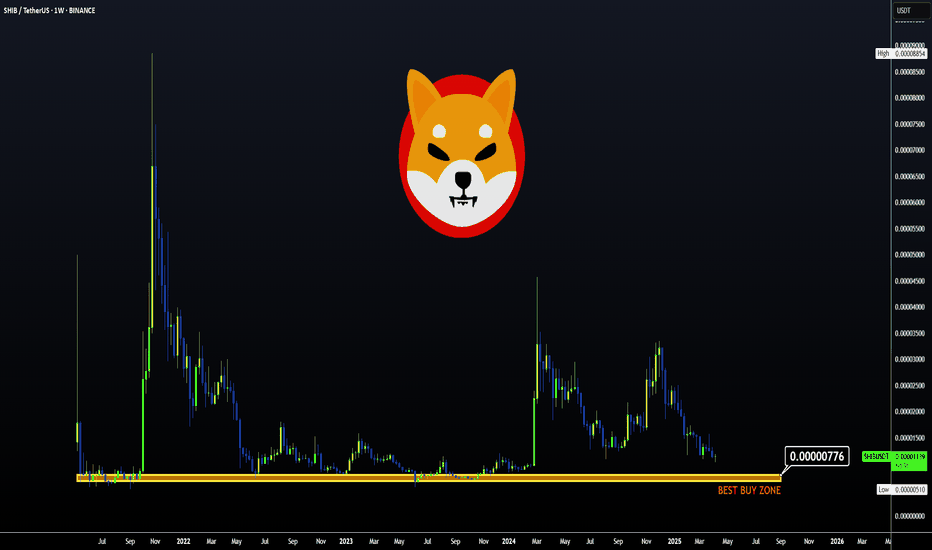
💥 SHIBA / BINANCE:SHIBUSDT
SHIB ideal buying zone is approaching, but ideally the lower zone is the better buy:
💥 DOT / BINANCE:DOTUSDT
Dot worries me for the reason that it has retraced nearly all the way to 2021 prices. Therefore I'll keep trades small, with modest TP zones.
BUY zone for a swing, not accumulation:
💥 PEPE / BINANCE:PEPEUSDT
PEPE buy zone seems far away, but considering how hard alts can drop in only a few days, I'd be ready with the orders, hanging heavier towards the lower zone:
💥 BINANCE / BINANCE:BNBUSDT
BINANCE shows promising swings. Ideal BUY zones include:
For the next cycle, in other words long term target, I'd watch the 1.618 at least:
This would make it an accumulation buy.
________________
DOT
DOT - Strong bounce from the ultimate low ?Bounced each time for consequent gains around 3.75, so I expect the same now
placed a SL a bit wide, a good fuel could be the 2.0 update of Polkadot but didn hear any news about it to be honest
In the other hand, lower would means I'll quit this asset for a mid/long term hehe,
Cheers
Polkadot: Shaky SupportPolkadot remains weak, barely holding onto the round $4 mark on Friday. Primarily, we soon expect another sell-off below the support at $3.67 and into the orange Target Zone between $2.40 and $1.07. Once the low of the magenta wave is reached down there, the next major impulsive movement can start and carry the price back above the resistance at $5.38. If Polkadot turns sustainably upward now and directly breaks through the $5.38 mark, the next magenta impulse wave alt. will begin prematurely. In this 20% likely alternative scenario, the corrective structure (still ongoing according to the primary scenario) would have already been completed with the low of March 11.
DOTUSD: There is no better buy entry than this.Polkadot has been inside a huge Rectangle pattern since the October 19th 2023 Low that created the S1 Zone, a wide consolidation pattern whose top is the R1 Zone. The 1D RSI is already on a HL bullish divergence, identical to both prior bottom formations on the S1 Zone. Since the 1D MA50 has already been breached, we estimate that the price will start the new bullish wave soon. There is no better buy entry than the current level. Aim for the bottom of the R1 Zone (TP = 11.500).
## If you like our free content follow our profile to get more daily ideas. ##
## Comments and likes are greatly appreciated. ##
DOT in coming days ...The pattern has broken, and now I expect the price to rise to $5.3.
Give me some energy !!
✨We spend hours finding potential opportunities and writing useful ideas, we would be happy if you support us.
Best regards CobraVanguard.💚
_ _ _ _ __ _ _ _ _ _ _ _ _ _ _ _ _ _ _ _ _ _ _ _ _ _ _ _ _ _ _ _
✅Thank you, and for more ideas, hit ❤️Like❤️ and 🌟Follow🌟!
⚠️Things can change...
The markets are always changing and even with all these signals, the market changes tend to be strong and fast!!
#DOT/USDT#DOT
The price is moving within a descending channel on the 1-hour frame, adhering well to it, and is heading for a strong breakout and retest.
We are seeing a bounce from the lower boundary of the descending channel, which is support at 4.40.
We have a downtrend on the RSI indicator that is about to be broken and retested, supporting the upward trend.
We are looking for stability above the 100 Moving Average.
Entry price: 4.43
First target: 4.50
Second target: 4.57
Third target: 4.64
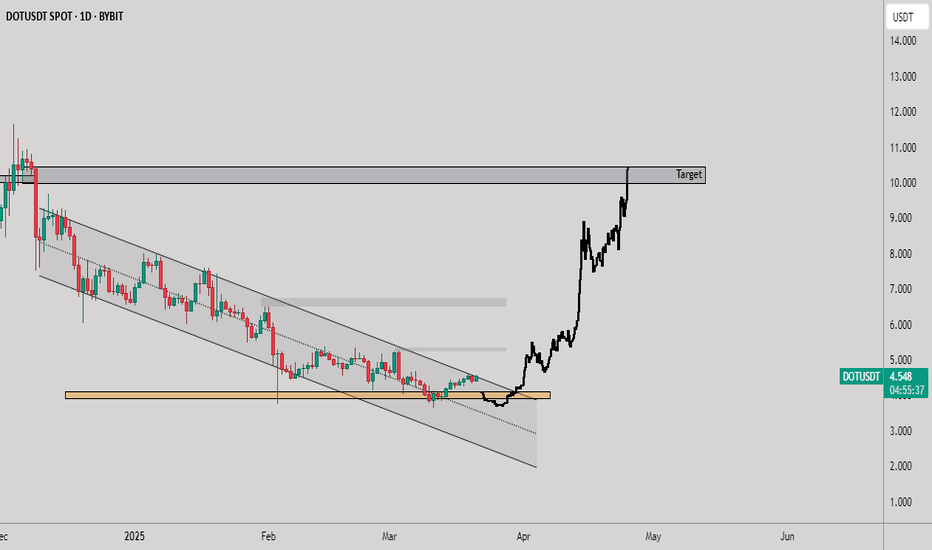
DOT/USDT (Bybit - 1D Chart)📍 Timeframe: 1D (Bybit Exchange)
📈 Current Price: $4.550 (+3.43%)
Key Technical Insights:
Descending Channel Breakout:
DOT had been trading in a descending channel since late 2024.
A successful breakout from the channel indicates a trend reversal.
Strong Support Retest & Bounce:
The price found support at the $4.00 region (marked in yellow).
Multiple tests of this level suggest strong demand and potential accumulation.
Major Resistance & Upside Target:
The next key resistance zone is around $10.00 (marked as "Target").
If momentum continues, a move towards $12.00–$14.00 is possible.
Possible Price Path:
The projected price movement (black line) suggests a retest of support before a rally.
If price holds above $4.20–$4.30, further bullish continuation is expected.
Trading Strategy:
Bullish Entry: Consider long positions on a retest of $4.20–$4.30 with a stop below $4.00.
Breakout Confirmation: A daily close above $5.00 strengthens the case for an upward push.
Profit Targets: $7.00, then $10.00, and extended targets at $12.00–$14.00.
PolkaDot DOT Has Just Confirmed The Huge Reversal!Hello, Skyrexians!
Recently we made analysis on BINANCE:DOTUSDT where pointed out that the reversal is likely, but not confirmed. Now we have the reversal signal even on weekly. Moreover, we know that you don't like DOT and argue when we draw the unbelievable targets. Toady we will show you the realistic one.
Let's take a look at the weekly chart. We can see two confirmed green dots on the Bullish/Bearish Reversal Bar Indicator . Moreover there bars have the great angle with the Williams Alligator. Even if we will not count Elliott waves it's enough to have an idea that bull run is starting now. The realistic target is located at 0.61 Fibonacci zone approximately at $30-$35.
Best regards,
Skyrexio Team
___________________________________________________________
Please, boost this article and subscribe our page if you like analysis!
#DOT/USDT#DOT
The price is moving within a descending channel on the 1-hour frame, adhering well to it, and is heading for a strong breakout and retest.
We are seeing a bounce from the lower boundary of the descending channel, which is support at 4.22.
We have a downtrend on the RSI indicator that is about to be broken and retested, supporting the upward trend.
We are looking for stability above the 100 Moving Average.
Entry price: 4.30
First target: 4.37
Second target: 4.46
Third target: 4.57
Be careful with DOT !!!the price can form a head and shoulders pattern. If that is happen, expect a significant price increase.
Give me some energy !!
✨We spend hours finding potential opportunities and writing useful ideas, we would be happy if you support us.
Best regards CobraVanguard.💚
_ _ _ _ __ _ _ _ _ _ _ _ _ _ _ _ _ _ _ _ _ _ _ _ _ _ _ _ _ _ _ _
✅Thank you, and for more ideas, hit ❤️Like❤️ and 🌟Follow🌟!
⚠️Things can change...
The markets are always changing and even with all these signals, the market changes tend to be strong and fast!!
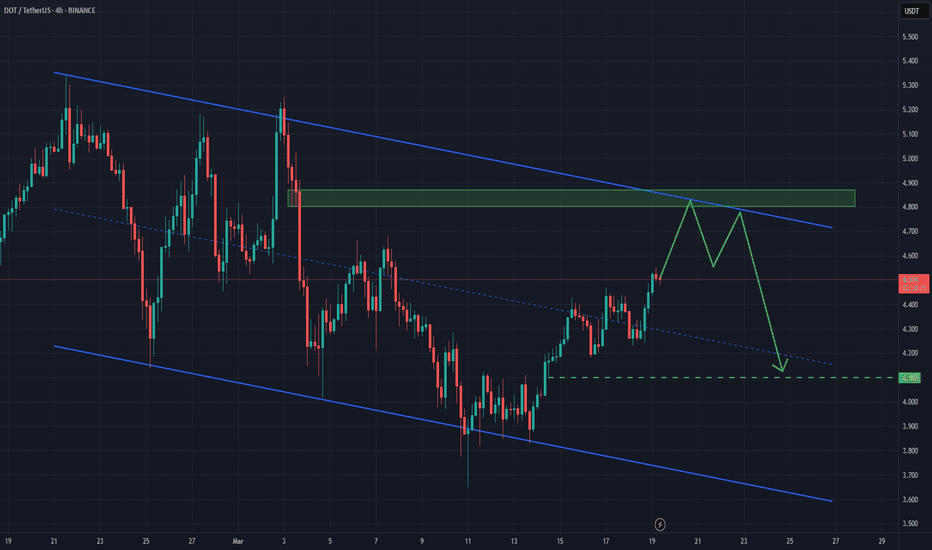
DOT/USDT: Consolidation Expected After Recent Bounce The DOT/USThe DOT/USDT market has recently rebounded from a previously tested level from November. Following this bounce, the price appears to be forming an ABC pullback, moving towards the channel boundary.
Historical price action shows that the market has consistently respected the resistance zone, reinforcing the prevailing bearish trend. Given this setup, the market is likely to enter a consolidation phase, with price stabilizing within the 4.88 to 4.00 range. The next key target lies at the support zone around 4.100
PolkaDot DOT Has a Chance, But Still In Danger!Hello, Skyrexians!
Recently we have already made analysis on BINANCE:DOTUSDT before the dump, where pointed out that wave 5 to the downside ahead. Asset has finally reached the minimal target at $3.8 and now we have a question if it's going to reverse or $2 is next.
Let's take a look at the daily time frame. We can see the Elliott waves structure and wave 5 can be finished anytime now. Our best practice to find the reversals is the green dot on the Bullish/Bearish Reversal Bar Indicator and the divergence with Awesome Oscillator. Now we can see all these conditions, but bullish reversal bar is still unconfirmed, while it's high is going to be broken, the danger will be melted, but now we still have a chance to go down.
Also wanna notice the false signals on the indicator. All of them are placed inside the range and cannot be counted as valid. Take it into account when use it.
Best regards,
Skyrexio Team
___________________________________________________________
Please, boost this article and subscribe our page if you like analysis!
DOTUSDT at a Make-or-Break Level – Big Move Incoming?Yello, Paradisers! Is DOTUSDT on the verge of a breakout, or will the bears crush the momentum? Read on this is a critical moment!
💎#DOTUSDT is showing strong bullish momentum, bouncing off the demand zone above $4.582, signaling that buyers are stepping in and defending key levels. The market structure remains favorable for the bulls, but a crucial test is ahead.
💎The price is trading above both the 50 EMA and the 200 EMA, which is a strong indication that the uptrend is intact. Volume is increasing near demand zones, suggesting that buyers are actively supporting the price. This reinforces the strength of the trend, with green candles showing a strong buying push and minimal wicks, indicating low selling pressure.
💎If POLKADOT successfully breaks and holds above $5.00 with strong volume, the next upside target is $5.30, a major resistance zone. A decisive breakout here could open the door for an even stronger rally. However, if DOT fails to break $5.00 and retraces, the lower demand zone at $4.465 will be a key area to watch for a potential bullish rebound. A close below $4.215 would invalidate the bullish setup and shift momentum in favor of the bears.
Patience is key, Paradisers! If we see a confirmed breakout, we act. If not, we wait. Discipline is what separates traders from gamblers. Stay sharp and trade smart! 🎖
MyCryptoParadise
iFeel the success 🌴
Polkadot 8X Trade-Numbers (6,280% Potential)One is theory, the other one is practice.
One is the analysis and the other one the numbers.
Technical analysis and trading numbers.
Here we go again with Polkadot (DOTUSDT). This time around we are not focusing on the analysis but the full trade-numbers for a leveraged trade. Still, let's consider the chart briefly and what it has to say.
The black lines... Previously, the black lines showed the drop and the incoming bear-market. High prices and All-Time High = bearish. A long-term double-top, the highest ever, led to the strongest ever bear-market.
Now, the black lines signal support. The market bottom. All-Time Lows and bottom prices = bullish. A long-term accumulation phase with higher lows will kick off the next bullish market. We are in, we are live and we are green.
The market moves in cycles and within this cycles we have waves...
We are going from a neutral, sideways market to a bullish market. The neutral sideways market produces the same highs and the same lows. The bullish market will produce higher highs and higher lows. This is were we are going next.
Notice that we use lower targets for the leveraged trades compared to spot trades. This is because leverage carries higher risk. We are happy with a win and with big profits but not greedy. In this market, greed will get you killed. Financially speaking.
Full trade-numbers below:
____
LONG DOTUSDT
Leverage: 8X
Entry levels:
1) $4.60
2) $4.30
3) $4.40
Targets:
1) $4.92
2) $5.62
3) $6.77
4) $7.70
5) $8.63
6) $9.96
7) $11.6
8) $14.66
9) $16.52
10) $19.53
11) $21.68
12) $24.41
13) $32.30
14) $40.19
Stop-loss:
Close weekly below $4.00
Potential profits: 6280%
Capital allocation: 4%
____
Disclaimer: I love you and I am deeply grateful for your continued support.
You are a diving human being, you can do whatever you want.
It is your life, it is your body, it is your money, it is your soul.
Trade, drink, eat, sleep; it is your choice.
Namaste.
DOT in accumulation zone!Hello followers and haters,
I figured out that almost everyone here hates longterm analysis so I will post another one.
We can see DOT once again in beautiful accumulation zone , zone where I personally started accumulating tokens in previous cycle and in this one as well.
We are looking to take some profits on the FIRST TP where we can expect anywhere from 1 00% to 200% depending on our average buy price.
Second TP will bring us anywhere from 300% to 350%.
If we however drop even lower (WHICH WOULD BE AMAZING) there is an ALL-IN zone where I will be looking to put more money on my buys.
My accumulation is buying some DOT every 2-3 days while we are in the zone.
I marked only 2 TP zones for and as we will move UP in the BULL RUN I will post updates on where my next TP zones are.
Hope this helps, play it smart and stay patience!
#DOT/USDT#DOT
The price is moving in a descending channel on the 1-hour frame and is expected to continue upwards
We have a trend to stabilize above the moving average 100 again
We have a descending trend on the RSI indicator that supports the rise by breaking it upwards
We have a support area at the lower limit of the channel at a price of 4.50
Entry price 4.60
First target 4.72
Second target 4.85
Third target 4.99


