DOT | What is in my Mind This is My Idea About Polkadot since 2022-2026
Dot Can be Rich to Minimum 210 $ in 2025
Also In My Mind Dot is Second ETH
But it is Better Than ETH
DOT

🔥🚀3 LONG TARGETS: DOT will start it's rally, if THIS happen! Hi friends! POLKADOT will follow the BTC as 99% other altcoins. But where the best entry point to buy DOT and make a profit?
Now the DOT fall below the key level of $6. This level was the support for the long time, so a lot of sl were taken during this local dump. ✅ Of course, this good for the whales to buy more DOT and for us to open a trade with the BIG players.
📊 The main reasons to open a long:
1. liquidity collection by the whales
2. squeeze to the trendline
3. bullish BTC🔥
🚩 The volume falls despite the price LL. Usually, when whales are taking the sl of the retail traders, the volume is growing. Now we see that the volume just fall. It mean that there is no retail traders at the market and the whales accumulate enough DOT and just wait for the price reaching targets.
✅ The main targets for Polkadot:
🔥 $6.2-6.5 - value area
🔥 $6.95-7.4 - value area
🔥 $8 - key level
🔥 $9.2-10 - value area and even number
💻Friends, press the "boost"🚀 button, write comments and share with your friends - it will be the best THANK YOU.
P.S. Personally, I open an entry if the price shows it according to my strategy.
Always do your analysis before making a trade.

DOT - Its Time Will Come!Hello TradingView Family / Fellow Traders. This is Richard, as known as theSignalyst.
DOT has been overall bearish for a while and it is now approaching a strong weekly support and round number 5.0 in green.
DOT is forming a channel in red but the upper trendline is not valid yet, so we are waiting for a new swing low to form around it to consider it our trigger swing.
For the bulls to take over from a long-term perspective, we need a break above the channel and last major high in gray.
Meanwhile, until the buy is activated, DOT would be overall bearish and can still trade lower inside the 5.0 support.
In this case, as price approaches the support again, we will be looking for short-term buy setups.
Always follow your trading plan regarding entry, risk management, and trade management.
Good luck!
All Strategies Are Good; If Managed Properly!
~Rich

DOTUSDTwaiting for CHoCH on 5-15m tf and open short, follow the risk management and don't forget to put stop loss

DOT USD | Coin for the long term.Hello trader Today I have prepared a new idea for you. Like and subscribe to the channel there is a lot of useful information✅
Some fundamental information:
DOT coin is currently ranked #11 on CoinMarketCap with a market cap of $395067793126 Circulating supply is 1,142,530,551 DOT
The Polkadot protocol connects public and private chains, permissionless networks, oracles, and future technologies, allowing these independent blockchains to exchange information and transactions trustlessly through the Polkadot relay chain (explained below).
Polkadot’s own token, DOT, performs three main tasks: it provides network management, its operational activities, and is also involved in the creation of parachains (parallel chains) by linking .. In general, a strong fundamental project that can already be bought off!
Let's now go through the technical side:
If you pay attention to the chart, you can see that the asset is now in a strong accumulation zone. After a strong fall in BTC, the asset fell another -40% and, in my opinion, reached its bottom.
I also highlighted the 2020 side trend with a red block, the asset was in the $3.6-6.2 zone for a sufficient time and after, but then you yourself see everything, a real bull has begun, success may be repeated
I think that here you can start buying back the coin on the spot, from the level of $5.50-5.70 is my area of interest.

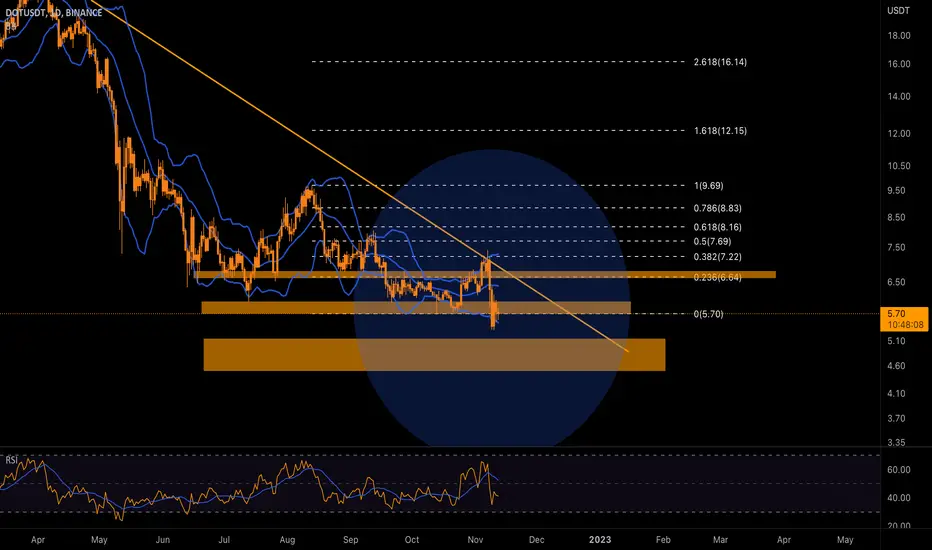
DOTUSD Can't stop this death spiral unless the 1D MA200 breaks.Polkadot (DOTUSD) has been trading within a Channel Down pattern since the November 08 2021 High. Our previous DOT analysis was on July 16, which hit its target with the help of that pattern:
In early November the price broke above it marginally but as it failed to cross the 1D MA200 (orange trend-line), the 1D RSI formed a top (red circle) and caused the price to drop. As you see, this pattern is consistent with both previous Lower Highs, a 1D RSI on these levels forms a top and causes the price to drop aggressively.
This 'Death spiral' can only stop with a break above the 1D MA200, which is the Resistance since January 05. Until then, we can expect DOT to make a new Lower Low either on the 0.786 Fib around 5.00 or even lower on the 0.618 Fib (4.50 - 4.00) before the end of the year.
-------------------------------------------------------------------------------
** Please LIKE 👍, SUBSCRIBE ✅, SHARE 🙌 and COMMENT ✍ if you enjoy this idea! Also share your ideas and charts in the comments section below! This is best way to keep it relevant, support me, keep the content here free and allow the idea to reach as many people as possible. **
-------------------------------------------------------------------------------
You may also TELL ME 🙋♀️🙋♂️ in the comments section which symbol you want me to analyze next and on which time-frame. The one with the most posts will be published tomorrow! 👏🎁
-------------------------------------------------------------------------------
👇 👇 👇 👇 👇 👇
💸💸💸💸💸💸
👇 👇 👇 👇 👇 👇

You have to wait until the price stabilizes on the levels!DOT had a sharp downtrend over the past week. The price of this currency registered a sharp decline after failing to stabilize above the resistance range of $6.6-6.8, and the selling pressure broke the support of the $5.7-6 range. This bearish trend could continue if Bitcoin breaks back below the $16,000 range, taking the price down to key support in the $4.5-$5.14 area.
Selling pressure and sellers' strength is still high, and this can be seen from the upper angle of the descending wave with the horizontal axis. To see the signs of reduction and removal of selling pressure, we can consider the positive divergence of the RSI indicator, the volume divergence, and a complete pullback to the downward trend line. With a higher probability in the channel range of $4, there is a possibility of a complete price reversal and trend change. Therefore, you should wait until the price stabilizes at the specified levels.
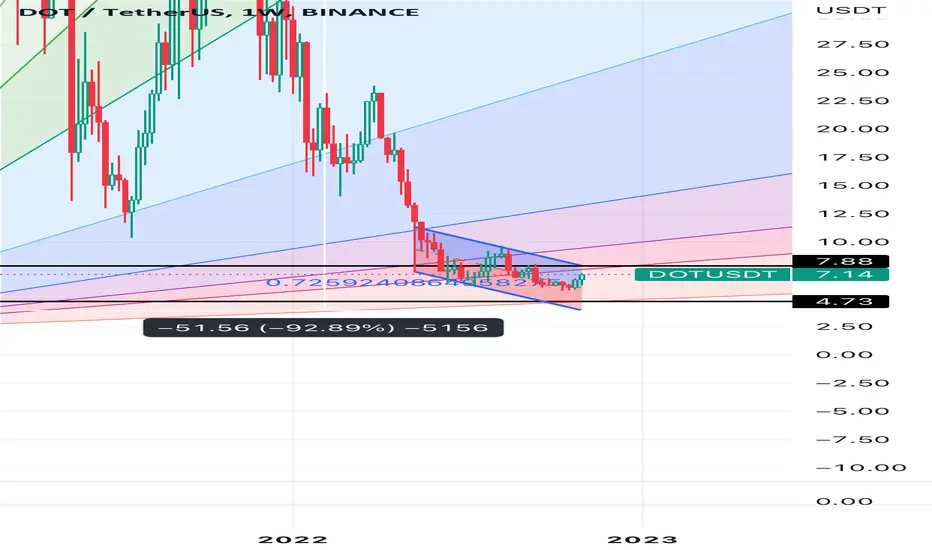
Polkadot DOT price has nowhere to fall below. It's time for longIt's been a while since we did a DOTUSDT idea, then it's time to refresh our thoughts.
As you can see from the chart, the DOT price is clearly moving from one liquidity level to another, we have marked them nicely on the chart.
So, we assume that the price of the Polkadot token will consolidate a little more, buyers will gain strength and break up from the falling channel.
Therefore, we make an assumption for ourselves about the possible movement of the DOTUSD price
Long to $6.60 - correction - long to $7.90 - correction - long to $9.50-10
_____________________
Did you like our analysis? Leave a comment, like, and follow to get more

Polkadot - I'm Interested..Polkadot is one I am eyeing closely for the next bullrun - with everything going on with Solana who knows what develops over the coming months/year.
I have my bids below if we get there, but clearly short-term resistances above and a key s/r level we're trading below as of now.
Daily candle closes in a couple hours and I think that will be telling of where it heads in the coming weeks.
Let me know your thoughts in the comments!
Cheers

🔥75% OF CRYPTO MARKET MIGHT BE UNDER BINANCE CONTROL❗ BUY MORE❓🔥Hi friends! The monopoly of Binance will start, if FTX finnaly scamed. FTX was the top-2 exchange, right after the Binance. So now I recommend you to pay the attention to the strongest BINANCE projects or project based on BNB chain, because they can bring you the HUGE income in 1-2 year.
✅ The list of it I will add at the end.
🚩 RIGHT NOW: Binance have released the amount of crypto on their wallets. CZ yesterday named it Proof of Assets. Also, now you can find this information on the Binance website.
📊 TECHNICAL ANALYSIS
Now the BNB return to the HUGE accumulation area of $268-304, where the most coins were bought by the big players (whales). Now we see that price possibly make the false breakout of the lower boundary and this is strong bullish signal, if BNB close inside the area.
📊 The trading plan to open a long:
🔥 bnb still in the value area of $260-304
🔥 possible false breakout of the local low which take the sl of traders and the whales will buy even more coins
🔥 volume growth on sl collections
🔥squeeze to the local trndline after the breakout
🚩 Also, remember about DOM and Footprin which is my most important trading tools for scalping. They shows me the best place to buy and to sell crypto with the whales. So you can increase your winrate by +25-30% using just this scalping tools.
✅ The targets for BNB:
1. $300 - the top boundary of the value area
2. $335 - the local highs
3. $400 - the local highs after the pump
📊 Why the short trade is still possible? The main reason for the dump is BTC. So if it will fall to $12-14k, all the altcoin make -30-40% more.
🚩 The main precondition for the short trade is the fall below the value area of $260-304 and test it as the resistance. You can set sl above the local high and ope nice trade with 20-30RR. The main target is the closests support at $235-243 value area.
All of these plans I leave on chart, so you can use it at any moment!
✅ Now BNB skyrocketing on FTX. The price already reach it's ATH at $670. I think this is because of rumors that Binance will return the money to the owners of BNB on other exchanges (if this funds will be lost ). This is the possible reason why BNB start to PUMP.
📊 WHY THE POSSIBLE BINANCE MONOPOLY ISN'T GOOD FOR ENTIRE CRYPTO MARKET? 🚩
If BINANCE get the monopoly at the market, the problem of BINANCE will be the problems of the entire crypto market. If Binance will got in trouble (hacked, robbed, DDOS-attacked, etc.), this will immediately affect the price of Bitcoin, and since 99% of altcoins follow it, altcoins will fall even more.
🚀The list of coins related to Binance:
🔥 BNB
🔥 TWT
🔥 CAKE
🔥 LINK
🔥 1inch
🔥 XVS
✅ Actually, the relation to Binance is the main reason why these coins just return to the accumulation areas, despite the other alts make -35-40% and go to the hell.
🚩 Traders, is this idea usefull for you? What do you think happen to Binance in the future? What coins do you recommend to buy at the bottom og the market?
💻Friends, press the "boost"🚀 button, write comments and share with your friends - it will be the best THANK YOU.
P.S. Personally, I open an entry if the price shows it according to my strategy.
Always do your analysis before making a trade!

🟢 DOTUSDT - 1D (08.10.2022)🟢 DOTUSDT
TF: 1D
Side: Long
SL: $5.4930
TP 1: $6.8478
TP 2: $7.3891
TP 3: $7.8265
Expecting big things from DOT. Which ever path it takes should lead to a break out.

DOTUSDT2 options for entry ,waiting for CHoCH on 5-15m tf and open long or short, follow the risk management and don't forget to put stop loss

Polkadot shortPolkadot broke trough the ascending trendline. Asset broke trough the support level. Bearish movement to support level at 5.75 is possible.


Trading opportunity for long position DOTUSDTBased on technical factors there is a Long position in :
📊 DOTUSDT - Polkadot
🔵 Long Now 7.06
🧯 Stop loss 6.65
🏹 Target 1 7.70
🏹 Target 2 8.70
🏹 Target 3 10.00
💸RISK : 1%
We hope it is profitable for you ❤️
Please support our activity with your likes👍 and comments📝

DOTUSDT 145 profit potentialrecently got 22% profit
now breaks another chart in daily tf
expecting 150% bulish wave

Dot update Ill take profit in my long position at 7.88$
I bought it at 5.8 $
Was good scalping for dot around 2 weeks
Then ill sell spot at 7.88 $
To 5-4.7 $
GOOD LUCK
POLKADOT UPDATE | DOTUSDWould be great to see a breakout above the falling wedge upper line with a retest to form inverse H&S
If that happens, could easily run 50% towards $9.3-9.5 area
Things take time.

Dot bearish trade 4HDot is in a support that now is a resistance so as we know if a lvl that before was a support or resistance is broke the next time that the que price goes to the lvl is the opposite ,that's the case of DOT the support works well but now isn't a support anymore so that means a long trade is absurd just for where is the price right now .

DOT/USDT - LONG 12H TF----- Welcome, dear followers! -----
- Here is my trading methodology. I trade with a normal system and analysis of resistance and support, as well as price reversal patterns.
- For the record, I do not place a stop loss within my trades. So that I only risk 1.5% of my total capital in order to support the loss due to a price reversal against me.
- If a price reversed against my expectation and touched the drawn line r3, then I transferred targets to the entry point and waited for the price to close at it with a loss equal to almost zero.
- Today's deal is shown in the chart, and here are the entry and exit points below.
-- Support me with numbers and follow up on my account for other deals in the future. Thank you for coming to this part. --
-------------------------------------------------------
⚡️⚡️ #DOT/USDT ⚡️⚡️
Client: My-Binance Futures
Trade Type: Breakout (Long)
Leverage: Cross (2X)
Entry Targets:
1) 6.9 - 100.0%
Take-Profit Targets:
1) 7.468 - 25.0%
2) 7.968 - 25.0%
3) 8.573 - 25.0%
4) 9.653 - 25.0%
Trailing Configuration:
Entry: Percentage (0.5%)
Take-Profit: Percentage (0.5%)
Stop: Breakeven -
Trigger: Target (1)


falling in DOTDue to the formation of the corner pattern, there is a possibility of falling to the specified range

US Rate Rise - How It Translates On The Top-10THE US had a rate hike which was as expected and yet we still see the charts go crazy, not just bitcoin but most of the top-10.
The one surprise was that inflation did not drop at the rate it was forecast to do. The drop was 0.1% and not 0.3% as expected.
So where to from here?
Well that depends on how we close this 24-hour range and if we can take the high of that candle out. We are not out of the pain zone just yet and I am waiting for a push to $22,000 for bitcoin to get that daily trend with some proper momentum. We haven't seen a daily trend on bitcoin that was more than a bear bounce since March 2021 so to see one now will give us cryptotraders plenty of options to work with so long as it's not in a single candle.
