$GLMR Potentially the Next Hidden GEMS at Parachain Ecosystem🔥GLMR or Glimmer is the one of project made by Moonbeam. It's like MOVR but GLMR running in DOT Ecosystem. Green Zone is the range of accumulation zone. if the range price can settle the market selling pressure, GLMR will be huge to in this range. Accumulation zone is in the chart. But i see a Bearish Rectangle in this zone. if it True the candle will break my bottom line.
DOT

In my DOTUSDT trackingDot 6.5-7.1 range daily closing stop below 6.5 suitable for buying. I follow sequentially as 7.7-8.4.

Polkadot (DOT) - August 18hello?
Welcome, traders.
If you "follow", you can always get new information quickly.
Please also click "Like".
Have a good day.
-------------------------------------
(DOTUSDT 1W Chart)
The key is to keep the price above 7.16 and move above 11.72.
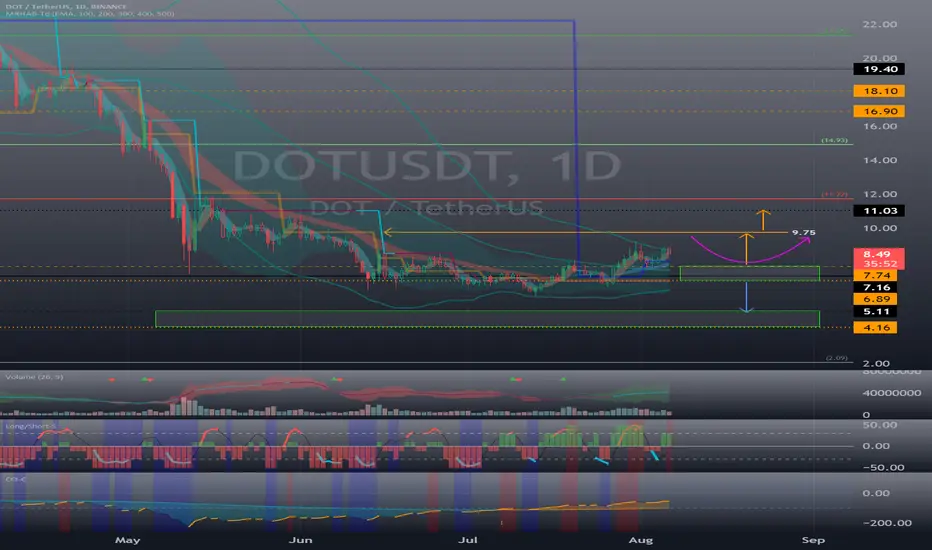
(1D chart)
Resistance: 11.72
Support: 6.89-7.74
To rise above 9.75, it must be supported and climbed at or above 6.89-7.74.
If not, you should be cautious as this could lead to further declines.
- As the RSI indicator declines in the overbought zone,
- The Stoch RSI indicator has entered the oversold zone.
Therefore, if the volume does not decline as the volume increases, it is expected to create a pull back pattern and rise.
------------------------------------------------------------ -------------------------------------------
** All descriptions are for reference only and do not guarantee a profit or loss in investment.
** The MRHAB-T indicator, which is inactive on the chart, contains indicators that indicate support and resistance points.
** Background color of Long/Short-S indicator: RSI oversold and overbought sections
** Background color of CCI-C indicator: When the short-term CCI line is below -100 and above +100, oversold and overbought sections are displayed.
** The OBV indicator was re-created by applying a formula to the DepthHouse Trading indicator, an indicator disclosed by oh92. (Thanks for this.)
(Short-term Stop Loss can be said to be a point where profit and loss can be preserved or additional entry can be made through split trading. It is a short-term investment perspective.)
---------------------------------

Rising Broadening Wedge DOT 4hrA Rising broadening wedge is a bearish pattern most of the times
must break resistance line of $9.17 and flipping it to support.
if failed and price fell again $8.96 is the last support line
Breaking all support lines would have a potential dump to $7
$9.67 would be our current resistance on the uptrend
breaking this resistance lead us to around $10.5 which is the upper resistance of the wedge


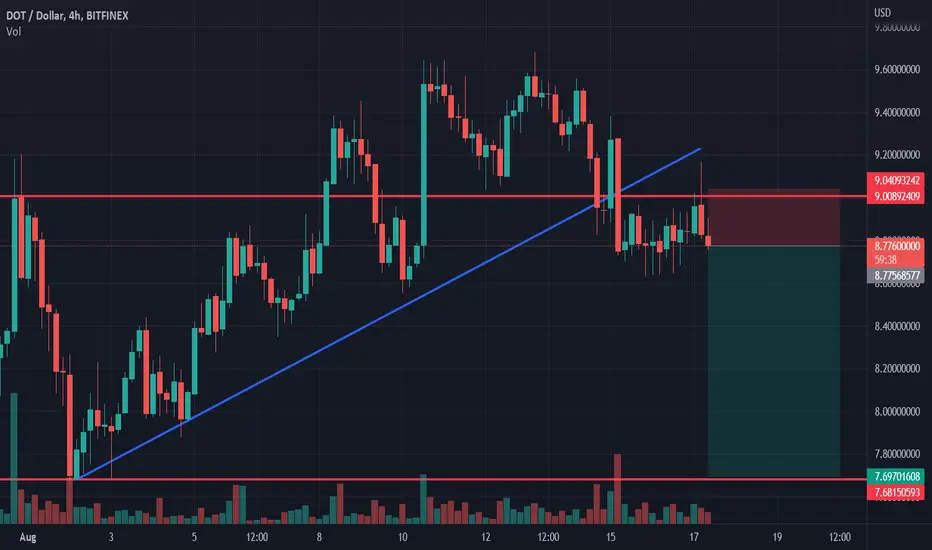
Polkadot shortPolkadot broke trough the ascending trendline. Asset broke trough the support level. Bearish movement to support level at 7.7 is possible.
DOTUSD - Falling Wedge Falling Wedge leading to a strong pattern break out
Below is an example of a similar Falling Wedge however on a different coin (NEO)

Polkadot DOT Entry Range, Take Profit and Stop LossDOT/USDT
Entry Range: $8.77 - 10.13
Price Target 1: $11
Price Target 2: $14.35
Price Target 3: $15.28
Stop Loss: $7.27

As I said 😎Hi everyone,
Yesterday I talked about how DOTUSDT was going to retest an important support level and bounce from it which it actually did. (link down below)
Today we are looking at BTCUSDT where we just did a retest of the lower time frame head and shoulders and we are now at the major resistance level.
In the last couple days, I mentioned that we were going to retest that resistance level multiple times and it did that. For now, I expect the price to consolidate a little bit on that resistance level before we break it to the upside.
Notice that we removed the liquidity that was sitting on top of the last peak.
In conclusion, I think that we are still bullish and we are going to make some nice moves the 2nd half of the year.
Please comment if you have any questions, I will try my best to answer them.
Thank you😊

Support and resistance zones for DOT / USDTWe managed to exit the downtrend channel marked with blue lines and change it to the current uptrend marked with yellow lines.
It is worth highlighting two areas of support that we have:
The first zone FROM $ 8.81 TO $ 8.24 and the second zone FROM $ 7.36 TO $ 6.78. THEN WE LOOK AT RESISTANCE ZONES AND CURRENTLY WE ARE TESTING A ZONE FROM $ 9.64 TO $ 10.61 IF YOU CAN CHOOSE IT, ANOTHER IMPORTANT RESISTANCE ZONE FROM $ 15.49 - $ 21.30.
IT IS WORTH NOTICE THAT ON A ONE-DAY INTEWRALE WE HAVE A LOT OF ENERGY FOR THE NEXT MOVEMENT AND THAT THE MACD INDICATOR CONFIRMS THE LOCAL IMPROVEMENT TREND.

Trading opportunity on DOTUSDT PolkadotBased on technical factors there is a Long position in :
📊 DOTUSDT Polkadot
🔵 Long Now 9.35
🧯 Stop loss 8.20
🏹 Target 1 10.10
🏹 Target 2 11.50
🏹 Target 3 13.00
💸Capital : 1%
We hope it is profitable for you ❤️
Please support our activity with your likes👍 and comments📝

DOT/USDT Pennant Flag 4hrIf we see DOT breaks the pennant flag with a confirmation, we could see a pump further to $10

Long DOT After a tough bear market we finally are getting a nice relief rally. Bullish Divergence on 3D+ TF, and solid Fibonacci support Levels. I believe we can reach some resistances above before going back down.

#Polkadot Remains Bulls despite DOT Slipping from H2 2022 HighsPast Performance of Polkadot
Like the rest of the crypto market, Polkadot is relatively suppressed when writing. There are hints of weakness, and the coin is down six percent on the last trading day versus the resurgent USDT. Still, buyers appear to be in charge in short to medium term. Notably, the August 8 bar is bearish, reversing gains of August 8, a net bearish.
#Polkadot Technical Analysis
Traders are upbeat, and DOT is up 50 percent from 2022 lows as prices bottom up. The immediate resistance is at $9.5, a price zone that also flashes with May 2022 lows. If buyers reverse August 8 lows and remain above $7.8 and the middle BB, every low may provide a loading opportunity as DOT flies to H2 2022 highs. This may provide an impetus for aggressive traders to buy on dips, targeting $10 and $12 in the medium term. However, if bulls struggle and prices drop below August 8 lows and 7.8, the odds of DOT slipping to $6.3 in confirmation of the August 1 bear bar will be elevated.
What to Expect from #DOT?
Polkadot is bullish and within a bullish formation as per the arrangement in the daily chart. Still, there must be confirmations, shaking off bears of August 8. Technically, DOT is bullish above $7.8 and may float to new H2 2022 highs if prices recover from spot rates.
Resistance level to watch out for: $9.5
Support level to watch out for: $7.8
Disclaimer: Opinions expressed are not investment advice. Do your research.

Polkadot: still moving up?The market is in the uptrend on the Daily timeframe. Another high of $9.27 was updated on August 8. And today the correction has started.
A pullback buying opportunity will appear after the correction is finished and a bullish candle is formed on the Daily timeframe. According to the price chart it may happen in a couple of days .
If the upward movement continues, then the price can move towards the main target #2 . It is the resistance level formed on May 29 – June 1. This target is around $10.44 – $10.78.
The longs will remain relevant until the market is above the nearest support level on the Daily timeframe, the lows of August 1 – 4.

Polkadot Testing Resistance A nice short term play if you made it! I shared in a previous post my idea that since we broke out of the previous level around 7-.750 that just over $9 would be tested and it has now happened however we could still play around this area and break down potentially so it shouldn't be a trigger to go long, this play is essentially over and now I'd be wanting to see how we react in this area.
If we continue to chop and hold around here then I'd look for longs, but for now need to see more PA develop because it's still unstable imo. If we do hold this area, I'd see upper resistance at 10-11 being tested at the least.
A good play as well from the bulldiv that I pointed out earlier.
Follow for more ideas!
Cheers

DotClose 50% of position in r\r2 and 50% in r\r7.You can close 50% of this with dow. When last pivot breaks.

Dot I suggest you close 50% of your positions on r\r2 and you can close 50% of your position on r\r5 or other TR target

Bears like Dot? Polkadot analysisIf open position after break SR lines you can set your target distance of TR or before of next line and you can set your stoploss under or over break candle but don't forgot a good break should don't have divergence and more than 50% break candle should influence.

DOTUSDT break out .. if 4h support confirms , I'll buy Dot very promising project after bitcoin and ethereum..
After big downtrend..it's reversing ..
Dot is one of the coin you must have in your portfolio.

DOT
#DOT $DOT
- Shark 🦈
- Daily Frame
#This is my technical opinion and not a recommendation to buy or sell

Polkadot (DOT) - August 7hello?
Welcome, traders.
If you "follow", you can always get new information quickly.
Please also click "Like".
Have a good day.
-------------------------------------
(DOTUSDT 1M Chart)
The key is whether it can be supported by rising to the 11.72-14.93 section.
(1W chart)
In order to rise to the 11.72-14.93 range, the key is whether the price can be maintained above the 7.16-7.74 range.
(1D chart)
Primary resistance: 9.75
Secondary resistance: 11.03-11.72
Support: 6.89-7.74
A drop near 9.75 is likely to create a pull back pattern.
At this time, you need to check if it is supported in the 6.89-7.74 section.
The 11.72-14.93 interval is the interval that determines the trend.
Therefore, if it rises to 11.72-14.93 without being supported and falls, it is necessary to stop loss to secure cash.
Therefore, when it falls below 11.03 and receives resistance, it must be Stop Loss.
If you look at the overall chart, you can see that the current price position is at a fairly low price point.
It is good to get short-term profits by investing in coins or tokens in this price range, but I think it is better to increase the number of coins (tokens) from a mid- to long-term point of view.
To do this, it is necessary to check which ecosystem the coin (token) you want to invest in belongs to and is expanding.
This is because I do not think it is good to invest only with the roadmap or future-oriented plan (?) pursued by the coin (token) in a situation that is being combined with the actual business aspect.
The time has come to examine whether the coin ecosystem of the coin (token) you want to invest in is expanding and whether it is useful in actual business.
This is because the era in which themes such as DeFi, NFT, and P2E are created, interest is received using deposit services, and value can be traded through games has begun.
Investing in active coins (tokens) rather than investing in inactive coins (tokens) will give you the strength to survive in the uncertain coin market.
------------------------------------------------------------ -------------------------------------------
** All descriptions are for reference only and do not guarantee a profit or loss in investment.
** The MRHAB-T indicator, which is inactive on the chart, contains indicators that indicate support and resistance points.
** Background color of Long/Short-S indicator: RSI oversold and overbought sections
** Background color of CCI-C indicator: When the short-term CCI line is below -100 and above +100, oversold and overbought sections are displayed.
** The OBV indicator was re-created by applying a formula to the DepthHouse Trading indicator, an indicator disclosed by oh92. (Thanks for this.)
(Short-term Stop Loss can be said to be a point where profit and loss can be preserved or additional entry through split trading. It is a short-term investment perspective.)
---------------------------------
DOT / USDT - BUY and Forget About ItDOT Polkadot Buy it while it's still cheap so you don't have to cry later like a punk.
