Catching Knives - Potential for Some Small Relief For AltcoinsThe title is pretty self-explanatory. Sure, prices can keep collapsing into the abyss. I have little enough exposure where this wouldn't hurt me a huge amount. It's important for me to be very conservative. There is nothing that says we need to recover here.
Many alts are back to their accumulation ranges from the previous bear market, so it seams reasonable to expect at least SOME buying action. For instance, Polkadot has now retraced nearly its entire bull market rally. In January when price was still above $25, I wrote about how there was serious risk for it to break the long term uptrend, and head back towards the $7-11 range. Here is the original post from January:
Even prior to that, in November 2021 I wrote about how I thought DOT may have reached its long term top against Bitcoin. This has proven to be correct as well. In fact, looking at this chart tells me that it still has potential to fall. Perhaps it won't get a longer relief rally until those lower levels are reached.
Regardless, I picked up some DOT here near $7.20. I also rebought ALGO at $0.29 after stopping myself out of a spot trade from $0.39 not too long ago. These are not necessarily meant to be a long term positions. I may even sell them tomorrow if things seem even less likely to turn around here. My strategy is different than it was during the 2018 bear market. Back then, my strategy was to accumulate as much as I could afford, within reason. Now my strategy is to simply see if I can time the occasional bounce. If I do see signs that the market could rally again in the future like it did in 2017 and 2021 I will change my tune a little. Even so, I see little use for cryptocurrencies in our world. I acknowledge that this may change as well, although honestly I'd prefer to see adoption over price appreciation.
If the market bounces, it can last for anywhere from a week or two to several months. No one knows. My speculation is that a bounce would yet again involve altcoins outperforming Bitcoin, while larger whales unload their BTC in the $30-40k range. But then, this would imply that Michael Saylor would be able to exist at break even, or in profit. Will the market give that to him? More bullish behavior would be Bitcoin pumping right back to $42k while alts begin to really lag, as we began to see in 2019 once the bottom was in. Something like this would begin to invalidate my longer term bearish view.
On the bearish side here, if DOT can't hold above $7 for long, it can head down to the next support level, between $4-5. Similarly with ALGO, if it can't hold above $0.26-27, it can head down to $0.16. Dumps like this continuously happened in 2017, but at least back then there was the occasional mega relief rally for altcoins. This time, we may not get those opportunities, so I'm being especially careful.
This is not meant as financial advice! This is meant for speculation and entertainment only.
-Victor Cobra
DOTBTC

Polkadot (DOT) - July 11Hello?
Traders, welcome.
By "following", you can always get new information quickly.
Please also click "Like".
Have a good day.
-------------------------------------
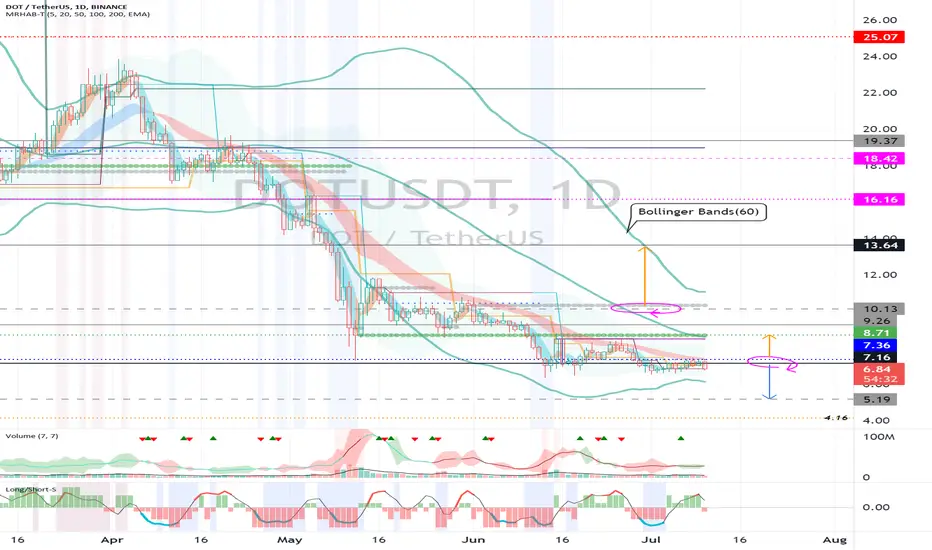
(DOTUSDT 1W Chart)
Below 10.13 is likely to be a mid- to long-term investment area.
In particular, 7.16 and below are likely to be long-term investment areas.
Therefore, it is important to know whether it can move higher than 7.16.
(1D chart)
The contraction period of the Bollinger Bands (60) is short.
Therefore, a trend is expected to form in the near future.
It is expected that the period from the decline of 7.16 to the vicinity of 5.19 until it rises again to the vicinity of 7.16 is expected to be short.
Therefore, if you fail to overcome the psychological burden and make a stop loss when it leads to a further decline, there is a high possibility of a double loss.
Therefore, it is recommended to create room to buy when the price is falling.
The market can be very volatile if the BTC dominance declines while the BTC price is still in a downtrend.
It can be characterized by repeated short-term spikes and dips.
You need to think about whether you can't take advantage of it with your trading skills.
You should try to earn cash income by short-term trading coins (tokens) that you currently have or increase your holdings.
Otherwise, starting an investment in a new coin (token) may require a long period of time to turn into a profit even if the coin market turns upward as the dispersion of funds accelerates.
------------------------------------------------------------ -----------------------------------------------------
** All indicators are lagging indicators.
Therefore, it is important to be aware that the indicator moves accordingly with the movement of price and volume.
However, for the sake of convenience, we are talking in reverse for the interpretation of the indicator.
** The MRHAB-T indicator used in the chart is an indicator of our channel that has not been released yet.
** The OBV indicator was re-created by applying a formula to the DepthHouse Trading indicator, an indicator disclosed by oh92. (Thanks for this.)
** Support or resistance is based on the closing price of the 1D chart.
** All descriptions are for reference only and do not guarantee a profit or loss in investment.
(Short-term Stop Loss can be said to be a point where profit and loss can be preserved or additional entry can be made through split trading. It is a short-term investment perspective.)
---------------------------------
PolkaDot DOTUSDT - ABC completed! Elliott Wave + Channel- On the weekly/3D chart we can see a parallel channel and the price is currently on the support of the channel.
- Due to my Elliott Wave analysis - the ABC correction has been completed successfully and now we are prepared for another bullish market!
- 0.618 FIB is the strongest FIB level and the price si currently sitting on this level.
- If we take a look at the RSI indicator, we can spot a nice bullish divergence with a lower high!
- Wave 1 horizontal support (previous swing high) from 2020 is another great support that we have.
- Look at my ideas about another interesting altcoins in the related section down below ↓
- For more content, please hit "Like" & "Follow"!

DOT/BTC Secondary TrendSecondary trend. The graph is logarithmic. Timeframe 3 days. A falling wedge is forming in this secondary trend.
The % growth / fall of the price in the event of the development of certain price movements (breakthrough / no breakthrough, fixing / not fixing) relative to key levels and zones is shown on the chart.
The same indicators on a line chart.
Main trend.
A huge harmonious pattern is formed, with impressive target.
DOT/BTC Main trend

DOTUSD Long Term Bullish Projectioni am Looking #Dotcoin 80$ and 200$
Time is Money
Best regards Zeeshan Butt

DOT triangle breakoutPokadot seems to be ready to break up this triangle 📐 and if successful I think there is chance for run to 10.25 and even higher. Just bought...
ENTRY : local high @ 8.10
STOPLOSS (SL) : local low @ 7.80
TARGET (TP) : height of the triangle projected from midpoint of the local range (BUY - SL) @ 10.25
REWARD RISK RATIO (RRR) : 7.1
INVALIDATION : when SL level hit
Check my other stuff in related ideas.
Please like👍, comment🗣️, follow me✒️, enjoy📺!
⚠️Disclaimer: I'm not financial advisor. This is not a financial advice. Do your own due dilingence.

Polkadot (DOT) - June 24hello?
Traders, welcome.
By "following", you can always get new information quickly.
Please also click "Like".
Have a good day.
-------------------------------------
(DOTUSDT 1W Chart)
3 important segments
- 9.26-10.13
- 13.64
- 18.42-19.37
An upward break above the key zone is required to continue the uptrend.
(1D chart)
Resistance: 9.26-10.13
Support: around 7.16
It needs to rise above 8.71 in order to turn to an uptrend in the short-term and mid-to-long term.
However, it is expected that the upward trend will continue only when it rises above the critical section 9.26-10.13.
------------------------------------------------------------ -----------------------------------------------------
** All indicators are lagging indicators.
Therefore, it is important to be aware that the indicator will move accordingly as price and volume move.
However, for the sake of convenience, we are talking in reverse for the interpretation of the indicator.
** The MRHAB-T indicator used in the chart is an indicator of our channel that has not been released yet.
** The OBV indicator was re-created by applying a formula to the DepthHouse Trading indicator, an indicator disclosed by oh92. (Thanks for this.)
** Support or resistance is based on the closing price of the 1D chart.
** All descriptions are for reference only and do not guarantee a profit or loss in investment.
(Short-term Stop Loss can be said to be a point where profit and loss can be preserved or additional entry can be made through split trading. It is a short-term investment perspective.)
---------------------------------


DOT - is starting to outperform bitcoin !!As many altcoins, DOT has started to clearly outperform Bitcoin !!
Will be interesting to see how this further develops ....

DOT/USDT BUYING SETUP (SCALPING)Buying #DOT/USDT (SCALPING)
$DOT Breakout Ascending triangle and now has retesting . when correction showing low volume this is good for movement
BTC potential IHNS pattern and this the reason i brave to scalping setup
Buy zone : 7.6 - 7
Target : 7.88 - 8.2 - 8.49 - 8.79 - 9 - 9.5
Stop : 6.5


DOT - Buying Zone
Still 20% downside potential from a BTC move to $20k but we are starting to see buying with DOT/BTC gaining strength.
Entry Target $5, Exit @ $23 / 50WMA (blue line)
Best, HF
Approach
DOT TOP

Polkadot (DOT) - June 7hello?
Traders, welcome.
By "following", you can always get new information quickly.
Please also click "Like".
Have a good day.
-------------------------------------
(DOTUSDT 1W Chart)
The section below 9.26-10.13 may be a mid- to long-term investment area.
To create a new wave, it must rise above 19.37.
(1D chart)
In the short and medium term, it needs to move above 10.13 and find support to turn into an uptrend.
However, since the MACD-P indicator point is formed at 11.03, the key is whether it can rise above this point.
If it falls below the 8.71-9.26 range, it may lead to further declines, so you need to trade cautiously.
(buy)
- After confirming the support in 11.03
(Stop Loss)
- When it falls below 10.13 and receives resistance
- When it falls below the 8.71-9.26 section
(Sell)
- When receiving resistance near 13.64
- When receiving resistance in the section 17.98-19.37
------------------------------------------------------------ -----------------------------------------------------
** All indicators are lagging indicators.
Therefore, it is important to be aware that the indicator will move accordingly as price and volume move.
However, for the sake of convenience, we are talking in reverse for the interpretation of the indicator.
** The MRHAB-T indicator used in the chart is an indicator of our channel that has not been released yet.
** The OBV indicator was re-created by applying a formula to the DepthHouse Trading indicator, an indicator disclosed by oh92. (Thanks for this.)
** Support or resistance is based on the closing price of the 1D chart.
** All descriptions are for reference only and do not guarantee a profit or loss in investment.
(Short-term Stop Loss can be said to be a point where profit and loss can be preserved or additional entry can be made through split trading. It is a short-term investment perspective.)
---------------------------------

DOT DAILY CHARTHELLO GUYS
my opinion is clear on the chart. please let me know what you think.
thank you so much

$DOTUSD Bullish divergence on RSI on 1Hour for weekend to $10Many Bullish divergence formed on RSI at 1 Hour following each other.
Weekend pump of Polkadot $DOT to 10 Dollar till Monday and possible above as 6th June is Pentecost Monday holiday in almost all European countries.

DOT/USDT BUYING SETUPDOT Breakout descending channel we can entry now or wait retest first
MACD showing bullish crossover
Buy zone : 10.25 - 9.4 - 8.6
Target : 10.77 - 11.99 - 13.63 - 16.33
Stop : 8

#DOT/USDT 2HOUR UPDATE !Welcome to this quick DOT/USDT analysis.
I have tried my best to bring the best possible outcome in this chart.
Reason of trade:- DOT/USDT PARALLEL CHANNELdown side buy the green zone. PARALLEL CHANNEL.
Entry:-$8.57,$8.78
Traget:- 15%
Stoploss:- $8.05
Remember:-This is not a piece of financial advice. All investment made by me is at my own risk and I am held responsible for my own profit and losses. So, do your own research before investing in this trade.
Sorry for my English it is not my native language.
Do hit the like button if you like it and share your charts in the comments section.
Thank you...

DOTUSDT - SETUPDOTUSDT price is trading in a channel and showing weakness on a large timeframe. but in the short term price can hit the bottom of the channel and will try to recover. So one can attempt with strict stop loss.

DOTBTCbullish cfork
btc.dominance looks bearish
24% on offer here vs btc if we can bounce the btcrpice and totalcaps
dot eco coins bullish movr glmr astor all looking strong
dxy bearish and continuing to look so
alts nuked like crazy total 3 completely capitulated druing the luna incident
parachain still underated..
could be a generational long opp if the market returns bullish this year.
high risk out there rn tho be careful

#DOT/BTC 1DAY UPDATE BY CRYPTOSANDERS !!Welcome to this quick DOT/ BTC analysis.
I have tried my best to bring the best possible outcome in this chart.
Reason of trade:-DOT/ BTC PARALLEL CHANNEL and buy the green zone and (SPOT CALL)
Entry:-0.0003000,0.0003333
Traget:- 50%
Stoploss:- 0.0002722
Remember:-This is not a piece of financial advice. All investment made by me is at my own risk and I am held responsible for my own profit and losses. So, do your own research before investing in this trade.
Sorry for my English it is not my native language.
Do hit the like button if you like it and share your charts in the comments section.
Thank you...

Polkadot (DOT) - May 18hello?
Traders, welcome.
By "following", you can always get new information quickly.
Please also click "Like".
Have a nice day.
-------------------------------------
(DOTUSDT 1W Chart)
The key is whether you can get support and rise in the volume profile section formed in the section 9.26-10.13.
In order to continue the upward trend in the medium to long term, it should rise above the 18.42-19.37 section.
(1D chart)
Since 9.26-10.13 is a mid- to long-term investment area, careful trading is required.
Therefore, it is important to see support by moving above 13.64.
However, since a volume profile section is also formed around 19.37, it is expected that the upward trend can be continued only when it rises above 19.37.
Therefore, below the 19.37 point, you need to conduct a transaction by purchase unit price to increase the number of coins you have in a transaction method that increases the number of coins for profit.
If possible, we recommend making a full-fledged investment in Jinhae after confirming the support at 19.37.
------------------------------------------------------------ -------------------------------------------
** All indicators are lagging indicators.
Therefore, it is important to be aware that the indicator will move accordingly as price and volume move.
However, for the sake of convenience, we are talking in reverse for the interpretation of the indicator.
** The MRHAB-T indicator used in the chart is an indicator of our channel that has not been released yet.
** The OBV indicator was re-created by applying a formula to the DepthHouse Trading indicator, an indicator disclosed by oh92. (Thanks for this.)
** Support or resistance is based on the closing price of the 1D chart.
** All descriptions are for reference only and do not guarantee a profit or loss in investment.
(Short-term Stop Loss can be said to be a point where profit and loss can be preserved or additional entry can be made through split trading. It is a short-term investment perspective.)
---------------------------------

dotusdt 11.05Project dot
In my opinion, the price floor maintains the price of $ 7 or 5 $ and there is a possibility of such a pattern

$DOT 3D Support Break + Adam and Eve Variation$DOT / Polkadot has broken a huge 3D support around 10.57, shown with the recent 3D candle's retest and failure, thus far. Big sell volume as well on the drop indicating it is likely a true move and not a fake.
I have not traded an Adam and Eve before, and this looks to be a variation of such, I think, don't quote me.
Levels are as follows, invalidated above 10.6 close.
