DOTUSDT - bullish trendPreconditions:
- key level
- trendline
- buy after break out
- locally uptrend
- global uptrend
You will learn the best place where we can trade this instrument at low risk.
Write in the comments all your questions and instruments analysis of which you want to see.
Friends, push the like button, write a comment, and share with your mates - that would be the best THANK YOU.
P.S. I personally will open entry if the price will show it according to my strategy.
Always make your analysis before a trade
Dotlong

Dotusdt analyze , by crypto veteran Daniyaldaraei Everything is super clear
It can get bullish and hit all three targets
Enjoy 😉

DOT/USDT 1. That yellow line corresponds to the possibility that the bitcoin correction is over and we're going for a new ATH
2. If btc changed his mind and continued the correction, we would have 3 more waves in wave C waiting for us at DOT.
For me, I like the second option more because DOT is an interesting project and so there would be better prices for the purchase. We would also thicken these zones more, which could act as stronger supports in the future. We still have enough days left in the month, we will see how the market decides, in any case the second option would be more advantageous in the long run :chart_with_upwards_trend:

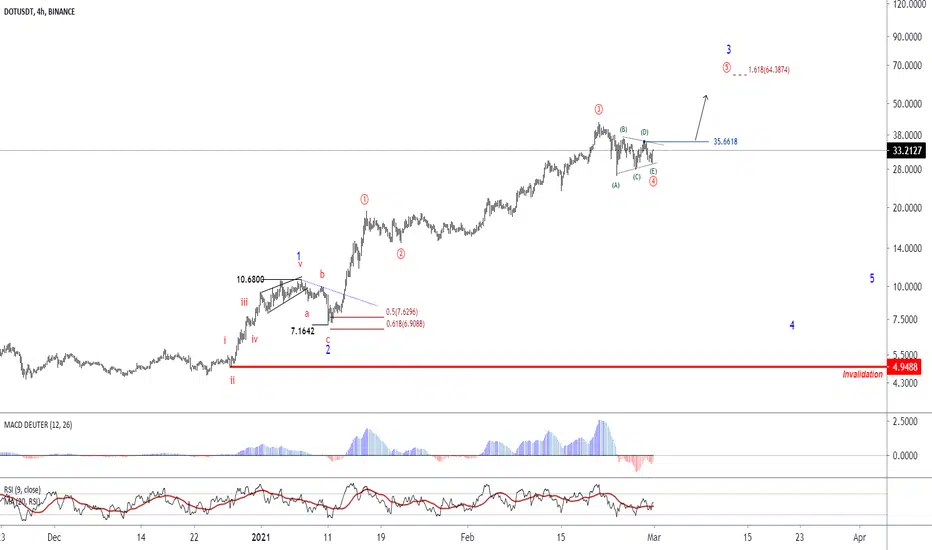
polkadot - Bullish TriangleIn the 240-minute chart and in the 4th wave, from the sub- waves of 3rd wave, a triangle pattern has been formed, which is being confirmed by crossing the price from the range of 35.66, and can form an ascending trend up to the range of $ 64.
Update Polkadot Buy Opportunity 68% Gain From Current PricePolkadot (Dot) Buy opportunity! Potential 68%+ Gain to set a New ATH of $50 at the 161.8% Fibonacci Level. Dot's price soared to a high of $42 on 20/02/21. Since setting this new ATH , it has lost some momentum, retracing down to a low of $26 on the 23/02/21 after such an impulsive move, but currently it is still trading 45% above this low 4days ago on the 23/02/21.
The fundamental outlook for Dot in the long-term is great and still very much bullish , its total Market Cap is at $33.7 billion and currently ranked 6th biggest digital currency in the world after Bitcoin , Ethereum , Cardano, Binance Coin and Tether. Over the coming month we expect Dot to retest the previous ATH of $50 at the 161.8% Fibonacci extension .
Note this may not be a straight forward push, but a bullish momentum powered by 3 push phases. Use the Buy Zone area to map your entries, Zone 1 at the 23.6% level and Zone 2 at 61.8% Golden ratio. Overall, there is a high probability that Dot's price will break out higher (68% Gain from current price levels) as the bulls target the next resistance at $50.

DOT Buy a break.DOTUSDT - Intraday - We look to Buy a break of 35.22 (stop at 33.68)
Daily signals are bullish.
A break of bespoke resistance at 35.00, and the move higher is already underway.
Our bias remains bullish and further upside is expected to target resistance at 40.00.
Dips continue to attract buyers.
Our profit targets will be 39.86 and 41.88
Resistance: 35.00 / 38.00 / 40.00
Support: 33.30 / 30.00 / 29.00

DOT clear uptrend !!DOT / USDT
i believe this coin still have much room of growth this year ..we can see in chart clear uptrend
My last buy signal to my members was given at 18-19$ and still holding
We can see in chart
Play in ascending broadning wedge
Every time daily candel touch 20 EMA = PUMP
🚨 Invalidation of uptrend = daily candle close below 20EMA or loss of lower trendline
Good luck

DOT/BTC another Breakout soon ?DOT / BTC
price show bullish accumulation pattern against BTC pair in previous high swing area
Holding above MA 20
The volume is strong
From previous experience...it can do massive Breakout soon..but if only BTC keep calm and Dominance drop a little
You can check too my previous idea about DOT against Tether (USDT) pair here 👇
Good luck

DOTUSDT MIDTERM LONG POTENTIAL PATTERNDot Long buy setup Idea
I think if everything goes fine and BTC roams around 46-52k Then Dot will have a long big green candle .
we can see potential buy order at 27.5-28.5
and potential sell order at 36-38
27 and downwards should begin the downtrend for at least 2-3 days

Polkadot 22$lets do it again.
Bullish Ascending Triangle.
All in Graph.
i add rebuy zones in case of BTC dip.
TP : 22$
------------------------
Rebuy zone 1: 14$
Rebuy zone 2: 11.5$
------------------------
Stop Loss : No need for DOT.
invest wisely and don't go all in.
Happy Tr4Ding

DOT/USDT LOOKING FOR ANOTHER LEG UP Hey hey my friends happy MONDAY 🤠
Dot\usdt Looking really good for another leg up here!
We had a resistance support flip as you can see with the green arrow with a breakout of the previous high with volume confirmation with the blue arrow!
🎯 Is aiming for over 25 short term
Enjoy 🙂

#DOTUSDT DAILYHi guys..its the latest analyze chart of DOTUSDT in daily time frame .if you are interested any crypto that you want analyze with me and any questions please do not hesitate and comment below the chart!
if u like it press like-comment and folow me.thx

DOTUSDTDOTUSDT (4H CHART) Technical Analysis Update
DOT/USDT currently trading at $19.60
Buy-level:$18-$20( Wait for the small retracement)
Stop loss: $16.95
Target 1: $25
Target 2: $30
Max Leverage: 2X
ALWAYS KEEP STOP LOSS...
Follow our Tradingview Account for more Technical Analysis Update, | Like, Share and comment your thoughts.

DOT vs USDT --LONG-- 03.02.21Buy the resistance breakout
SL - below the local low
Targets - lines above the entry

$DOT If you don't have, now is time to buy someIf you don't have yet $DOT in your portofolio, now is time to buy some.
Looking ready for next leg up...
- Macd is crossing bullish on 4H
- Big support on 15$ area, 4H chart we have some doji there and also bullish engulfing candles
Buy Spot (own the coins), no leverage, easy profit of 60% .... Target 27$
Cheers!!!

DOTUSDT - price movement analytics! To new heights!Greetings to all crypto maniacs! Taking analytics to the next level!
DOTUSDT - the coin moves inside an ascending channel. In a five-wave structure of growth. Now we see a correctional movement in wave 4, which has not yet been completed. Wave 4 levels are marked in yellow on the chart. The levels 14.92 and 13.46 are in the corrective movement. The level of the corrective movement of 14.92 has already been worked out. Upon completion of the corrective movement, the upward movement in the fifth wave is expected to continue to the levels marked in white on the chart.
If we consider the correctional movement within the 4th wave, then it is not completed yet. And in case of breakdown of the lower trend line of the correction triangle, the continuation of the corrective movement is expected within the levels marked in yellow. That does not cancel the subsequent upward movement.
Successful bidding!
You know where to find more of my analytics and useful information!
Join our community! Information in the page status!
Thank you all for your attention!
Don't leave without a like and a comment, and if you liked my analytics, subscribe, and you definitely won't miss anything!
Disclaimer!
I do not give entry and exit points.
I share with you my opinions and ideas, which may differ from yours.

DOT Polkadot Long Trade plan , support at 15After a clean 5-wave move, C wave is near completion with continuation expected to the upside

LONG DOT H4DOT is showing its respect to EMA21, it also broke an important resistance. Long it. R:R is so nice.
Follow me right now not to miss newest updates and signals about crypto market!

Will DOT continue its awesome high?Yes it seems so.
DOT that has risen with strong strength now looks to be forming a high triangle.
Even after going up more than 400% it can still go up more.
It is quite impossible to enter this rocket. The risk return may not be worth as much.
But we could bet a little on the continuation of the movement that is projected above $30.
I make an alert here for the management and the return risk of an operation like this.
In the graphic I'm showing the 2 ways I expect.
The first one is an ABCDE wave and the other a movement a little lower.
that can handle this blue medium plotted .
The market for CRYPTOCURRENCY is still very confidence and greedy and the trend will continue as long as it is not reversed.
Not for now.
This analysis is complementary with a point of view based on technical analysis.
Touch like and share if it has been useful.

DOT USDT, long continue. Traders closing the deals very fast.Hi friends. Like you can see traders closing the deals very fast. So Exchange purchase it and now long will continue. I think we can took 19 in near future and maybe upper. Levels thanks to X-Lines script. Volume analysis modified "Earned" script. Follow me.

DOTUSDT, long will be. Bulls are still on the market.Hi friends. So today DOTUSDT. And i mark all interesting processes on the chart window. Like you see we have big investitions between 16.1 - 16.5 then fake downward (like test to know traders waitings). On this downward nobody closing (its becouse nobody in long). Then big investitions from exchange side and growth. On this little growth traders start to buy that way trend will have small correction and then going up to 19 and upper.
Levels thanks to X-Lines script - Follow me.

Polkadot DOT 4 hours vs 1 Day timeframePolkadot DOT receives a buy signal on the 4 hours timeframe and another buy on the daily.
Please leave me a message if you want to test the buy and sell indicators that i am using.

Dont sleep on DOT
DOT has still more room to go up if the market stays stable ofc...
consolidating nicely after each impulsive wave up.
